Comparative Performance of a Parallel Implementation of
an Internet-Scale Zero-Day Worm Epidemiology Simulator
Luc Tidy*, Steve Woodhead, Jodie Wetherall
Internet Security Research Laboratory, University of Greenwich, Chatham Maritime, Kent, ME4 4TB, UK.
* Corresponding author. Tel.: +44(0)1634883915; email: [email protected] Manuscript submitted October 3, 2014; accepted May 25, 2015.
doi: 10.17706/ijcce.2016.5.1.11-22
Abstract: The threat posed by fast-spreading malware is significant, particularly given the fact that network operator/administrator intervention is not likely to take effect within the typical epidemiological timescale of such infections. The cost of zero-day network worm outbreaks has been estimated to be up to US$2.6 billion for a single worm outbreak. Zero-day network worm outbreaks have been observed that spread at a significant pace across the global Internet, with an observed rate of reaching more than 90 percent of vulnerable hosts within 10 minutes. An accepted technology that is used in addressing the security threat presented by zero-day worms is the use of simulation systems, and a common factor determining their efficacy is their performance. An empirical comparison of a sequential and parallel implementation of a novel simulator, the Internet Worm Simulator (IWS), is presented detailing the impact of a selection of parameters on its performance. Experimentation demonstrates that IWS has the capability to simulate up to 91.8 million packets transmitted per second (PTS) for an IPv4 address space simulation on a single workstation computer, comparing favourably to previously reported metrics. It is concluded that in addition to comparing PTS performance, simulation requirements should be taken into consideration when assessing the performance of such simulators.
Key words: Malware, network worm, simulation, computational performance.
1.
Introduction
This paper defines a zero-day worm as a type of malware that exploits a vulnerability that has not been patched or acknowledged at the point of an outbreak, which owing to an automatic propagation method can spread pervasively throughout a network; which is exacerbated by either a lack of detection or speed of propagation [1]. In order to tackle such outbreaks an understanding of how they occur, their propagation method, and their epidemiological characteristics across a given network is essential [2]. Worms are often hard to prevent, counter, or contain, primarily owing to their potential speed of propagation; ranging from fast random-scanning worms to slower 'stealthy' worms that employ various techniques to propagate undetected. In order to aid the analysis of zero-day worm epidemiology analytical models, such as [3], and simulation systems, such as [4] have been adopted.
Since the widespread worms that occurred in the first four years of the 21st century, such as Code Red (2001) [3] and Slammer (2003) [10], there have been a series zero-day worms such as Conficker [11] in 2007 and Duqu [12] in 2011. These can incur significant costs, with one estimation for the cost of the Code Red outbreak reaching US$2.6 billion (circa. 2002) and Slammer reaching US$1.2 billion (circa. 2003) [13]. It is imperative that defences are employed in order to mitigate or prevent such worm outbreaks. Simulation systems provide a tool which can aid research into worm analysis [10], network worm countermeasures [14], [15], and hypothetical network worm analysis [5], [16].
Performance is an intrinsic part of assessing a worm simulators applicability, as often there is a demand for faster simulation given the current and hypothetical speed at which worms can spread [16]. One such method that is commonly used to increase the performance of worm simulators is the use of parallelisation [17]-[19] however; these have only been commonly applied or compared when using a cluster with many discrete nodes. With the growing availability of multiple-core processors their performance when applying parallelisation techniques can be assessed.
Using the Internet Worm Simulator (IWS), as a simulator able to simulate the entire IPv4 address space on a node-by-node basis [20], the authors focus on assessing a sequential and parallel implementation of the simulator. IWS is used to compare the two different implementation methods, and their effect on the number of packets transmitted per second (PTS) [19]. The effect of altering various simulation parameters on the two different implementations is presented, and the difference in application of a parallel simulation in comparison to a sequential simulation is discussed.
The remainder of this paper is presented as follows: Section 2 summarises the related, relevant work to the study; Section 3 discusses the design of IWS and its sequential and parallel implementations; Section 4 details the experimental methodology used, and the parameters used; Section 5 presents the results of this experimentation; Section 6 presents an analysis of the work, given existing theory; and Section 7 considers the context and impact of the work. Finally Section 8 presents a conclusion of the study, identifying its original contribution, limitations and future work.
2.
Relevant Previous Work
A selection of reported worm simulators have employed different design methodologies, and have focused on different methods of worm simulation. Owing to the focus on the performance of worm simulation, this paper focuses on two main areas; parallel worm simulation implementations, and metrics used when testing performance.
2.1.
Parallel Worm Simulators
A selection of computational worm simulators have either utilised or propose to utilise parallelisation, for instance Bajaj et al. [17] proposed the implementation of parallel techniques in 1999 as part of improving the performance of the GloMoSim worm simulator. Around the same time Riley et al. [18] implemented a parallel, distributed version of the ns simulator (PDNS) [21], which although not focused on simulating worms reported a significant increase in simulation speed. Since then some notable instances of parallel worm simulators include GTNetS [22], SSFNet [23] and further development of PDNS [19], which demonstrate a significant performance improvement in comparison to their sequential counterparts. A focus on reducing the execution time of worm simulators is two-fold, either focusing on parallelisation as a method of increasing fidelity or improving worm simulators to better facilitate research [19].
2.2.
Performance Metrics
describes the overall number of packets generated by the simulator over wall-clock execution time, this means that no matter the given scenario, or raw wall-clock execution time, the efficiency can be measured given the main purpose of the worm simulator is to generate and transmit packets. Other methods have been proposed, such as [18] where performance is measured in comparison between a parallel and sequential implementation providing a comparative value, however, the authors chose to present the results using PTS to allow for a broader comparison.
2.3.
Summary
Based on the previous work undertaken it is hypothesised that by using parallel methods the execution time and performance of the Internet Worm Simulator (IWS) will improve significantly, and the extent of which will be determined by the type of parallelisation employed. Additionally, it is hypothesised that a parallel implementation of IWS should be able to complete a simulation in less time than it takes a fast, random-scanning worm outbreak to complete. Reported figures of the existing speed reached by simulators that utilise parallel methods are as high as 106 million packets transmitted per second (PTS) on clusters of processors up to 1,536 nodes. Using a single processor the same simulators were able to reach approximately 95,000 PTS, demonstrating an increase as the number of processors increased [19], [24]. As a comparison, IWS is intended for use on a single workstation however, with the modern advances in multiple-core processors and the increase in memory capacity parallelisation that was only achievable in clusters can now be implemented on a single workstation. Therefore it is beneficial to test a network simulator designed to reach as high a performance as possible on such a multiple-core processor, such as IWS, and compare it to previously reported metrics.
3.
Design
The simulator reported in this paper was developed with the intention of employing it in an investigation of the epidemiology of existing and hypothetical worms. It adopts the finite state machine approach [1] in order to simulate a full IPv4-sized network. Two implementations have been developed; a sequential implementation that uses a single processor core, and a parallel implementation that splits workload across multiple cores.
The Internet Worm Simulator (IWS) was developed in the C programming language, using the GCC compiler under a 64 bit architecture. IWS only requires one byte of memory per simulated host; this means for an IPv4 sized network it has a memory footprint of approximately 4GB. The parallel implementation uses the POSIX threads API [25] to manage its parallel processes. Owing to these specifications IWS can be executed on a number of 64 bit operating systems, such as Windows or Linux, and can also be run on a variety of different hardware configurations.
The sequential implementation performs simulated infection attempts, i.e. sending malicious packets, in a serial manner, whereas the parallel implementation splits these into discrete workloads to be carried out in parallel. For this comparison only the function block that handles these attempts has undergone parallelisation, as under profiling the call graph identified that 98.7% of the sequential implementation is spent executing this function block. In contrast other function blocks exhibit less than 1% of the execution time, and as such have not been considered for parallelisation.
IWS can be modified for a variety of different scenarios using a series of user-defined parameters that detail: the worm propagation method, the network composition, the worm packet size, the initial number of infected hosts at the point of simulation start, and the total number of susceptible hosts. The focus of this paper is on modifying the latter three parameters, with a random-scanning propagation method and a random network composition. The exact parameters used for the experiments are detailed in Section 4.
4.
Experimental Methodology
An aim of this paper was to undertake an empirical comparison between the sequential and parallel implementations of the Internet Worm Simulator (IWS). A range of scenarios are considered in order to determine their impact on the performance of the simulator. These have been stratified into three categories, low, medium and high, that represent relative boundaries and a mid-point for each of the three parameters. This is performed as part of a case study, where the values are based on both previous worm outbreak data and hypothetical scenarios. As a representative sample of large-scale empirical worm outbreak data the three previous worm outbreaks that have been used to derive experimental values are; the Code Red worm of 2001 [3], the Slammer worm of 2003 [10], and the Witty Worm of 2004 [27].
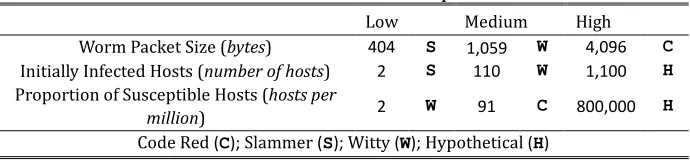
Table 1 details the values used for each of the boundaries and the mid-points, as well as indicating from where these values are derived. Some of these values are representative of a hypothetical scenario, where a previous worm outbreak has not indicated it has reached the potential boundary. The initially infected hosts hypothetical value is based on an order of magnitude larger than the highest observed initially infected value. Similarly the hypothetical proportion of susceptible hosts is based on a substantial number of hosts, 80%, of the total 232 hosts being susceptible.
Table 1. IWS Performance Evaluation Experimental Values
Low Medium High
Worm Packet Size (bytes) 404 S 1,059 W 4,096 C Initially Infected Hosts (number of hosts) 2 S 110 W 1,100 H Proportion of Susceptible Hosts (hosts per
million) 2 W 91 C 800,000 H
Code Red (C); Slammer (S); Witty (W); Hypothetical (H)
A matrix of all these values results in 27 simulations to be run for both the sequential and parallel implementation. In order to draw a statistical sample each simulation was executed five times using five different pseudo-random number generator seeds; resulting in 270 total simulations. Each simulation was run until 99% of the susceptible populous were infected, as by this time most of the susceptible hosts are infected and it may take a substantial amount of time to reach the remaining susceptible hosts due to the random propagation method. This provides a broad set of simulation results, in order to identify the impact of varying these parameters.
Buildings on these experiments two additional criteria have undergone experimentation. Firstly, using an additional 20 parallel simulations, the extent of threaded parallelisation has undergone experimentation in order to quantify its impact on the performance of IWS and how many threads should be employed; specifically on the testbed workstation. Secondly, using all 290 simulations, a comparison is undertaken between the time it takes for the simulator to complete its simulation against the predicted time to reach 99% infection with the given set of scenarios under both a sequential and parallel implementation.
All experiments have been carried out on a single workstation, with the same hardware and software configuration. This is in comparison to previous tests that have compared sequential simulations to parallel implementations that are distributed across a cluster of machines; for example with 1,536 cores [19]. The testbed workstation used an Intel Core i7 processor, 3.2GHz, with 64GB of DDR3 quad-channel RAM operating at 1600MHz. The i7 processor offers a total of 12 threads however, the parallel implementation was set to use 10 threads; allowing the two remaining threads to be available for the thread management functions and background processes, such as those run by the OS.
5.
Results
performance of IWS across four scenarios. The first three experiments investigate the change in PTS of IWS across a stratified range of: worm packet size, number of initially infected hosts at the point of an outbreak, and the proportion of susceptible hosts. The extent to which IWS can be parallelised is also investigated and a comparison between the speed of execution and projected time of a given worm to reach 99% infection is discussed. In addition to the empirical comparison, the trends that can be identified from each of these areas is presented and the likely underlying reasons for these trends discussed.
5.1.
Proportion of Susceptible Hosts
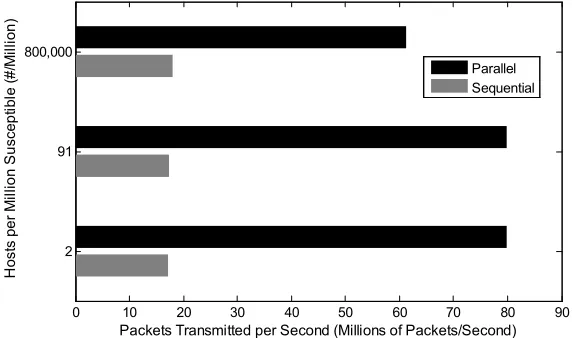
For a fixed number of hosts within any given network, as the proportion of susceptible hosts increase the number of potentially infectious hosts increase. Over the course of an outbreak, considering no other attributes have changed, this means an overall increase in the number of packets transmitted compared to a smaller proportion of susceptible hosts. Fig. 1 plots the performance of IWS in handling this workload. Whereas the sequential implementation reports a slight increase in its PTS with an increasing proportion of susceptible hosts; the parallel implementation shows a decrease.
The decrease in performance can be linked to the fact that only the infection attempts are carried out in parallel, whereas the increase in the proportion of susceptible hosts creates an increased workload for the entire simulation process, particularly the initialisation function block, resulting in the performance decrease measured. Whereas for the sequential implementation the increase in PTS can be attributed to a decrease in the number of simulated clock ticks as the proportion of susceptible hosts increases.
Fig. 1. Packets transmitted per second of IWS across a range of susceptible host proportions of an IPv4 address space.
5.2.
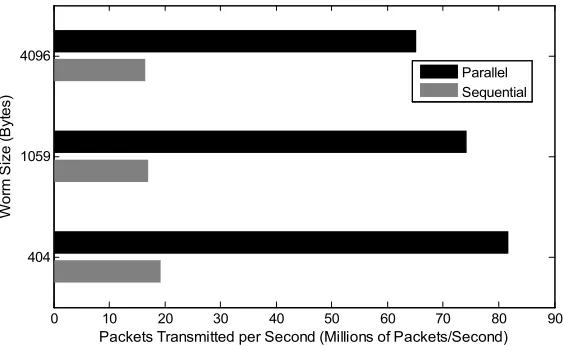
Worm Size
The larger the worm size the more bandwidth is used per worm instance therefore, given a finite bandwidth the number of infection attempts per unit time will decrease. A plot of the IWS performance against worm packet size is shown in Fig. 2. As the worm size decreases the PTS increases. Although the workload decreases as the worm size increases, the type of workload changes. This means that although there are fewer infection attempts being made per clock tick, there are a greater number of clock ticks. This is demonstrated by the greater decrease in PTS in the parallel implementation as the worm size increases, owing to the fact that the number of sequential operations being performed in the parallel implementation has increased. The increase in clock ticks also explains the decrease in PTS, as overall the number of operations increase.
0 10 20 30 40 50 60 70 80 90
2 91 800,000
Packets Transmitted per Second (Millions of Packets/Second)
H
o
s
ts
p
e
r
M
il
li
o
n
S
u
s
c
e
p
ti
b
le
(
#
/M
il
li
o
n
)
Fig. 2. Packets transmitted per second of IWS across a range of worm packet sizes.
5.3.
Initially Infected Hosts
Fig. 3 shows that as the number of initially infected hosts increases the simulator performance also increases. The increase in the performance of the parallel implementation is due to the decrease in the number of clock ticks being simulated owing to the greater number of scans at the start of the infection. There is a similar, but marginal, increase in the performance of the sequential implementation, which is also due to the reduced number of clock ticks.
Fig. 3. Packets transmitted per second of IWS across a range of initially infected hosts.
5.4.
Extent of Parallelisation
As expected the experimentation reported so far identifies that the parallel implementation provides better performance. The number of threads used within the parallel implementation was then examined. By fixing the parameters to the medium experimental values (see Table 1) the impact of using a different number of threads has been investigated.
Fig. 4 details the performance of IWS when using a different number of threads in the parallel implementation, from two up to 12 threads (the maximum the testbed workstation can logically execute in parallel). The performance of the test machine confirms to the findings of Hill and Marty [28], where the gain of greater parallelisation on multi-core processors has diminishing returns, however, there are two distinct anomalies; the decrease in performance observed between six and seven threads and the decrease observed between eleven and twelve threads.
0 10 20 30 40 50 60 70 80 90
404 1059 4096
Packets Transmitted per Second (Millions of Packets/Second)
W
o
rm
S
iz
e
(
B
y
te
s
)
Parallel Sequential
0 10 20 30 40 50 60 70 80 90
2 110 1100
Packets Transmitted per Second (Millions of Packets/Second)
In
it
ia
ll
y
I
n
fe
c
ts
H
o
s
ts
(
#
) Parallel
Fig. 4. Packets transmitted per second of IWS across a range of POSIX threads.
The first decrease could be explained by the architecture of the testing machine, where it has six real cores and twelve logical cores. The request of more threads than real cores is an explanation as to why IWS saw a decrease in simulation performance. In contrast the second decrease can be explained by the simulator requiring resources that are in contention, owing to the background processes governed by the operating system and the process that spawned the threads in the parallel implementation.
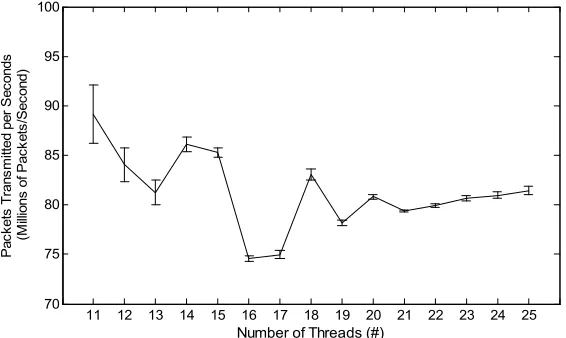
The POSIX API that used in IWS makes it is possible to request more threads than the hardware can logically execute in parallel. Fig. 5 extended Fig. 4 to show that this is not an effective strategy, as this performance does not surpass the peak achieved using 11 threads. This can be attributed to the hardware restrictions of the testbed workstation and the overheads involved in thread management owing to contention over resources.
Fig. 5. Packets transmitted per second of IWS across more POSIX threads than logical cores provided by an intel core i7 processor.
5.5.
Extent of Parallelisation
As Another key criterion that can be used to assess the performance of a simulator is to compare the wall-clock execution time of a simulation to the infection time being simulated. The comparison metric, , is
determined by dividing the execution time, , by the simulated time, , where = . This means that any
value less than 1 indicates that the simulator execution time is less than the simulated time.
2 3 4 5 6 7 8 9 10 11 12
30 40 50 60 70 80 90 100
Number of Threads (#)
P a c k e ts T ra n s m itt e d p e r S e c o n d (M ill io n s o f P a c k e ts /S e c o n d )
11 12 13 14 15 16 17 18 19 20 21 22 23 24 25 70 75 80 85 90 95 100
Number of Threads (#)
For the entire experimental set, sequential simulations had a median comparison metric, , of 16.9, whereas parallel simulations had a median comparison metric of 3.9. Of note is that the large susceptible populous simulations presented the worst comparison, with a peak comparison metric of 1,367.5 and 327.6 for the sequential and parallel simulations respectively.
The sequential implementation was able to execute in less than the simulated time in 22.2% of the experiments, whereas the parallel implementation was able to achieve the same in 37.4% of the experiments. This means that the parallel implementation of IWS would be a preferable choice if a single simulation was required.
5.6.
Summary
The parallel implementation of IWS is shown to be able to achieve up to 91.8 million PTS on a single multi-core processor, which compares favourably with previous metrics from Fujimoto et al. [19] which report up to 106 million PTS on a 1,536 processor cluster for a network 99.9% smaller. Similarly it is also able to simulate 22% of the scenarios faster than the simulated infection time
6.
Analysis
An aim of this the experimentation undertaken into quantifying the impact of key attributes on the resource requirements of IWS yields results that are consistent with Amdahl's law [29], which details that the maximum decrease of execution time of a program, , is directly related to the proportion of the program that is parallel, , and the number of processors, , as shown in (1). This means that the proportion of sequential operations that the program executes limits the increase in speed, which has been shown to be the case.
= (1)
Having introduced a parallel implementation to the function block that was being called the most in the design, an estimate of the parallel proportion can be derived. A modified Karp-Flatt metric [30] is presented in (2), which is designed to determine, based on the measured difference in execution times, , and number of processors, , an estimate of the proportion of a program that is executed in parallel, ; based on the Karp-Flatt metric, . As the decrease in wall-clock execution time was, on average, 56.5% when using an equivalent of ten processors this estimates the average proportion of the program that was executed in parallel as 62.8%. Amdahl's law suggests an increase in the parallel proportion in order to further decrease execution time however, this does not account for the overheads involved in doing so, which may lead to an increase in the sequential proportion as more parallelisation is included.
= 1 − = (2)
For a given task many simulations may be required. The authors propose (3), which presents a method to determine if a given task with two or more simulations should be carried out by a sequential or parallel implementation, and to what extent; where is the percentage decrease in wall-clock execution time with processes, and is the threshold. If is less than 1 then multiple discrete sequential implementations should be used, otherwise a parallel implementation with processors should be used in order to best utilise the resources available.
=
7.
Discussion
Across the selection of parameters tested under an empirical comparison of performance it is evident that a parallel implementation, on average, presents a reduced wall-clock execution time and an increased rate of packets transmitted per second (PTS).
Although it can be accepted that improving worm simulator performance aids in its applicability as a tool in worm analysis, the focus has often been to meet a reasonable execution time, as demonstrated by Wei et al. [24], or to reach a specific goal, such as in [19]. Other considerations could be a factor, for instance if a simulator is intended for use with hypothetical worm outbreak scenarios a consideration could be the number of scenarios that can be run. When there are resource constraints, in this case only a single workstation, the utilisation of those resources needs to be considered.
On the testbed workstation used in this paper a total of 64GB of RAM is available, which means although each simulation can run 56.5% faster on average when using ten threads in a parallel implementation, it can also run ten sequential simulations producing a greater volume of simulation results in the same time. This is at the cost of using ten times the amount of RAM usually employed and each sequential simulation is slower, but the number of hypothetical scenarios simulated in the same time frame is greater than if a parallel implementation is being used.
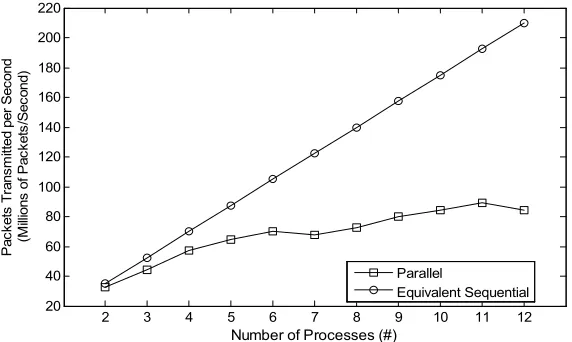
A comparison between the equivalent PTS of multiple sequential implementations running and a threaded implementation can be made, as shown in Fig. 6, demonstrating the linear increase resulting in a greater overall PTS across multiple simulations using a multi-process method. The linear trend results in up to 174.9 million PTS when running ten concurrent sequential simulations. Considering the nature of multi-core processors similar decreases in performance when requesting more processors than real cores or logical cores may occurr, however, this can be mitigated by introducing more real cores as each simulation is executed discretely.
Fig. 6. Comparison of packets transmitted per second of a single parallel simulation and equivalent multiple sequential simulations of IWS.
8.
Conclusion
Having undertaken an empirical comparison of both a sequential and parallel implementation of the Internet Worm Simulator (IWS) across a selection of varied parameters it is evident that a parallel implementation exhibits, on average, a 56.5% decrease in wall-clock execution time, and a 320.9% increase in the number of packets transmitted per second (PTS). The parallel implementation of IWS is shown to be able to achieve up to 91.8 million PTS on a single multi-core processor, which compared favourably against
2 3 4 5 6 7 8 9 10 11 12
20 40 60 80 100 120 140 160 180 200 220
Number of Processes (#)
previously reported metrics, especially of a network the size of which IWS is simulating.
As IWS is able to run simulations based both on previous worm analysis and hypothetical scenarios three key parameters have been assessed for performance: susceptible populous, worm size, and the number of hosts initially infected at the point of an outbreak. These all showed a significant impact on the parallel implementation, as well as having a variable impact on the sequential implementation. The extent of the impact was assessed using Amdahl's law [29] and a modified Karp-Flatt metric [30] that estimates only 64.28% of the parallel implementations execution is done in parallel, which provides an indication as to why although undertaking a parallel implementation on the function block that under profiling was being called 98.7% of the time, the sequential parts of the code still have a significant impact.
Given a workload of more than one simulation, a way to reach 100% parallelisation is to run multiple instances of a sequential implementation. This results in an equivalent of up to 192.4 million PTS at 11 concurrent simulations (the same number of processes as the highest performance of the parallel implementation). Given the use of a multi-core processor, this could result in requiring multiple processors to reach this maximum value owing to the difference in logical and real cores offered on the testbed.
8.1.
Future Work
The authors suggest extending the work reported by considering other methods of improving performance, such as distributed computing, or off-loading processing to dedicated hardware. Other performance improving methods are certainly avenues for future work, and it is intended that a similar empirical comparison and analysis will be undertaken when taking them into consideration.
References
[1] Ediger, B. (Sep. 2003). Simulating network worms — NWS network worm simulator. From http://www.stratigery.com/nws/
[2] Weaver, N., Paxson, V., Staniford, S., & Cunningham, R. (2003). A taxonomy of computer worms. Proceedings of the 2003 ACM Workshop on Rapid Malcode (pp. 11–18).
[3] Zou, C. C., Gong, W., & Towsley, D. (2002). Code red worm propagation modeling and analysis. Proceedings of the 9th ACM Conference on Computer and Communications Security (pp. 138–147). [4] Riley, G. (2003). The Georgia tech network simulator. Proceedings of ACM SIGCOMM Workshop on
Models, Methods and Tolls for Reproducible Network Research (pp. 5–12).
[5] Weaver, N. (Aug. 15, 2001). Warhol worms: The potential for very fast internet plagues. Retrieved November, 2014, form http://www.iwar.org.uk/comsec/resources/worms/warhol-worm.htm
[6] Zou, C., Gao, L., Gong, W., & Towlsey, D. (2002). Monitoring and early warning for internet worms. Proceedings of ACM CCS’2002.
[7] Chen, S., & Tang, Y. (2004). Slowing down internet worms. Proceedings of 24th International Conference on Distributed Computing Systems (pp. 312-319).
[8] Floyd, S., & Paxson, V. (2001). Difficulties in simulating the internet. IEEE/ACM Transactions on Networking, 9, 392–403.
[9] Staniford, S., Paxson, V., & Weaver, N. (2002). How to own the internet in your spare time. Proceedings
of11th USENIX Security Symposium: Vol. 8 (pp. 149–167).
[10]Moore, D., Paxson, V., Savage, S., Shannon, C., Staniford, S., & Weaver, N. (2003). The spread of the sapphire/slammer worm. IEEE Security and Privacy, 1(4), 33–39.
[11]Shin, S., & Gu, G. (2010). Conficker and beyond: A large-scale empirical study. Proceedings of the 26th Annual Computer Security Applications Conference (pp. 151–160).
[13]Lemos, R. (January 2003). Counting the cost of slammer. Retrieved November, 2014, form http://news.cnet.com/2100-1001-982955.html
[14]Whyte, D., Kranakis, E., & Oorschot, P. van (February 2005). DNS-based detection of scanning worms in an enterprise network. Proceedings of 12th Network and Distributed System Security Symposium (pp. 181-195).
[15]Wong, C., Bielski, S., Studer, A, & Wang, C. (2006). Empirical analysis of rate limiting mechanisms. Recent Advances in Intrusion Detection (pp. 22–42). Springer.
[16]Staniford, S., Moore, D., Paxson, V., & Weaver, N. (2004). The top speed of flash worms. Proceedings of the 2004 ACM Workshop on Rapid Malcode (pp. 33–42).
[17]Bajaj, L., Takai, M., Ahuja, R., Tang, K., Bagrodia, R., & Geria, M. (1999). GloMoSim: A scalable network simulation environment. UCLA Computer Science Department Technical Report.
[18]Riley, G., Fujimoto, R., & Ammar, M. (1999). A generic framework for parallelization of network simulations. Proceedings of Seventh International Symposium on Modeling, Analysis and Simulation of Computer and Telecommunication Systems (pp. 128–135).
[19]Fujimoto, R., Perumalla, K., Park, A., Wu, H., & Ammar, M. H. (2003). Large-scale network simulation: How big? How fast? Proceedings of 11th IEEE/ACM International Symposium on Modelling, Analysis and Simulation of Computer Telecommunications Systems (pp. 116–123).
[20]Tidy, L., Woodhead, S., & Wetherall, J. (2013). A large-scale zero-day worm simulator for cyber-epidemiological analysis. International Journal of Advances in Computer Networks and Its Security, 3(1), 69–73.
[21]Fall, K. (1999). Network emulation in the vint/ns simulator. Proceedings of IEEE International Symposium on Computers and Communications (pp. 244–250).
[22]Riley, G., Sharif, M., & Lee, W. (2006). Simulating internet worms. Proceedings of 12th IEEE/ACM International Symposium on MASCOTS (p. 268).
[23]SSF Research Network. (2002). Scalable Simulation Framework. From http://www.ssfnet.org/homePage.html
[24]Wei, S., Mirkovic, J., & Swany, M. (2005). Distributed worm simulation with a realistic internet model. Proceedings of 9th Workshop on Principles of Advanced and Distributed Simulation (pp. 71–79).
[25]Butenhof, D. (1997). Programming with POSIX Threads. Addison-Wesley Professional.
[26]Tidy, L., Woodhead, S., & Wetherall, J. (2013). Simulation of zero-day worm epedimiology in the dynamic heterogeneous internet. Journal of Defense Modeling and Simulation.
[27]Shannon, C., & Moore, D. (2004). The spread of the witty worm. Security & Privacy, 2(4), 46–50. [28]Hill, M. & Marty, M. (2008). Amdahl’s law in the multicore era. Computer, 41(7), 33–38.
[29]Amdahl, G. (1967). Validity of the single processor approach to achieving large scale computing capabilities. Proceedings of the Spring Joint Computer Conference (pp. 483–485).
[30]Karp, A., & Flatt, H. (1990). Measuring parallel processor performance. Communications of the ACM, 33(5), 539–543.
Steve Woodhead obtained his BSc honours degree in 1987 and his PhD degree in 1992, both in electronic engineering. He currently holds the position of reader in computer systems and networks at the University of Greenwich. He is also the director of the Internet Security Research Laboratory at the same University. Dr. Woodhead has published over 50 research papers in refereed journals and conferences.