Original Research Article
Morbidity profile and anthropometry among the elderly
in an urban slum in Mumbai
Jerome G. Thampi
1*, Rujuta Hadaye
2INTRODUCTION
For the first time in human history, most people can expect to live into their sixties and beyond. The number of people aged 60 years or older will rise from 900 million to 2 billion between 2015 and 2050 (rising from 12% to 22% of the total global population).1 Countries like India have 20 years to adapt to a change of proportion of the elderly in the population from 10% to 20%; a change which took place in a country like France over a period of 150 years.1 In India, the elderly constituted 7.4% of the total population in 2001. The proportion has been increasing consistently from 5.6% in 1961 to a projected 12.4% in 2026.2
But there is relatively little evidence that older people today are in better health than their parents. The most common causes of mortality and morbidity are heart
disease, diabetes mellitus, hypertension, stroke, chronic lung obstructive disease, sensory impairment, dementia, falls, osteo-arthritis and depressive disorders. In addition, the elderly face domestic abuse, financial dependence, and emotional isolation.
Most of the studies in the geriatric population in India have focused on the morbidity profile. Nikumb et al found a prevalence of multiple morbidities in 63.1% of the study participants; the most common morbidity being stress followed by musculoskeletal problems and eye diseases.3 Kakkar et al found a higher prevalence of morbidities in non-working and overweight study subjects as compared to working and normal-BMI people respectively.4 Mehta et al found that the mean anthropometric measurements were higher in elderly men and women from the medium- and high- income groups compared to low-income groups.5 Tsai et al concluded
ABSTRACT
Background: Geriatric health is gaining in urgency and importance as the world is moving into the later stages of the demographic cycle. Nutritional status of the elderly is a major determinant of their overall health.
Methods: The present study is a healthcare facility-based, cross-sectional study among geriatric patients attending the chronic disease clinic focusing on the morbidity profile and anthropometry. Sample size was 89. The measurements done were calf circumference (CC), mid-upper arm circumference (MUAC) and BMI.
Results: More than half the study subjects had three or more chronic morbidities. The prevalence of undernourishment based on calf circumference and MUAC were 11.2% and 12.4% respectively. The correlation between BMI, CC and MUAC were all found to be strong and statistically significant.
Conclusions: Both CC and MUAC can be adapted for use in primary care settings to rapidly assess nutritional status of the elderly and plan management protocols.
Keywords: Geriatric, Anthropometry, Calf, Mid-upper arm, Body mass index
Department of Community Medicine, 1Sri Venkateshwaraa Medical College and Research Center, Puducherry, Tamil Nadu, India, 2Seth G.S. Medical College and K.E.M. Hospital, Mumbai, Maharashtra, India
Received: 16 July 2019
Accepted: 30 August 2019
*Correspondence:
Dr. Jerome G. Thampi,
E-mail: [email protected]
Copyright: © the author(s), publisher and licensee Medip Academy. This is an open-access article distributed under the terms of the Creative Commons Attribution Non-Commercial License, which permits unrestricted non-commercial use, distribution, and reproduction in any medium, provided the original work is properly cited.
that calf circumference and mid—arm circumference should be given more importance in designing geriatric health and nutritional assessment scales.6
The present study was conducted in a slum area in Mumbai with the aim to characterise the elderly population in the urban field practice area of the affiliated institution.
Objectives
The objective of this study is to assess the morbidity profile and personal habits of the geriatric patients and to measure the anthropometric parameters of the geriatric patients.
METHODS
The present study was a cross sectional study. The study population was geriatric patients living in an urban slum in the metropolitan city of Mumbai. Patients aged 60 years and above, attending the chronic disease outpatient clinic in the urban health training centre over a three month period between January and March of 2017 were selected for participation in the study. Exclusion criterion was having any spinal or posture deformities. The sample size was calculated based on 5% alpha error, 10% absolute precision and 95% confidence intervals. Based on a previous study, 63.1% of the geriatric patients have multiple morbidities.3 Taking that into account, the sample size was estimated to be 89 using Open Epi.
The health centre has a twice-weekly chronic disease out-patient clinic. The clinic serves primarily a geriatric population. It caters to around 35 geriatric patients per day for two days (Wednesday and Thursday) every week. On the days of the geriatric clinic, every third patient was recruited using a random approach into the study for an average of 10 patients per day. This was continued till the required sample was studied. The study procedure was explained to the study participants by the investigator in the local languages (Marathi or Hindi). Informed written consent in the local language was obtained from the study participants. A pre-tested, semi-structured questionnaire was administered by the investigator in the local language. The questionnaire contained variables such as age, gender, education, occupation, income, medical history and habitual history. Anthropometric data such as height, weight, mid-upper arm circumference and calf circumference were measured by the interviewer.
The data was entered in MS Excel and analysed using R version 3.5.3. Numerical variables were summarized using means with standard deviations or medians with interquartile ranges wherever applicable. Categorical variables were summarized using proportions or percentages. The data was presented using tables and figures. Independent samples t-test and ANOVA was used test significance of numerical variables. Chi square test was used to test categorical variables. The results
were presented with 95% confidence intervals. p value of less than 0.05 was taken to be statistically significant.
RESULTS
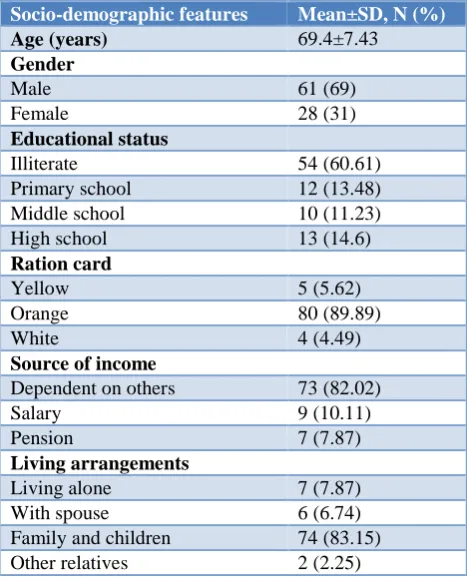
The socio-demographic profile of the study participants is summarized in Table 1.
Table 1: Socio-demographic profile.
Socio-demographic features Mean±SD, N (%)
Age (years) 69.4±7.43
Gender
Male 61 (69)
Female 28 (31)
Educational status
Illiterate 54 (60.61)
Primary school 12 (13.48)
Middle school 10 (11.23)
High school 13 (14.6)
Ration card
Yellow 5 (5.62)
Orange 80 (89.89)
White 4 (4.49)
Source of income
Dependent on others 73 (82.02)
Salary 9 (10.11)
Pension 7 (7.87)
Living arrangements
Living alone 7 (7.87)
With spouse 6 (6.74)
Family and children 74 (83.15)
Other relatives 2 (2.25)
Table 2: Habitual history of the study population.
Habitual history N (%)
Smoking
Non-smokers 80 (89.89)
Current smokers 5 (5.62)
Quit smoking 4 (4.49)
Tobacco chewing 37 (41.57)
Alcohol consumption 7 (7.87)
Diet
Mixed diet 91.01
Vegetarian diet 8.99
Physical activity
Sedentary 41 (46.07)
Adequate activity 48 (53.93)
Figure 1:Co-morbidities in geriatric population. Figure 1:Correlations between anthropometric measurements.
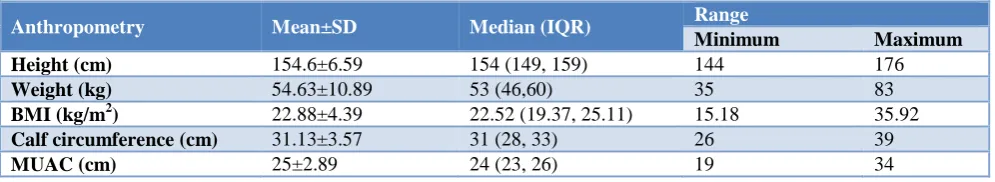
Table 3: Anthropometry of the geriatric population.
Anthropometry Mean±SD Median (IQR) Range
Minimum Maximum
Height (cm) 154.6±6.59 154 (149, 159) 144 176
Weight (kg) 54.63±10.89 53 (46,60) 35 83
BMI (kg/m2) 22.88±4.39 22.52 (19.37, 25.11) 15.18 35.92
Calf circumference (cm) 31.13±3.57 31 (28, 33) 26 39
MUAC (cm) 25±2.89 24 (23, 26) 19 34
It was found that more than half (54%) of the study population had three or more co-morbidities. The median number of co-morbidities among the geriatric population included in the study was 4 and it ranged from 2 to 6. This indicates the high burden of multiple co-morbidities and the need for management among the geriatric population. Hypertension, diabetes and musculo-skeletal co-morbidities were the most frequently reported. Around 38.2% of the study population had both diabetes as well as hypertension. Among the study population, 59.6% had either diabetes or hypertension. The various co-morbidities among the study population are summarized in Figure 1.
The anthropometry of the study population is summarized in Table 3.
With regards to anthropometry, when BMI of 23 kg/m2 was used as cut-off, 53.9% were classified to be underweight. The prevalence of underweight among men and women were 15.1% and 32.9% respectively. The overall prevalence of undernourished according to calf circumference and MUAC were 11.2% and 12.4% respectively. Calf circumference cut-off was set at 30 cm for males and 27 cm for females. According to calf-circumference measurements, 21.4% of the males and 6.6% of the females were found to be undernourished. The mid-upper arm circumference cut off values for males and females were 23.5 cm and 22 cm respectively. According to MUAC cut-offs, 32.1% of males and 3.3% of females were found to be undernourished. The various anthropometric measures are correlated under Figure 2.
BMI and CC were significantly correlated R=0.75 (95% CI: 0.647 to 0.831). This correlation is found to be strong.
Similarly, BMI and MUAC were significantly correlated R=0.76 (95% C.I: 0.659 to 0.837), which was also strong.
The correlation between BMI and calf circumference in males was not significant, with a correlation coefficient of 0.56. In females, this correlation was stronger with a coefficient of 0.83 and found to be statistically significant. On comparing BMI and mid-upper arm circumference in males, the correlation was significant and stronger with a correlation coefficient of 0.72. This relationship was even stronger among females with a coefficient of 0.82. The agreement between calf circumference and mid-upper arm circumference in males was strong and significant with a correlation coefficient of 0.80. Among females, the agreement was extremely strong with a coefficient of 0.95.
DISCUSSION
The population presently under study was composed largely of illiterate, financially dependent adults with mostly a mixed diet and adequate physical activity.
The proportion of underweight in the present study based on standards of the body mass index (BMI) was around 54%. Compared to studies such as Kalaiselvi et al and Shanbhag et al, this proportion is quite high.9,10 This is due to the use of a higher BMI cut-off of less than 23 kg/m2 in the present study compared to the less than 18.5 kg/m2 cut-off used elsewhere. The higher cut-off for BMI has been advocated by studies11 which show that survival over time among the elderly will improve with increase in weight.
The proportion of undernourished subjects based on measurements of MUAC was 32% in males and 3.3% in females. Shanbhag et al found these proportions to be around 4% and 12% respectively.10 Similarly, based on calf circumference measurements, the present study found 21.4% of males to be undernourished along with 6.6% of the females. This proportion was around 40% and 18% as per Shanbhag et al.10 Standardization of guidelines with multi-centric, large-sample studies to straighten out the discrepancies may be indicated.
Compared to Manandhar et al, the participants in the present study had a higher mid-upper arm and calf circumferences.12 The coefficients of correlation between calf and mid-upper arm circumference in the present study were 0.80 and 0.95 respectively in males and females. Similar strong and significant correlation (0.83 in males and 0.88 in females) were observed by Manandhar et al.12
The high correlation between BMI and calf circumference or mid-upper arm circumference strongly suggests that these anthropometric parameters can be used for quick assessment of the nutritional status of the elderly. This facilitates ease of use for the physician as well as risk-free measurement for patients. In a primary-care setting, CC/MUAC may be incorporated into routine assessment. Preferably the calf circumference may not be used in males as it is not significantly correlated with BMI in males. In both the sexes, the mid-upper arm circumference demonstrates strong, significant association with BMI and thus may be used as the measurement of choice. Therefore, it is recommended that mid-upper arm circumference can reliably be used as the single parameter in both the sexes for assessing the nutritional status. Similar to the use of mid-upper arm circumference for assessing the nutritional status of children under the age of 5 years, mid-upper circumference stays relatively stable in adults above the age of 60 years, as was noticed in this study.
CONCLUSION
The findings of the study indicate that simpler parameters such as CC and MUAC can be used to evaluate the anthropometric and nutritional status of elderly persons. This can be quickly done in the primary healthcare facilities by the healthcare professional as part of the comprehensive geriatric assessment. As the primary
health centre is being converted into Health and Wellness Centre, such simplification of procedures may be crucial in expediting the process.
Limitation
More studies should be conducted to study this relationship as the present study has a relatively small sample size and was not a community-based study.
Funding: No funding sources Conflict of interest: None declared
Ethical approval: The study was approved by the Institutional Ethics Committee
REFERENCES
1. WHO|10 facts on ageing and the life course. Available at: https://www.who.int/features/ factfiles/ageing/ageing_facts/en/. Accessed on 1 July 2019.
2. Situational Analysis of the Elderly in India. Available at: http://mospi.nic.in/sites/default /files/publication_reports/elderly_in_india.pdf. Accessed on 1 July 2019.
3. Bhawalkar JS, Dhone AB, Jethani S, Singru S, Jadhav SL, Adanthaya S. A study of morbidity profile among geriatric population in an urban area. J Evol Med Dental Sci. 2013;2(36):6963-7.
4. Kakkar R, Aggarwal P, Kandpal SD, Bansal S. An Epidemiological study to assess morbidity profile among geriatric population in District Dehradun. Indian J Community Health. 2013;25:39–44. 5. Mehta P, Shringarpure B. Diet nutrition and health
profile of elderly population of urban Baroda. Indian J Public Health. 2000;44(4):124–8.
6. Tsai AC-H, Ho C-S, Chang M-C. Population-specific anthropometric cut-points improve the functionality of the Mini Nutritional Assessment (MNA) in elderly Taiwanese. Asia Pac J Clin Nutr. 2007;16(4):656–62.
7. Khanam MA, Streatfield PK, Kabir ZN, Qiu C, Cornelius C, Wahlin Å. Prevalence and patterns of multimorbidity among elderly people in rural Bangladesh: a cross-sectional study. J Health Popul Nutr. 2011;29(4):406–14.
8. Thakur R, Banerjee A, Nikumb V. Health problems among the elderly: a cross-sectional study. Ann Med Health Sci Res. 2013;3(1):19–25.
9. Kalaiselvi S, Arjumand Y, Jayalakshmy R, Gomathi R, Pruthu T, Palanivel C. Prevalence of under-nutrition, associated factors and perceived nutritional status among elderly in a rural area of Puducherry, South India. Arch Gerontol Geriatr. 2016;65:156-60.
11. Cetin DC, Nasr G. Obesity in the elderly: more complicated than you think. Cleve Clin J Med. 2014;81(1):51-61.
12. Manandhar MC, Anklesaria PS, Ismail SJ. Weight, skinfolds and circumference characteristics of poor elderly people in Mumbai, India. Asia Pac J Clin Nutr. 1997;6(3):191-9.