© 2017 IJSRSET | Volume 3 | Issue 6 | Print ISSN: 2395-1990 | Online ISSN : 2394-4099 Themed Section: Engineering and Technology
Evaluation and Validation of Computed Tomography Dose
Accuracy
(CTDI
wAND CTDI
vol)
Abrokwa Sintim
1,
Edem Sosu
1,2, Francis Hasford
1,2, Augustine Kyere
1*1Department of Medical Physics, School of Nuclear and Allied Sciences, University of Ghana, Accra, Ghana
2
Medical Radiation Physics Centre, Radiological and Medical Sciences Research Institute, Ghana Atomic Energy Commission, Accra, Ghana
ABSTRACT
Weighted and average dose within a scan volume of a phantom have been evaluated and validated using two different devices and techniques. The Barracuda electrometer and Ion Chamber techniques were applied on a 16 slice Siemens CT scanner and the results compared to the console displayed CTDIw and CTDIvol values for accuracy
and compared to each other for validation purposes. With fixed exposure parameter of 130kVp and varying tube current-time products from 140mAs to 300mAs for the CT head phantom examination, there were varying deviations in both the CTDIw and CTDIvol from the two techniques. Tube currents of 140 mAs, 240 mAs and 300
mAs yielded 3.5%, 0.61% and -6.45% deviations when the respective CTDIvol values for both techniques were
compared. There were mean CTDIvol of (42.3 + 8.6) mGy and (42.1 + 8.1) mGy for Barracuda and Ion Chamber
techniques respectively with an average deviation of 1.4 mGy between them, when the tube current-time products were varied from 140 – 300 mAs for the head phantom examination. Tube current-time products ranging from 80mAs – 220mAs were used for the CT body phantom examination and mean CTDIw measured were (16.6 + 6.7)
mGy and (16.5 + 7.7) mGy for Barracuda and Ion Chamber techniques respectively with an average deviation of 1.0 mGy between them. The results of the study showed that the deviations from the techniques were within a range of CTDIw and CTDIvol values which were favorably comparable to other similar retrospective research works, thus, the
Ion Chamber technique can be used in place of the technique currently in use.
Keywords: Computed Tomography Dose Index (CTDI), Exposure (X), Dose Profiler Probe, Temperature and Pressure Correction Factor (PTP)
I.
INTRODUCTION
Computed tomography (CT) also known as computed axial tomography (CAT) was invented and introduced into clinical use in the 1970s. By then, it was considered as the most advanced machine since the development of x-ray machine [1]. CT procedures consist of exposures from multiple rotation of the radiation source and the total dose to the irradiated volume is the accumulated dose from the adjacent scans [2]. Multiple scan average dose (MSAD) is one name used for the accumulated dose; it is the dose from a multiple scan examination that is averaged over a single scan interval in the central
portion of the multiple-scan dose profile [2]. Thermoluminescent dosimeters (TLDs) or film are used in measuring MSAD but both require considerable time for the measurement due mainly to the difficulty in calibration, reading and handling.
CTDI can be measured using a 100-mm long pencil ionizatIon chamber and denoted CTDI100 [5]. The
ionization chamber is placed in the CT head and body phantom and the CTDI is measured in the axial scan mode for an individual rotation of the x-ray source. Measurements of dose are taken at the center and at the periphery of the phantom and combined using a weighted average (CTDIw) to give a single estimate of
the radiation dose to the phantom. CTDIvol represents
radiation output from the CT scanner to the phantom; CTDIvol measured in the CT head phantom is a reference
to head CT and pediatric body CT in some cases and CTDIvol measured in CT body phantom is used as a
reference to adult CT in the body (chest, abdomen and pelvis) and can as well serves as a reference to the pediatric body CT [6].
In the event when a screen-film is exposed to too much radiation, there is a visual indication of excessive patient dose on the film. Unlike screen-film, CT images never look overexposed, as the modality provides image of normalized tissue attenuation values with often better image if excessive radiation is used. In computed and digital radiography which has a similar case to CT, overexposure will reduce image noise and mostly happen without the awareness of the operator, as radiologists do not often care about image noise being too low [2]. Hence, without dose measurements, the CT operator or user lacks the visual indications that are required to correctly adjust the tube potential or tube current-time product in avoidance of excessive patient dose.
Currently in Ghana, the available means of measuring the CT dose is by the use of Barracuda connected with Ocean Software which automatically estimate the CTDI values when the specified tube potential and tube current-time product are entered in the system. The Barracuda technique has been in use for quite some time in Ghana now.
With the acquisition of a new PTW Ion Chamber and electrometer by Ghana Atomic Energy Commission (GAEC), there is the need to therefore assess and validate the CTDI values obtained from the Barracuda equipment. The new equipment obtained by GAEC records charges during CT procedure and with the use of formalisms from the American Association of Physicists (AAPM) in Medicine Report 96 in 2008, the charges can
be converted to exposure and subsequently to dose in air. This validation is needed to give an indication of whether or not the CTDI values obtained from the Barracuda and the new technique falls within the acceptable ranges and whether or not either one can be used in the absence of the other. To our knowledge in Ghana, there has not been any study to validate the CTDI values obtained by using the Barracuda equipment due mainly to lack of alternative device and technique. It is therefore pertinent to assess and validate CTDI values by using these two different techniques.
II.
METHODS AND MATERIAL
The materials that were used for this research work included;
16 slice Siemens CT scanner (Siemens Somatom Emotion, Forchheim, Germany)
Standard CT dosimetry PMMA cylindrical acrylic head and body phantoms (PTW, Freighburg, Germany)
100-mm pencil Ion Chamber with integrated electrometer (PTW Freighburg, Germany)
CT Dose Profiler Probe (RTI Electronics, Sweden)
Barracuda with Ocean Software interface (RTI Electronics, Sweden)
The study begun by setting up the CT head phantom on the CT couch. The head phantom was positioned at the isocenter of the CT scanner and the long axis of the head phantom was aligned with the z-axis of the scanner.
Dose Measurement with the PTW Ion Chamber
The PTW Pencil Ion Chamber connected to an electrometer with a cable was placed in the central hole of the head phantom. Two horizontal lasers in the CT room were adjusted to be visible on the mid-line of the Ion Chamber and a vertical laser was also set to be visible at the middle of the phantom. This was done to properly align the phantom and the chamber on the couch.
required volume was selected. Parameters such as tube potential, tube current and slice thickness were selected whiles other parameters were kept constant for the examination. A tube potential of 130kVp, tube current-time product of 240mA, pitch of 0.55 and slice thickness of 4mm were selected for the first scan. Measurements were taken at the periphery sites of 12 –, 3 –, 6 – and 9 – O’clock as well which can also be represented as P1, P2, P3 and P4 respectively. The procedure was repeated with different values of tube current-time product but with all other parameters constant. Tube currents of 220mA, 240mA, 260mA and 280mA were used in the procedure for the CT head phantom scan. Different values were chosen to provide range of data that can be analyzed to check the validity of the dose measuring techniques. Parameters used for the examination can be found in Table 1.
Table 1: Scan Parameters used for the CT examination
Examination KVp mAs Slice Thickness
(mm)
Pitch
Head 130 120 4 0.55
Body 130 80 5 0.8
Head 130 140 4 0.55
Body 130 100 5 0.8
Head 130 160 4 0.5
Body 130 120 5 0.8
Head 130 180 4 0.55
Body 130 140 5 0.8
Head 130 200 4 0.55
Body 130 160 5 0.8
Head 130 220 4 0.55
Body 130 180 5 0.8
Head 130 240 4 0.55
Body 130 200 5 0.8
Head 130 260 4 0.55
Body 130 210 5 0.8
Head 130 280 4 0.55
Body 130 220 5 0.8
Head 130 300 4 0.55
After the head phantom measurements were done, the procedure was repeated for the CT body phantom. Charges were measured and recorded in each scan. The charges measured and recorded from the electrometer were used to estimate CTDI values in the study with the use of integral and other mathematical equations.
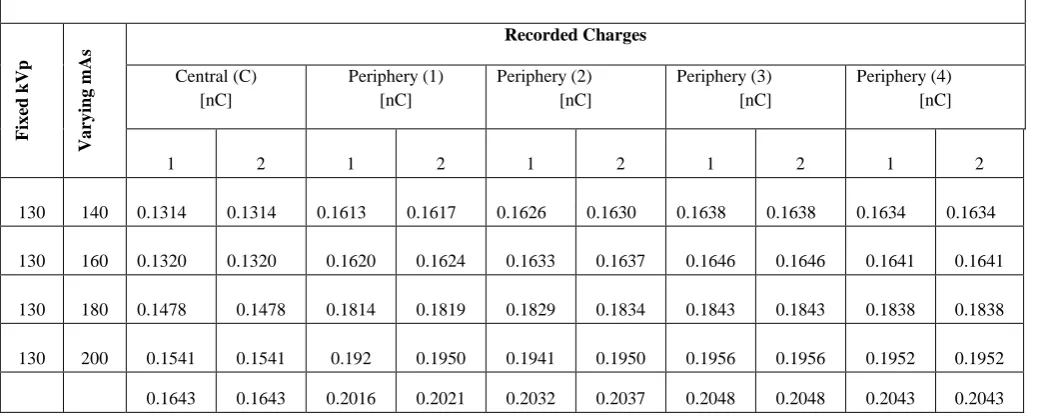
The electrometer readings were taken in charge mode and corrected for temperature and pressure. Equation [1] was needed for temperature and pressure correction, but the temperature of 25 degree-celcius and 100.56 mmHg recorded in the experimental room was within a range specified by the Ion Chamber manufacturer where there was no need for temperature and pressure correction. The charges recorded from the electrometer has been shown in Tables 2 and 3.
P
T
P
TP*
101
.
33
22
2
.
273
2
.
273
Where,
T – Temperature measured in the study room P – Pressure in the room
PTP – correction for pressure and temperature
Table 2: Charges recorded during the PTW Ion Chamber Technique
Charges recorded for CT head phantom examination from PTW electrometer
Fi
x
ed
k
Vp
Va
ry
in
g
m
As
Recorded Charges
Central (C) [nC]
Periphery (1) [nC]
Periphery (2) [nC]
Periphery (3) [nC]
Periphery (4) [nC]
1 2 1 2 1 2 1 2 1 2
130 140 0.1314 0.1314 0.1613 0.1617 0.1626 0.1630 0.1638 0.1638 0.1634 0.1634 130 160 0.1320 0.1320 0.1620 0.1624 0.1633 0.1637 0.1646 0.1646 0.1641 0.1641 130 180 0.1478 0.1478 0.1814 0.1819 0.1829 0.1834 0.1843 0.1843 0.1838 0.1838 130 200 0.1541 0.1541 0.192 0.1950 0.1941 0.1950 0.1956 0.1956 0.1952 0.1952 0.1643 0.1643 0.2016 0.2021 0.2032 0.2037 0.2048 0.2048 0.2043 0.2043
130 220
130 240 0.1807 0.1807 0.2218 0.2223 0.2235 0.2241 0.2253 0.2253 0.2247 0.2247 130 260 0.1971 0.1971 0.2419 0.2426 0.2438 0.2445 0.2458 0.2458 0.2451 0.2451 130 280 0.2135 0.2135 0.2621 0.2628 0.2642 0.2649 0.2662 0.2662 0.2655 0.2655 130 300
0.2300 0.2300 0.2822 0.2830 0.2845 0.2852 0.2867 0.2867 0.2860 0.2860
Table 3: Charges recorded during the PTW Ion Chamber Technique
The charges were converted into Exposure (rad) using equation (2). CTDI100, CTDIw and CTDIvol were then
estimated using equations [3], [4] and [5] respectively from AAPM Report 96.
) / ( ) ( 10 58 . 2
1 )
/ ( )
( 4 R f rad R
m Q kg C m
Q rad
X med
air air
) (
) ( )
(
100
mm T N
mm L C rad X
CTDI f
periphery centre
w
CTDI
CTDI
CTDI
100 1003
2
3
1
f w vol
p CTDI
CTDI
where,
Q represents charges recorded in coulombs
fmed represents [exposure to dose conversion factor] =
0.78 rad/R,
Cf represents [Electrometer/Ion Chamber calibration
factor] = 1
L represents [Ion Chamber length] = 100 mm, T = width of one slice or tomographic selection,
N represents [number of slices or tomographic sections imaged in a single axial scan] = 16,
X represents [Estimated exposure] = Q/m
Charges recorded for CT body phantom examination from PTW electrometer
Fi
x
ed
k
Vp
Va
ry
in
g
m
As
Ex
a
m
in
a
tio
n Recorded Charges
Central (C) [nC]
Periphery (1) [nC]
Periphery (2) [nC]
Periphery (3) [nC]
Periphery (4) [nC]
1 2 1 2 1 2 1 2 1 2
130 80 A 0.0665 0.0670 0.0885 0.0880 0.0885 0.0885 0.0875 0.0875 0.0880 0.0880 130 100 A 0.0899 0.0899 0.0940 0.0938 0.0942 0.0942 0.0944 0.0946 0.0938 0.0938 130 120 A 0.1079 0.1079 0.1128 0.1126 0.1130 0.1130 0.1133 0.1135 0.1126 0.1126 130 140 A 0.1271 0.1271 0.1328 0.1327 0.1330 0.1328 0.1329 0.1329 0.1331 0.1330 130 160 C 0.1500 0.1500 0.1860 0.1862 0.1862 0.1859 0.1859 0.1865 0.1860 0.1861 130 180 C 0.1688 0.1688 0.2093 0.2095 0.2095 0.2091 0.2091 0.2098 0.2093 0.2094 130 200 C 0.1875 0.1875 0.2325 0.2328 0.2328 0.2324 0.2324 0.2331 0.2325 0.2326 130 210 P 0.2410 0.2410 0.3150 0.3152 0.3150 0.3152 0.3148 0.3148 0.3154 0.3152 130 220 P 0.2560 0.2560 0.3300 0.3300 0.3310 0.3311 0.3310 0.3312 0.3315 0.3315
(2)
(3)
(4)
Pf = Pitch factor used
mair represents [mass of air irradiated] = ρair ×vair
ρair represents [density of air at standard temperature and
pressure] = 1.293 kg/m3
vair represents [vol. of irradiated air for single slice] =
(slice thickness/100 mm) × vc
vc represents [vol. of Ion Chamber] = 3.14 cm 3
= 3.14 × 10⁻⁶ m3
Dose Measurements with the RTI Dose Profiler Probe and Barracuda
A CT Dose Profiler Probe was connected to a Barracuda with an extension cable and the Barracuda was subsequently connected to a computer which had the Ocean Software interface. The Dose Profiler probe was placed in the middle hole of the CT head phantom. The horizontal and vertical lasers were used for proper alignment just like in the set-up with the Ion Chamber. The cable was tapped to prevent dislodging of the probe from the phantom in this set up too.
The same procedure and parameters as used for the dose measurements with the Ion Chamber were used for the dose measurements with the dose profiler. After taken measurements for the head phantom, the procedure was repeated for body phantom measurements as well. The Dose-Length Products, Computed Tomography Dose Index weighted (CTDIw) and volume Computed
Tomography Dose Index (CTDIvol) were automatically
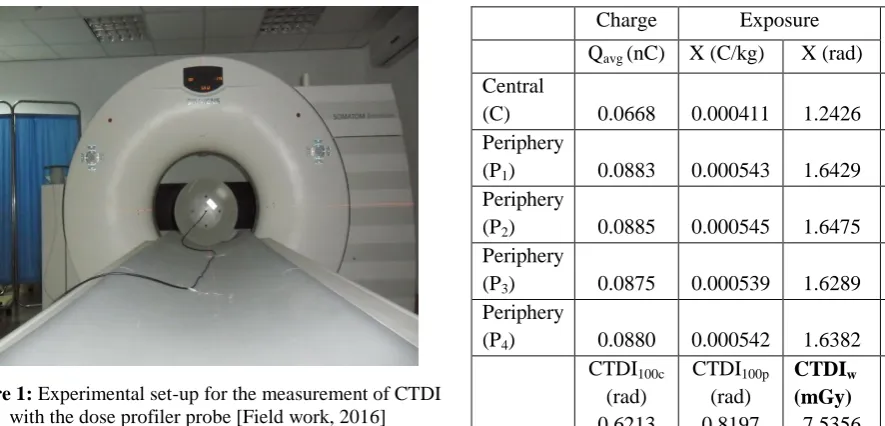
generated by the Barracuda in each scan. The experimental set-up of the dose measurements with the dose profiler probe has been shown with Figure 1
Figure 1: Experimental set-up for the measurement of CTDI with the dose profiler probe [Field work, 2016]
III.
RESULTS AND DISCUSSION
A. Measurement of CTDI with the Ion Chamber Technique
Some of the charges recorded during the acrylic CT head and body PMMA phantom examination with the use of the Ion Chamber in the study and their subsequent calculated exposure, CTDIw and CTDIvol values using
mathematical expressions has been shown in 4 and 5 below.
Table 4: CTDI values for head phantom at 130kVp and 140mAs
Table 5: CTDI values for body phantom at 130kVp and 80mAs (Abdomen scan)
Charge Exposure
CTDI100
Qavg (nC) X (C/kg) X (rad)
Central
(C) 0.0668 0.000411 1.2426 0.6213
Periphery
(P1) 0.0883 0.000543 1.6429 0.8214
Periphery
(P2) 0.0885 0.000545 1.6475 0.8238
Periphery
(P3) 0.0875 0.000539 1.6289 0.8145
Periphery
(P4) 0.0880 0.000542 1.6382 0.8191
CTDI100c
(rad) 0.6213
CTDI100p
(rad) 0.8197
CTDIw (mGy) 7.5356
CTDIvol (mGy)
9.4196
Charge Exposure
CTDI100
Qavg (nC) X (C/kg) X (rad)
Central
(C) 0.1314 0.000809 2.4464 1.5290 Periphery
(P1) 0.1615 0.000994 3.0064 1.8790
Periphery
(P2) 0.1628 0.001002 3.0302 1.8939
Periphery
(P3) 0.1638 0.001009 3.0501 1.9063
Periphery
(P4) 0.1634 0.001006 3.0421 1.9013
CTDI100c
(rad) 1.5290
CTDI100p
(rad) 1.8951
CTDIw (mGy)
17.7308
CTDIvol (mGy)
B. Measurements of CTDI with CT Dose Profiler Probe and Barracuda Technique
The CTDI values obtained from the Barracuda technique for the radiation dose measurement for the CT head and body phantoms can be found in Tables 6 and 7 respectively.
Table 6: CTDI values for head phantom at 130kVp and varying mAs
kVp mAs CTDIw (mGy)
CTDIvol (mGy)
130 140 17.60 32.9
130 160 18.50 33.4 130 180 18.95 34.5
130 200 20.44 37.2
130 220 22.53 41.0 130 240 24.55 44.6 130 260 26.40 50.7
130 280 27.86 51.4
130 300 29.12 53.0
Table 7: CTDI values for body phantom at 130kVp and varying mAs
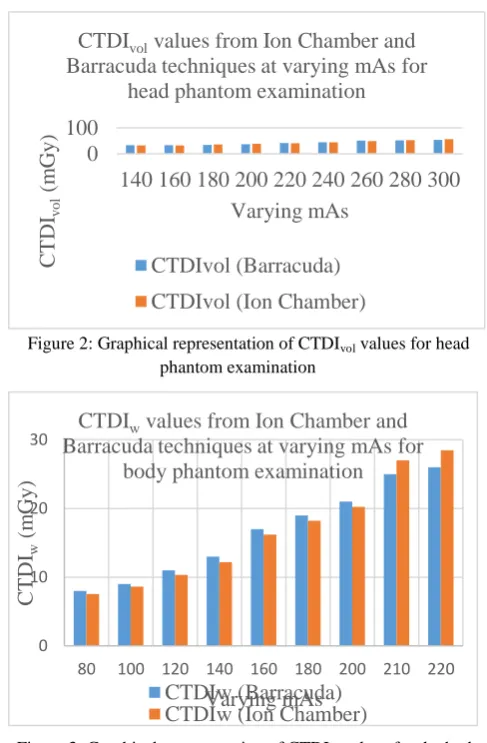
C. Representation of CTDI values from both Techniques
The CTDIvol and CTDIw values obtained from both
techniques have been presented in Figures 2 and 3 for the head and body phantoms examinations.
Figure 2: Graphical representation of CTDIvol values for head
phantom examination
Figure 3: Graphical representation of CTDIw values for the body
phantom examination
Table 8 has been used to present the percentage deviations of the CTDI values measured from the Ion Chamber technique to that measured from the Barracuda technique for the head phantom examination.
Table 8: Deviations of CTDI values for head phantom at 130kVp and varying mAs Varying
mAs
Barracuda CTDIw (mGy)
Ion Chamber CTDIw (mGy)
Barracuda CTDIvol (mGy)
Ion Chamber CTDIvol
(mGy)
% Deviation
(CTDIw)
% Deviation (CTDIvol)
140 17.60 17.73 32.90 32.24 4.16 3.50
160 18.5 17.81 33.40 32.38 -1.19 1.58
180 18.95 19.95 34.50 36.27 -5.26 -5.12
200 20.44 21.08 37.20 38.33 -3.13 -3.03
220 22.53 22.16 41.00 40.30 1.63 1.71
240 24.55 24.38 44.60 44.33 0.69 0.61
260 26.4 26.60 50.70 48.36 -0.74 4.62
280 27.86 28.81 51.40 52.39 -3.42 -1.92
0 100
140 160 180 200 220 240 260 280 300
C
T
D
Ivol
(
m
G
y
)
Varying mAs
CTDIvol values from Ion Chamber and Barracuda techniques at varying mAs for
head phantom examination
CTDIvol (Barracuda)
CTDIvol (Ion Chamber)
0 10 20 30
80 100 120 140 160 180 200 210 220
C
T
D
Iw
(
m
G
y
)
Varying mAs
CTDIw values from Ion Chamber and Barracuda techniques at varying mAs for
body phantom examination
CTDIw (Barracuda) CTDIw (Ion Chamber)
kVp mAs Examination CTDIw
(mGy)
CTDIvol
(mGy)
130 80 Abdomen 8 9.5
130 100 Abdomen 9 11.2
130 120 Abdomen 11 13.5
130 140 Abdomen 13 15.6
130 160 Chest 17 19.0
130 180 Chest 19 21.4
130 200 Chest 21 23.8
130 210 Pelvis 25 37.0
300 29.12 31.03 53.00 56.42 -6.56 -6.45
StDev. 4.3 4.8 8.1 8.6
In analyzing the results for the CT head phantom examination, the minimum CTDIvol deviation recorded
between the two measurement devices and techniques was 0.61% when the scan protocol was set at fixed exposure parameter of 130kVp and tube current-time product of 240mAs. The maximum CTDIvol deviation
was also measured at -6.45% when the scan protocol for the CT head examination was set at a fixed exposure parameter and tube current-time product of 130kVp and 300mAs respectively. When the tube current-time products were varied between 140mAs to 300mAs, there were mean CTDIvol of (42.3 + 8.6) mGy and (42.1
+ 8.1) mGy for Barracuda and Ion Chamber techniques respectively with a mean deviation of 1.4 mGy between them.
In reference to the CTDIw for the CT head examination,
there was a minimum CTDIw deviation of 0.69% at
exposure parameter of 130kVp and tube current-time product of 240mAs between the two techniques. The maximum CTDIw deviation was also estimated at -6.56%
between the techniques with scan protocol of 130kVp and 300mAs. With a fixed tube potential of 130kVp and varying tube current-time products from 140mAs to 300mAs, there were average CTDIw of (22.9 + 4.3)
mGy and (23.3 + 4.8) mGy for Barracuda and Ion Chamber techniques respectively with a mean deviation of 0.67 mGy between them.
Results for the CT body phantom examination showed a minimum CTDIvol deviation of 0.85% between the two
techniques when the tube potential and the tube current-time product were set at 130kVp and 80mAs respectively for abdominal examination. When the scan protocol of tube potential and tube current-time product were set at 130kVp and 220mAs respectively for pelvis examination, the maximum CTDIvol deviation was
estimated at 8.73%. With a tube potential of 130kVp and tube current-time product of 180mAs for a chest examination, an estimated CTDIvol deviation of -6.47%
was recorded between the two techniques. Varying the tube current-time products from 80mAs to 220mAs with a fixed tube potential of 130kVp for body (chest, abdomen, pelvis) phantom examination, the average CTDIvol measured were (21.1 + 10.6) mGy and (20.7 +
9.6) mGy for Barracuda and Ion Chamber techniques
respectively with an average deviation of 1.4 mGy between them.
For the CTDIw values of the body phantom, the
minimum CTDIw deviation measured was 3.56% at scan
protocol of 130kVp potential and 200mAs tube current-time product for chest examination. The maximum deviation was also -9.53% which was recorded at 130kVp tube potential and tube current-time product of 220mAs for pelvis examination. When the tube potential of 130kVp and current-time product of 120mAs were set for abdomen examination, CTDIw
deviation of 5.87% was estimated. With a fixed tube potential of 130kVp and varying the tube current-time product from 80mAs to 220mAs for the body (chest, abdomen, pelvis) examination, mean CTDIw measured
were (16.6 + 6.7) mGy and (16.5 + 7.7) mGy for Barracuda and Ion Chamber techniques respectively with an average deviation of 1.0 mGy between them. Unlike some theoretically estimated CT dose softwares like the CT – Expo software, the CT dose profiler which was connected with the Barracuda computes CT dose by the actual phantom measurements. Brix et al., [7] reported that with theoretically estimated CT dose software, the accuracy of the dose measurement may exceed + 10 %.
The estimated CTDI values for the CT head and body phantoms from this study can be compared with study by Hasford et al. [8]. In their CT head and body phantom study, they compared CTDIvol from Ion
Chamber technique with that displayed on the CT system console. At scan protocol of 120kVp and 150 mAs, they reported dose measurements of 44.3 mGy from the Ion Chamber technique with a corresponding console displayed value of 42.4 mGy for the head phantom examination at CTDIvol deviation of 4.5%.
for tube current-time products from 140 – 200mAs and fixed tube potential of 130 kVp for this study is below the diagnostic reference level reported by Inkoom et al.[9] but tube current-time products from 220 – 300 mAs for the head phantom examination with both techniques in this study can satisfactorily be compared with the diagnostic reference levels reported in Inkoom et al.[9]. When the measured and Console displayed CTDIw values were compared for the head phantom
examinations at fixed kVp of 130, there were minimum and maximum deviations of 2.24% and 16.01% at 240 mAs and 180 mAs respectively between the Barracuda technique and displayed. The minimum and maximum CTDIw deviations between the Ion Chamber technique
and the displayed were also 1.87% and 14.01% at 280 mAs and 160 mAs respectively. Again, there were minimum and maximum CTDIvol deviations of 0.9% and
9.89% at 240 mAs and 300 mAs respectively between Barracuda and displayed, 1.35% and 4.99% at 180 mAs and 220 mAs respectively between the Ion Chamber Technique and Displayed.
Also, comparison of measured and displayed CTDIw for
the body phantom examinations at 130kVp, yielded minimum and maximum deviations of 0.22% and 9.95% at 100 mAs and 200 mAs respectively between Barracuda and displayed and -0.67 and 15.85% at 210 mAs and 120 mAs respectively between the Ion Chamber technique and displayed. The minimum and maximum CTDIvol deviations were also -2.33% and
12.15% at 220 mAs and 180 mAs respectively between Barracuda technique and displayed, -1.28% and 9.82% at 160 mAs and 100 mAs respectively between Ion Chamber technique and displayed. Descamps et al., [10] estimated percentage deviations between measured and console displayed doses for new generation CT scanners. Findings from their study showed that measured doses (CTDIvol) for CT examinations could be as much as 32 –
35% higher or lower than console displayed doses.
IV.
CONCLUSION
The results of the study showed that CTDIw and CTDIvol
have been successfully estimated using both devices and techniques described in the research methodology as stated in the study objectives. The CTDIw and CTDIvol
estimations by the Ion Chamber technique were done by setting parameters such as the tube potential (130kVp), slice thickness (4mm and 5mm) and pitch factor (0.55 and 0.8) constant whiles varying the current-time
products from 80 – 300mAs to record charges for both head and body phantoms. Formalism from AAPM Report 96 (AAPM, 2008) to convert charges recorded to exposure and subsequently to CTDI values.
The CTDIw and CTDIvol estimations by the dose profiler
probe were automatically generated by the Barracuda when the scan protocols that were used with the Ion Chamber technique were entered. The minimum and maximum deviations recorded from both techniques were estimated to be 0.69% and -6.56% respectively for CTDIw and 0.61% and -6.45% for CTDIvol for head
phantom examination. These results were comparable to work done by other researches and was within acceptable ranges from existing CT literature.
Measurements for head phantom examination showed a minimum and maximum deviations of 3.56% and -9.53% respectively for CTDIw and 0.85% and 8.73 for CTDIvol
for the head phantom examination. These results were also favourably comparable to values from other retrospective studies.
The results therefore showed that the PTW Ion Chamber validated the CTDI values obtained from the Barracuda technique. The Ion Chamber technique confirms the degree of confidence in the Barracuda for CT dose measurements. For routine clinical environment, any of the two devices or methods can be used adequately to give the needed dose information from the CT scanners. The concept of accuracy was not applicable in this study, since, there is a range of dose values acceptable from a CT scanner to yield quality of image with optimum diagnostic information.
V.
REFERENCES
[1] Goergen, S., Revell, A., & Walker, C. 2009. Computed Tomography (CT). Inside Radiology.
Retrieved March 2, 2016 from
http://www.nibib.nih.gov/science-education/sciencetopics/computedtomograph
y-ct
[2] Bauhs, J. A., Vrieze, T. J., Primak, A. N., Bruesewitz, M. R., & McCollough, C. H. 2008. CT dosimetry: comparison of measurement techniques and devices. Radiographics, 28 (1): 245 – 253.
by transmission x-ray computed tomography. Medical Physics, 8(4): 488 - 495.
[4] AAPM. 2008. The Measurement, Reporting, and Management of Radiation Dose in CT (AAPM Report No.96). Report of AAPM Task Group 23 of the Diagnostic Imaging Council CT Committee. [5] AAPM. 2011. Site specific dose estimates (SSDE)
in paediatric and adult body CT examinations (AAPM Report No. 204). Report of AAPM Task Group 204 of AAPM. College Park, MD
[6] Shrimpton, P. C. 2004. Assessment of Patient Dose in CT. National Radiological Protection Board, 5(5): 1–36
[7] Brix, G., Lechel, U., Veit, R., Truckenbrodt, R., Stamm, G., Coppenrath, E. M., et al. 2004. Assessment of a theoretical formalism for dose estimation in CT: an anthropomorphic phantom study. European Radiology, 14, 1275-1284. [8] Hasford, F., Wyk, B. V., Mabhengu T., Vangu, M.
D. T., Kyere, A. K., Amuasi, J. H. 2015. Determination of dose accuracy in CT examinations. Journal of Radiation Research and Applied Sciences, 8(4): 489 – 492.
[9] Inkoom, S., Schandorf, C., Boadu, M., Emi-Reynolds, G., & Nkansah, A. 2014. Adult medical x-ray dose assessments for computed tomography procedures in Ghana - a review paper. Journal of Agricultural Science and Technology, 19(1 & 2), 1-9