Towards the Design and Development of an
Embedded System For Detecting Silent Aspiration
G. Anitha, N. Sneha and A.P. Krishnaraj
Department of Biomedical Engineering, SRM Kattankulathur, Chennai, India. *Corresponding author E-mail : [email protected]
http://dx.doi.org/10.13005/bpj/1527
(Received: 26 June 2018; accepted: 13 September 2018)
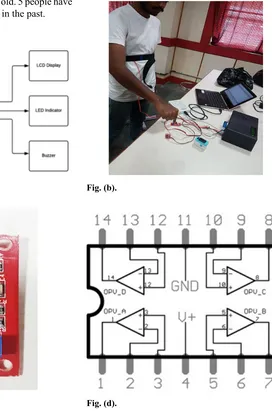
This design describes a mobile prototype for detecting silent aspiration in children, people with neurological disorders using various biosignals such the measurement of the respiratory rate, pulse rate and oxygen saturation. Pulmonary Aspiration is when food or other particles enter from the pharynx into the larynx, often leading to pneumonia or rarely, fatal asphyxiation. In some patients with dysphagia, silent aspiration occurs, where the aspirating patient does not show any sign such as coughing at all. It is common in stroke patients and infants with neurological disorders such as down syndrome and cerebral palsy. The prototype provides signals that can be displayed with NI-myDAQ (LabVIEW). The signals are acquired with the help of a prototype respiratory belt tied around the chest containing a piezo sensor that senses pressure sending electric signals that will help analyse the breath pattern of the patient. The prototype is fitted with a sensor for measuring the pulse rate of the patient through photoplethysmography. They are all connected to a primary Arduino Nano Microcontroller based on the ATmega328P. Housed in a portable container which also contains an LCD display that can display the real time data. The device has an alert system by means of an LED and a Buzzer, the LED signals whenever there’s a pressure and the alarm sounds when there is a gap in the respiratory movement of the patient due to aspiration.
Keywords: Silent Aspiration, Respiration Sensor, Pulse Rate, Signal Processing, LabVIEW.
Cerebral Palsy is a neurological disorder that occurs in the womb and during birth that causes impairment to the movement of the infant, the condition is lifelong. A similar disorder which is more of a chromosomal birth defect is Down Syndrome, which results in mental disabilities and physical impairment. Infants with this disorder sometimes dont have the capability to express their aspiration, often resulting in silent aspiration. Adults who have Parkinson’s Disease and Stroke patients also suffer from silent aspiration due to their disability to express their agitation. Traditionally, the disability is diagnosed in such
patients with methods such as water swallowing test and videofluoroscopy[1]. Videofluoroscopy is an expensive method of diagnosing that is only available in special centers such as hospitals and health care centers, there is no readily available method for finding the disorder when it happens at home or through the course of their daily lives, the incidence of silent aspiration in dysphagic heterogenous group of individuals, with 76% of men and 24% women, was found out to be 59% in a study[2]. In another study dysphagic infants and children with neurological disorders were subjected to Videofluoroscopic Modified Barium Swallow
Published by Oriental Scientific Publishing Company © 2018
Test (MBS), aspiration was observed in 26% of the subjects, with it being silent in 94% of the cases[3]. Our device aims to find the time at which aspiration occurs by means of analysis of the respiratory movement during normal swallowing and the difference that occurs during the phenomenon of aspiration along with the changes in other factors such as pulse rate and movement data of the chest. The data from the piezo sensor is acquired through NI-myDAQ and analysis is done through LabVIEW, where each movement exhibits a downward movement in the waveform. Changes in the pulse rate is also observed during this period to correlate the data. This mechanism is used in conjunction with an alert system in our prototype so that the patients caretaker is alerted to the occurence of the aspiration immediately, so that intervention and primary care can be immediately given
METHODOLOGY
The prototype is designed to detect silent aspiration by the analysis of respiration rate and the pulse rate.
There are three steps of analysis, that are:
• Acquiring respiratory movement and rate
data, which is acquired by the piezo sensor
• Pulse rate acquired using the pulse rate
sensor by means of photoplethysmography
• Analysis of obtained waveform using
LabVIEW.
This section explains briefly about each step of the process.
Measurement of Respiratory Rate
The data is acquired with the help of the disk shaped brass piezoelectric sensor (25mm, 1.5v) that is placed in the respiratory belt. The circuit for measurement of the acquired data consists of an Arduino Nano ATmega328p Microcontroller that has been coded to represent the data as breath rate on the display. Other components include an LM324 Operational Amplifier, Low Pass Filter, Power Amplifier (for Gain Control). LM324 is a Quad Op-Amp with differential inputs. The gain is set in the range of 0-100 dB. The respiration rate can also be displayed on mobile terminals via bluetooth connectivity with the help of bluetooth module HC 05.
Process
The Respiratory belt is tied in the
thoracic region of the subject in such a way that the piezoelectric sensor is positioned on top of the false ribs (Rib 8-10), so that whenever the patient breathes the pressure will make the sensor send an electrical signal. The accelerometer is also present on the belt recording secondary data during breathing. The subject now undergoes food or liquid intake with the belt strapped on, thus allowing us to monitor the respiration rate during the swallowing process. Whenever there is a pause in the breathing, the LED indicator will stop glowing and the buzzer buzzes. Any change in the alert time or in the calculation of the respiratory rate is done through the code in the Arduino using Arduino IDE. The real time changes in the data is displayed in a 16 x 2 LCD Display that is
Measurement of Pulse Rate and Oxygen Saturation
The pulse rate of the patient is checked with pulse rate sensor. The device is incorporated with photodiode (black), Infrared LED, comparator LM358, Low Pass Filter, Power Amplifier (gain control). The gain ranges from 0-100 dB. It works under the principle of photoplethysmography. The principle explains that the volume of the blood that changes is measured by the light intensity change that passes through the organ. Based on the heart pumping, whenever the blood pressure changes, the amount of IR light from emitter is getting reflected on the detector.
Process
The patient is asked to place the finger in between the heart rate sensor and IR LED. Because of the usage of IR LED the heart rate sensor setup has to be covered. Once the finger is placed by the patient the pulse rate of the patient is displayed in LCD. The pulse rate, and the respiration rate are checked simultaneously and Sp02 is measured before and after swallowing.
Analysis of the waveform
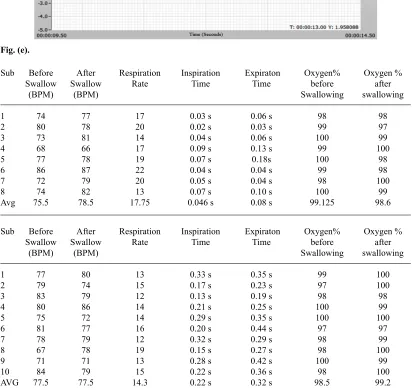
Signals from the piezoelectric sensor are displayed on the LCD via Op-Amp LM324, on which the Output 3 at pin number 8 provides the positive signal from the sensor. A lead from this pin and from the ground (gnd, pin number 11) are given to the input AI0 and AGND of the NI-myDAQ measuring equipment.
Fig. (a). Fig. (b).
Fig. (c). Fig. (d).
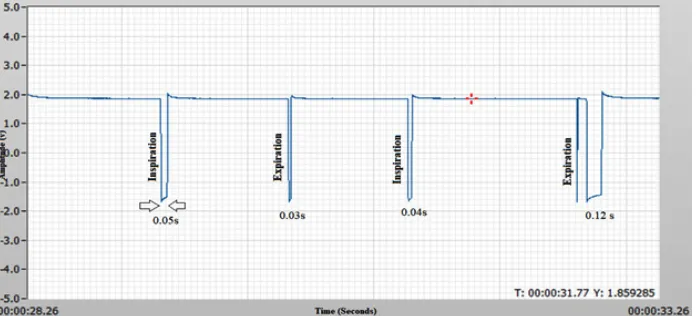
help of Biomedical Workbench using LabVIEW. The waveform can now be saved for use in signal processing and reviewing. The waveform contains pulses in the form of a square waveform whenever there is a signal emitted by the piezoelectric sensor.
Logging was done while during normal breathing and also while swallowing liquid or food. Whenever there is a pause in the waveform for a set amount of time, the buzzer emits a sound to signal that the user has not taken a breath. This is used as an indication for aspiration
Subjects
Tests were performed on a mixed group of 23 subjects of which 43.47% of the subjects were male and 56.53% were female. The mean age of the subjects was 28.5 years, as out of the 23 subjects, 13 subjects were under 25 years old. 5 people have had lung issues and pneumonia in the past.
Analysis
Each subject was strapped with the respiratory belt, recording was done for 40 seconds each with the subject breathing normally for the first 20 seconds and the next 15-20 seconds while taking gulps of water. Waveforms were obtained from all subjects and the heart rate before and after the procedure was noted. 2 types of waveforms were found to be common after signal analysis - normal and abnormal waveforms.
Sub Before After Respiration Inspiration Expiraton Oxygen% Oxygen %
Swallow Swallow Rate Time Time before after
(BPM) (BPM) Swallowing swallowing
1 74 77 17 0.03 s 0.06 s 98 98
2 80 78 20 0.02 s 0.03 s 99 97
3 73 81 14 0.04 s 0.06 s 100 99
4 68 66 17 0.09 s 0.13 s 99 100
5 77 78 19 0.07 s 0.18s 100 98
6 86 87 22 0.04 s 0.04 s 99 98
7 72 79 20 0.05 s 0.04 s 98 100
8 74 82 13 0.07 s 0.10 s 100 99
Avg 75.5 78.5 17.75 0.046 s 0.08 s 99.125 98.6
Sub Before After Respiration Inspiration Expiraton Oxygen% Oxygen %
Swallow Swallow Rate Time Time before after
(BPM) (BPM) Swallowing swallowing
1 77 80 13 0.33 s 0.35 s 99 100
2 79 74 15 0.17 s 0.23 s 97 100
3 83 79 12 0.13 s 0.19 s 98 98
4 80 86 14 0.21 s 0.25 s 100 99
5 75 72 14 0.29 s 0.35 s 100 100
6 81 77 16 0.20 s 0.44 s 97 97
7 78 79 12 0.32 s 0.29 s 98 99
8 67 78 19 0.15 s 0.27 s 98 100
9 71 71 13 0.28 s 0.42 s 100 99
10 84 79 15 0.22 s 0.36 s 98 100
AVG 77.5 77.5 14.3 0.22 s 0.32 s 98.5 99.2
Fig. (e).
Group 2 (Normal Waveform) - Fifteen subjects, who exhibited similar types of signal pattern while swallowing.
The normal waveform had similar time period of inspiration and expiration, about 0.15 - 0.40 seconds. Whereas, the abnormal waveform
RESuLTS
In the subjects that were analysed, Pulse rate was taken before and after swallowing, the Group 1 subjects (abnormal) exhibited a very slight increase in the pulse rate which is barely noticeable. There was a slight decrease in oxygen saturation of 5 patients in Group 1, of them 3 people had already been affected by pneumonia or had respiratory problems. They exhibited a minute decrease in the Sp02 value (around 1.5-2%) which is in line with the report by Brown SE. et al [5]. The change in pulse rate can be attributed to the act of swallowing as reported by previous studies [4]. Group 2 did not exhibit any change in the average pulse rate. The Inspiration and Expiration times however exhibited a noticeable change. In Group 1, the average Inspiration and Expiration times were significantly lower than that of the Group 2 Subjects. There was a 79% decrease in the Inspiration time from Group 2 to Group 1, and
a 75% decrease in Expiration Time from Group 2 to Group 1.
COnCLuSiOn
In this project, a device for detecting silent aspiration has been prototyped and tested to work.Change in Inspiration and Expiration times is very significant and can provide to be a useful marker among others for a successful diagnosis. From the results we can conclude that although there is an increase in the pulse rate, it can be safely said that it was caused mostly because of the swallowing and not due to problems. The change in Oxygen Saturation can be used as a indirect marker for detecting silent aspiration.
REFEREnCES
1. D. Kidd, J. Lawson, R. Nesbitt, J. MacMahon; Aspiration in acute stroke: a clinical study with videofluoroscopy, QJM: An International Journal of Medicine, 86(12): Pages 825–829 (1993).
2. Smith, C. H., Logemann, J. A., Colangelo, L. A., Rademaker, A. W., & Pauloski, B. R. Incidence and Patient Characteristics Associated with Silent Aspiration in the Acute Care Setting. Dysphagia,
14(1): 1-7 (1999). doi:10.1007/pl00009579 3. Arvedson, J., Rogers, B., Buck, G., Smart, P.,
& Msall, M. Silent aspiration prominent in children with dysphagia. International Journal of Pediatric Otorhinolaryngology, 28(2-3): 173-181 (1994). DOI: 10.1016/0165-5876(94)90009-4
4. Tamura, Fumiyo et al. “Arterial Oxygen Saturation in Severely Disabled People: Effect of Oral Feeding in the Sitting Position.” Dysphagia
14: 204-211 (1999).