* To whom all correspondence should be addressed.
On Certain Aspects of Development of
Effective Adaptive Ventilation System
Sergey Fedorovich Serov, Vladimir Vladimirovich Efremov, Alexander Alexandrovich Naumov and Dmitry Vladimirovich Kapko
JSC “TSNIIPROMZDANII”, Russia, 127238, Moscow, Dmitrovskoe shosse, 46/2 DOI: http://dx.doi.org/10.13005/bbra/1991
(Received: 15 August 2015; accepted: 20 September 2015)
Adaptive ventilation systems or demand controlled ventilation systems allow to adjust performance of a system, while maintaining acceptable or optimum parameters of comfort in serviced spaces and rooms, which allows to save energy resources according to actual demand of a serviced building. At stages of design and installation of variable volume ventilation systems a number of issues, which can increase their energy efficiency, are not taken into account. They are as follows: a) increase of transmission heat loss through walls of air ducts with decrease of airflow; b) adequacy of airflow adjustment at a fan in regard to load, decrease of negative effect of flow redistribution between all spaces in a case of a decrease of demand in one of spaces; c) efficient placement of primary load sensors in spaces; d) efficiency of placement of air distributors, limiting value of overcooling of air depending on layout of an air distribution system. The presented paper discusses those issues and gives recommendations for prevention of the mentioned negative effects.
Key words: Demand controlled ventilation, air distribution, duct heat loss.
Adaptive ventilation systems (AVS), demand controlled ventilation systems (DCV), variable volume ventilation systems are terms characterizing wide class of ventilation systems, which are capable to adjust airflow provided to an serviced spaces depending on actual demand. Capability to adjust airflow gives a significant energy saving potential as compared to constant air volume ventilation systems. In various cases energy saving varies from 10 to 80% (Afshari and Bergsoe, 2005; Donnini et al., 1991; Jannsen et al., 1982; Fehlmann et al., 1993; Laverge et al., 2011; Mysen et al., 2005; Roth et al., 2003; Zamboni et al., 1991). Values of decrease of energy expenditures depends on many factors, some of which are specific for adaptive ventilation systems:
a) type, accuracy, method of installation of load sensors (carbon dioxide sensors, presence sensors, volatile organic substances sensors, etc.) and strategy of fan control according to data from primary sensors; b) air distribution system in serviced spaces; c) transmission losses during feeding of
overcooled or overheated air in summer or winter period;
d) length of air duct network and its branching parameters;
e) type of building and daily load graph in a building;
f) scheme of adjustment of flow by branches, adequacy of reaction of fan control to a change of load;
nonuniformity and peaks of load during a day. That is a typical situation for many public buildings, such shopping centers, lecture halls of educational institutions, sports facilities, etc. However, achieving the full potential is a hard task, which rises the problems mentioned above.
AVS control strategy
Ventilation air duct network can be simplified as a main line, which is connected with a ventilation equipment and a fan, and branches of a main line, which feeds air to various serviced spaces. If branches seriously differ in aerodynamic resistance, problems in dynamic balancing of branches occur. There are two main strategy of airflow control in an air duct network.The first one is fan control on signals from pressure sensor, which is installed in a main line’s air duct. That strategy requires accurate commissioning trials and adjustment, in particular, selection of a sensor positions and its pressure setting. Correct positioning of a sensor directly influences a system’s efficiency. If the sensor is placed in an incorrect way, decrease of load in one space will lead to just a redistribution of air between other spaces. Change of pressure at the sensor’s position will be minimal in that case, and, therefore, changes of a fan output will be minor as well. The main parameter in setting is a degree of opening of a control valve on a branch with maximum resistance at maximum airflow. Opening of a valve at that branch must be not less than 80% for a maximum airflow of a system (Mysen and Schild, 2011; Mysen
et al., 2015). However, that strategy always leads to large energy expenditures by a fan, as compared to another approach. The second strategy consists of adjustment of a fan’s flow by an optimization unit, which is a controller, gathering information about valves status for each branch and airflow at them; it provides maximum opening of all valves taking into account ensuring a required airflow at each serviced space. The studies show that the second strategy allows to save up to 64% of electricity (Truninger, 2013).
Selection of a fan, placement of sensors and selection of air distribution layout
Selection of a fan in AVS is not an easy task, it firstly seems. Selection of a fan for CAV follows the rule, according to which at a working point a fan must have the biggest efficiency ratio. GOST 10616-90 “Radial and axial fans.Dimensions
and parameters” requires to select fans in a way, in which their efficiency ratio at a working range was not less than 0.9 from maximum. In a case of AVS meeting that requirement is often impossible, because a working range is very wide. The working range for AVS in that case must be considered as a range of flows, at which a system operates for the major part of its time. Usually that factor is not taken into account during design of AVS, and fans in them are designed from a condition of the biggest efficiency ratio at a maximum flow.
For testing of load at a space the usually used sensors are carbon dioxide sensors, presence sensors, temperature sensors; the less often used sensors are humidity sensors and sensors of volatile organic substances and particles.
Algorithm of transformation of primary sensors’ signals into signals of a fan control plays a certain role in energy efficiency of a system. The study of Lu (Lu et al., 2011) describes a dynamic algorithm, which allows to decrease energy expenditures of AVS controlled by CO2 to 26% as compared with a system with proportional control. Generally, sensors are positioned at top level of a working zone or in a sectional exhaust duct (Emmerich and Percily, 2001).
Quality of air distribution is not a specific efficiency criteria for DCV, because it also used for CAV systems. However, DCV in a case of change of airflow through air distributor, changes operation mode, and parameters of speed and air overcooling of the major number of types of air distributors in that situation go beyond required range. Table 1 presents coefficients of efficiency of air use for various types of air distributors. The required airflow for ventilation of residential and public spaces it to be calculated according to GOST 30494-2011 taking into account coefficient of efficiency of air distribution.
L = η . Lb, m³ / h, ...(1) where Lb – basic volume of external air according to actual standards, m3/h.
Analysis of graph of ventilation system loading In a course of calculation of maximum airflow in ventilation systems of public buildings it is usually accepted that a number of people in a space is equal to a value, which is calculated on a basis of specific values of area per one person or by number of seats. In practice, that number of people is rarely achieved because a number of people are on vacation, sickness leave, business trip, etc. Generally, load of ventilation system is 60-80%. For sports facilities, shopping centers and educational institutions load from people in some periods of day can be close to zero. In that case a background volume of air is supplied, which is aimed at removal of harmful substances produced by interior, finishing materials or it can be accepted at level of 10-20% from maximum.
Transmission losses
Degree of overcooling of overheating of supplied air is especially seriously affect losses in AVS. In CAV speed of air in air ducts is, generally, in range of 4-6 m/s, thickness of thermal insulation is 10-20 mm (for expanded rubber and polyethylene) with thermal conductivity of 0.038 W/m·K. If overcooling and overheating of air is 5-7 °C for a long network of air ducts, losses of useful temperature difference are, in general, 0.5-1°C. For AVS, depending on depth of control, those losses can increase 2-4 times. Losses of useful temperature difference are especially large for small flows in air ducts with small cross-section at the last meters of a network before an air distributor. As AVS work with partial loading for the most time, in general for 60-80%, it is reasonable to design cross-sections of air ducts on a basis of that flow in order to decrease heat losses. At that, it is necessary to take into account generation of noise at 100% load. Also, it is necessary to assess ratio of effect from heat saving and losses due to increased load to a fan. Generally, it is more reasonable to save heat or cold in cold and hot regions, but in regions with moderate climate electricity expenditures due to a fan operation are more important.
Methodology for calculation of transmission losses
Movement of overcooled or overheated air in ducts inevitably leads to heat losses, which are related with heat transfer, radiation from outer surface of insulation and losses due to leakages.
For CAV systems those loses are constant. On a basis of a calculated flow and air temperature, as well as length of a network, thickness of insulation is selected. For systems with variable volume thickness of insulation must be selected not for maximal, but for minimal calculated airflow. At minimal airflow heat losses on air transport become maximum. There is an existing methodology for calculation of air temperature difference at a section of an air duct:
...(2)
where t1 – starting air temperature in an air duct, °C,t2 – temperature of environment around an air duct, °C, L – length of a calculated section of an air duct, m, A – complex value of calculated parameters, 1/m, calculated as follows:
...(3)
where C1 – heat capacity at temperature t1, J/(kg·K), G1 – mass flow of air, kg/s, k– heat-transfer coefficient, W/m·K, calculated as follows:
...(4)
where α1,α2– heat transfer coefficients at internal and external surfaces of air ducts’ walls, W/(m2·K), d
1,d2,d3 – diameters of internal surface
of an air duct, external surface of an air duct and external surface of a thermal insulation layer (in a case of a rectangular air duct, correspondingly, equivalent diameters), λ1-λ2 – thermal conductivity coefficients of a an air duct’s wall material and a thermal insulation material, W/(m·K). Coefficient of heat transfer at external surface is calculated as sum of heat transfer coefficients due to natural convection and radiation:
α
2 = αc + αr ...(5)
...(6)
where σ – Stefan-Boltzmann constant, ts – temperature of a thermal insulation’s external surface, ε1,ε2 – emissivity of a thermal insulation surface and averages emissivity of surface of an air duct’s environment. Temperature at an air duct’s surface is accepted constant in that case, and it can be defined as:
...(7)
...(8)
RESULTS
Let’s discuss heat losses on the example with the following parameters: length of the network – 50 m, diameters of air ducts – 500-160 mm, speed
of air in an air duct 6m/s, overcooling of air – 6°C, thermal insulation material thickness – 10 mm and thermal insulation material thermal conductivity coefficient – 0.038 W/(m·K). Increase of air temperature for that parameters is 1.12 °C. Thus, 18.7% of useful heat is lost. Useful heat in that case is clear heat, which is brought by inflow air into a space due to temperature difference of inflow air and air in a space.
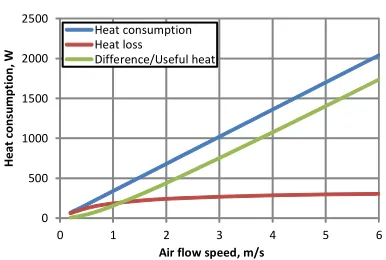
Heat losses are increasing in a case the system operates with partial load and it’s speed in air ducts is decreasing. For 75% load (speed is 4,5 m/s) temperature increase is 1.41°C, for 50% (speed is 3 m/s) –1.91 °C, for 25% (speed is 1.5 m/s) – 2.94°C. Thus, change of flow from 100% to 25% of maximum flow leads to increase of transmission losses from 18.7% to 49% of useful heat, which is brought by inflow air in a space. Figure 1 shows graph of relationships between heat consumption, transmission losses and resulting line of “useful remainder” after subtraction of the two previous members. For the calculation of the graph lines accepted parameters of the system are the same with the presented above. It’s clear that for a certain low flow heat losses for transportation of air in an air duct are getting close to heat expenditures for air processing. For 1.2 m/s speed heat losses are
Table 1. Air distribution efficiency coefficients
Ventilation systems Air distribution efficiency coefficient
Systems of “mixing” ventilation with ratio ofair exchange more than
2.5 1/hour, including recirculation, with split-systems and fan coil units 1.0 Isothermal ventilation systems or ventilation systems combined with
air heating with air distribution layout “up to down” with air exchange
ratio not more than 1.5 1/hour. 1.1-1.3 Displacement ventilation systems 0.6-0.8 Personal ventilation systems with feeding of incoming air into breathing zone 0.3-0.5
Table 2. Comparison of energy expenditures on regulation of DCV performance
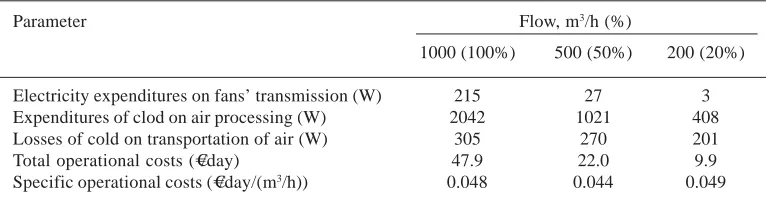
Parameter Flow, m3/h (%)
1000 (100%) 500 (50%) 200 (20%)
50%. It means that for low values of flow it is unreasonable to feed overcooled or overheated air, and it is reasonable to feed air with a space temperature (isothermal ventilation) heating or cooling it only for a difference between external and internal temperature. An additional advantage of isothermal ventilation at low flows is air distribution self-regulation effect. If a system uses regular ceiling-mounted air diffusers, which are designed for CAV systems, at low speeds of overcooled air effect of “falling” of stream occurs. It leads to discomfort, because in zones around diffusers air showering effect with cold air takes place. That negative effect can be avoided by decreasing of air overcooling for low speeds and for minimal flow switching to isothermal ventilation. Similar effect is observed in systems with displacement ventilation: with low flow overcooled air accumulates in vicinity of a space’s floor, high temperature gradient by height of working zone occurs, which leads to uncomfortable
draught near floor. Feed of air with lower overcooling allows to avoid that effect.
Table 2 shows comparison of operational costs for unit of air flow for full and partial loads. It was considered that losses of cold for transportation of air are compensated by parallel system of cold supply with coefficient of performance COP=3.0. Efficiency ratio of a fan is accepted as 0.8, efficiency ratio of transmission from a motor to a fan impeller is 0.95 and power reserve of a motor is 1.2. It’s clear that decrease of flow leads to decreasing of operational cost, but costs per 1 m3/h is increasing due to heat losses.
For control of heat losses in DCV air ducts during decrease of air flow it is possible to proportionally decrease difference between temperature of air after a ventilation equipment and in a space. In that case, level of losses will remain virtually constant and even slightly decrease due to lesser leaks at lesser static pressure after a fan. In that case thickness of thermal insulation can be designed in
Table 3. Comparison of energy expenditures during flow control for constant and variable degree of overcooling of air
Parameter Flow, m3/h (%)
800 (80%) 500 (50%) 200 (20%)
Δt=6 Δt=4.8°C Δt=6°C Δt=3°C Δt=6°C Δt=1.25°C
Electricity expenditures on fans’ transmission (W) 110 110 27 27 3 3 Expenditures of heat on air processing (W) 1633 1306 1021 510 408 82 Losses of heat on transportation of air (W) 295 235 270 133 201 39 Specific operational costs (€/day/(m3/h) 0.045 0.044 0.044 0.040 0.049 0.036
(-2.2%) (-9%) (-23%)
0 500 1000 1500 2000 2500
0 1 2 3 4 5 6
Hea
t c
o
ns
umpti
o
n
, W
Air flow speed, m/s Heat consumption
Heat loss
Difference/Useful heat
Fig. 1. Ratio of air flow and losses of heat at various speeds of air flow
CONCLUSION
As a conclusion, the following recommendations are made for design of AVS: a) if possible, select an air distribution layout,
which has the highest efficiency of air use according to Table 1;
b) for multi-zone DCV a fan control system using optimizer of control valve position at branches is to be selected. In that system the required pressure of a fan can be 4-5 times lower as compared to a system controlled by pressure sensor in a main line air duct;
c) degree of overcooling or overheating of air must be controlled for reduction of energy expenditures for transportation of overcooled or overheated air even in throughly insulated and airtight network of air ducts. That allows to decease negative effects of falling of stream in a case of use of ceiling-mounted diffusers and during control in general.
ACKNOWLEDGMENTS
This research was supported by the Ministry of Education and Science of the Russian Federation under the federal target program “Research and Development on Directions Areas of the Research and Technological Complex of Russia in the Years 2014-2020” (Grant Agreement No. 14.576.21.0009 dated 17 June 2014, Unique Identifier RFME-FI57614X0009).
REFERENCES
1. Donnini, G., F.Haghighatand V.H. Hguyen, 1991. Ventilation Control of Indoor Air Quality, Thermal Comfort, and Energy Conservation by Co2 Measurement. Proceedings of the 12th AIVC Conference Air Movement & Ventilation Control within Building,Canada, Ottawa, pp: 311-331. 2. Emmerich, J.S. and A.K.Persily, State-of-the-Art Review of CO2Demand Controlled Ventilation Technology and Application.
National Institute of Standards and Technology, 2001.
3. Fehlmann, J., H. Wannerand M. Zamboni, Indoor Air Quality and Energy Consumption with Demand Controlled Ventilation in an Auditorium. Proceedings of the 6th International Conference on Indoor Air Quality and Climate 1993; 5: 45-50.
4. Janssen, J.E., T.J. Hill, J.E. Woodsand E.A.B. Maldonado, Ventilation for Control Indoor Air Quality: A Case Study. Environment International, 1982; 8: 487-496.
5. Laverge, J., N. Bossche, N.Heijmansand A. Janssens, Energy Saving Potential and Repercussions on Indoor Air Quality of Demand Controlled Residential Ventilation Strategies.
Building and Environment, 2011; 7(46): 1497 1503.
6. Lu, T., X. Luand M. Viljanen, A Novel and Dynamic Demand-Controlled Ventilation Strategy for CO2Control and Energy Saving in Buildings. Energy and Buildings, 2011; 43: 2499– 2508.
7. Mysen, M., S. Berntsen, P.Nafstadand P. Schild, Occupancy Density and Benefits of Demand-Controlled Ventilation in Norwegian Primary Schools. Energy and Buildings, 2005; 12(37): 1234-1240.
8. Mysen, M., A. Cable, P.G.Schild and J.Woollett, Startup and Commissioning of an Adaptive Ventilation System. AVOK, 2015; 5: 32-37. 9. Mysen, M. and P.G. Schild, Requirements for
Well-Functioning Demand Controlled Ventilation. The REHVA European HVAC Journal, 2011; 5: 14-18.
10. Roth, W.K., J. Dieckmannand J. Brodrick, Demand Controlled Ventilation. ASHRAE Journal, 2003; 91-92.
11. Sukhatme, S.P., A Textbook on Heat Transfer (4thed.). Hyderabad, India: Universities Press Private Limited, 2005.
12. Truninger, K., VAV System with Genuinely Demand-Controlled Fans. The REHVA European HVAC Journal, 2013; 50: 15-18. 13. Zamboni, M., O. Berchtold, J. Filleuxand F.
Drangsholt, Demand Controlled Ventilation – an Application to Auditoria. Indoor Air, 1992;
4(2): 263-271.
![Coordination chemistry of N heterocyclic carbene and thione functionalised calix[4]arene ligands](data:image/gif;base64,R0lGODlhAQABAIAAAP///wAAACH5BAEAAAAALAAAAAABAAEAAAICRAEAOw==)