171
Preparation of H-ZSM-5 Nano-Zeolite Using Mixed
Template Method and its Activity Evaluation for Methanol
to DME Reaction
S. Abbasian, M. Taghizadeh*
Chemical Engineering Department, Babol University of Technology, Babol, I. R. Iran
(*) Corresponding author: [email protected]
(Received: 04 April 2014 and accepted: 16 Aug. 2014)
Abstract:
H-ZSM-5 nano-zeolites were synthesized by hydrothermal method using tetrapropylammonium hydroxide (TPAOH) as a template in the presence of various TPABr concentrations. The effect of different TPABr/ TPAOH molar ratios was studied on the catalytic performance of dehydration of methanol to dimethyl ether
(DME) in a fixed bed reactor under the same operating conditions (T=300°C, P=1 atm, and WHSV=26 h−1).
The prepared catalysts were characterized by XRD, SEM, BET and NH3-TPD. The characterization results showedthat the crystal sizes of the catalysts enlarge by increasing the concentration of TPABrin the synthesis reaction mixture. It was observed that H-form zeolite catalysts were active and selective for DME synthesis. These catalysts showed a high methanol conversion and also very high DME selectivity. It was found that by
addition of up to 10 mole% TPABr in the synthesis reaction mixture, no significant effect was observed on the
physical and chemical properties and catalytic activity of prepared catalysts.
Keywords: Methanol dehydration, Dimethyl ether (DME), H-ZSM-5 nano-zeolite, Hydrothermal method, Mixed template.
Int. J. Nanosci. Nanotechnol., Vol. 10, No. 3, Sept. 2014, pp. 171-180
1. INTRODUCTION
The importance of DME (dimethylether) as an alternative clean fuel for diesel has recently received growing attention due to some of its important properties like low CO and NOxemission and near zero smoke and other environmental friendly properties and high energy content [1–5].
Methanol is converted to DME by dehydration of methanol (Eq. 1) on acid catalysts [6]:
2 O
H + OCH CH OH
2CH3 acidcatalyst 3 3 2 (1)
Many different solid acid catalysts such as γ-alumina,γ-alumina modified with silica and phosphorus, and zeolites (chabazites, mordenites, SAPOs, H-ZSM-5, H-Y,...) in a temperature range of 250–400 °С and pressures up to 18 bar have been used for DME synthesis[7–10].
In 1972 a kind of high-silica zeolite was found and reported by Argauer and Landolt from Mobil Oil Corporation which was called ZSM-5[11]. This zeolite has received much attention due to its particular structure and physical-chemical performance, shape selectivity, stability and the flexibility, so it has been used in a variety of processes, such as dehydration of methanol, conversions of methanol to olefins (MTO) and gasoline (MTG), and FCC process[12–17]. Since 1972, extensiveresearch has been carried out particularly to find catalysts having higher selectivity for the ether formation and less tendency to coke formation to prevent catalyst deactivation and ultimately stop dehydration process. Accordingly, many researchers have tried to find a modified catalyst structure and/or formulation in order to optimize the DME production as well as improve the catalyst stability [18–22].
ZSM-5 is synthesized by a variety of organic templates, in which tetrapropylammoniumcation (TPA+) is known as the most effective templating agent among them. Despite the excellent
templating effect of TPA+cations they can create many problems like poisonproduction, waste
water contamination or air pollution due to thermal decomposition of organic templating agents. One of the most important problems with regard to ZSM-5 is its high production cost and the main reason of this cost is due to tetrapropylammonium hydroxide (TPAOH) as direct templating agent [23–27]. Therefore, lowering the TPAOHconcentration in the synthesis reaction mixture without reducing the catalytic activity of prepared catalyst would reduce running costs and possibly reduce the capital costs of the process as well.
Zhu et al. employed a double template system, where the TPAOH template was governing crystallization of the MFI zeolite phase and polyvinyl butyral was used as a mesopore directing agent [28]. Xin et al. used a combination of TPABr and [3-(trimethoxysilyl)propyl] octadecyl- dimethylammonium chloride to synthesize iron-exchanged ZSM-5 powders containing mesoporous aggregates of smaller than 50 nm microporous ZSM-5 particles and tested the catalytic activity of the zeolite in selective hydroxylation of benzene to phenol [29].
Many different solid acid catalysts such as γ-alumina,γ-alumina modified with silica and phosphorus, and zeolites (chabazites, mordenites,
SAPOs, H-ZSM-5, H-Y,...) in a temperature range of 250–400°С and pressures up to 18 bar have been used for DME synthesis[7–10].
172
prevent catalyst deactivation and ultimately stop dehydration process. Accordingly, many researchers have tried to find a modified catalyst structure and/or formulation in order to optimize the DME production as well as improve the catalyst stability [18–22].
ZSM-5 is synthesized by a variety of organic templates, in which tetrapropylammoniumcation
(TPA+) is known as the most effective templating
agent among them. Despite the excellent templating effect of TPA+ cations they can create many
problems like poison production, waste water contamination or air pollution due to thermal decomposition of organic templating agents. One of the most important problems with regard to ZSM-5 is its high production cost and the main reason of this cost is due to tetrapropylammonium hydroxide (TPAOH) as direct templating agent [23–27]. Therefore, lowering the TPAOH concentration in the synthesis reaction mixture without reducing the catalytic activity of prepared catalyst would reduce running costs and possibly reduce the capital costs of the process as well.
Zhu et al. employed a double template system,
where the TPAOH template was governing crystallization of the MFI zeolite phase and polyvinyl butyral was used as a mesopore directing agent [28]. Xin et al. used a combination of TPABr and [3-(trimethoxysilyl)propyl] octadecyl- dimethylammonium chloride to synthesize iron-exchanged ZSM-5 powders containing mesoporous aggregates of smaller than 50 nm microporous ZSM-5 particles and tested the catalytic activity of the zeolite in selective hydroxylation of benzene to phenol [29].
MFI membranes are synthesized in the presence of organic templates such as tetrapropylammonium hydroxide (TPAOH). Since TPAOH is expensive, the preparation of MFI zeolite membranes without organic template or with cheap substitute template such as tetrapropylammonium bromide (TPABr) has been reported to reduce membrane cost and minimize the intercrystalline gaps for improving membrane selectivity [30–33].
In the present work, H-ZSM-5 nano-zeolites were prepared by a hydrothermal crystallization method with mixed templating agents. We tried to replace
tetrapropyl ammonium bromide (TPABr) with TPAOH in different molar ratios because of its lower price. The physicochemical properties of prepared catalysts were characterized by XRD, SEM, BET
and NH3-TPD and their performance wasevaluated in the catalytic dehydration of methanol to DME process using a fixed-bed flow reactor under the same operating conditions.
2. EXPERIMENTAL
2.1. Materials
The reactant materials used in this study were aluminum nitrate nonahydrate (ANN; Al(NO3)3•9H2O, 98.5 wt%, Merck) as aluminum source, tetrapropylammonium hydroxide solution (TPAOH, C12H29NO, 40% aqueous solution, Merck)
and tetrapropylammonium bromide (TPABr, C12H28NBr, 99 wt%, Merck) as direct template agent, sodium hydroxide (NaOH, 98 wt%, Merck) and tetraethyl orthosilicate (TEOS, Si(OC2H5)4, 98 wt%, Merck) as a source of silica.
2.2. Catalyst preparation
The reaction mixture for the hydrothermal synthesis of Z-xBr (four batches) had the following molar compositions: 0.24Al2O3:60SiO2:(21.4-x) TPAOH:xTPABr:xNaOH:650H2O. First, the alumina source and 1/2 of required distilled water and TPAOH were mixed together in a polypropylene bottle with stirring at about 15 min until aluminum nitrate was completely dissolved. Then the rest of water and the required amounts of sodium hydroxide and TPABr were added to the solution and stirred briefly to dissolve the solid TPABr and NaOH. Next, TEOS was added dropwise to the reaction mixture. The solution was stirred for 3 h at room temperature to hydrolyze TEOS completely. The resulting clear gel was then placed in a Teflon-lined stainless steel autoclave under static conditions at 180°C for 72 h. The white solid product was washed with distilled water several times until the pH reached about 7. The white solid product was centrifuged at a speed of 15000 rpm, washed several times with double distilled water, dried overnight at
173
105°C and calcinated in air at 550°C for 10 h at a heating rate of 3.5°C/min to remove residual water, ammonia, ammonium nitrate and the structure directing agent (TPA+). In the samples which NaOH
was used, the Na-form zeolites were obtained. Na-ZSM-5 zeolites have been convertedinto the H-form by three consecutive ion-exchanges using an excess of 1 M aqueous NH4NO3 with a solution/ zeolite ratio of 10 ml/g at 80°C for 1 h and resulting samples were dried a 105°C and calcinated again at 520°C for 3 h.
The samples are designated as Z-xBr,in which x was varied from 0 to 3.21 resultedina decrease in the amount of TPABr by 0 to 15 percent in the synthesis reaction mixture, respectively.
2.3. Characterization
The surface area (SBET), total pore volume
(Vp), and mean pore diameter (dp) of the
calcinednanocrystalline ZSM-5 samples were
measured by N2 adsorption at –196°C using the Brunauer–Emmett–Teller (BET) method on a Belsorp mini II series instrument (BelJapan). Powder X-ray diffraction patterns (EQuinox 3000, INEL, France, X-ray diffractometer using a Cu Kα radiation source with λ = 1.5406 Å and nickel filter) were recorded with 2θ range of 0–80 degrees with 1 s/step and 0.03 step size. The peaks between 2θ= 21.5° and 24° were calculated to obtain the relative crystallinity of the samples compared to the pattern (JCPDS No. 42–24).
The acidic properties of the samples were measured
via temperature programmed desorption of ammonia (NH3-TPD), using a Pulse ChemiSorb 2705 instrument (Micrometrics, Norcross, GA) with a conventional flow device, which equipped with an online thermal conductivity detector (TCD). In a typical analysis, 0.3 g of the sample was degassed at 500°C under a helium flow rate of 50 ml/min at
a heating rate of 10°C/min for 120 min. Next, the
sample was saturated with pure NH3 for 120 min
when it was cooled to 100°C. The sample was then purged with a helium flow for 60 min to remove weakly and physically adsorbed ammonia on the surface of the catalyst. Afterwards, the sample was cooled to room temperature and then heated again
under a flow of helium carrier gas (50 ml/min) at a rate of 10°C/min, from 35 to 800°C. Finally, the
amount of NH3 in the effluent was measured using TCD and recorded as a function of the temperature. Scanning electron microscopy was performed on the samples to determine their particle size and morphologyusing a TESCAN-VEGA SEM
instrument.
2.4. Catalytic tests
The dehydration of methanol was performed in a bed reactor at atmospheric pressure. A fixed-bed stainless steel reactor having 10 mm of inner diameter and 920 mm length was used. In each test, 0.9 g of the catalyst was packed between quartz wool plugs and placed in the middle part of the reactor. Pure methanol was pumped from a feed tank by the stroking pump (LMI Milton Roy series P-133) at a flow rate and weight hourly space velocity (WHSV) of 0.5 ml/min and 26 h−1, respectively.The reactor effluent was analyzed quantitatively by an online GC (Teif Gostarfaraz Co., Iran) equipped with HayeSep Q column and flame ionization detector,
applying temperature programming starting at
35°C (2 min at the initial temperature) and heating to 160°C (4 min at the final temperature) at a rate
of 10°C min−1.The reaction performance results, including methanol conversion, DME selectivity and yield, were subsequently calculated.
3. RESULTS AND DISCUSSION
3.1. Characterization results
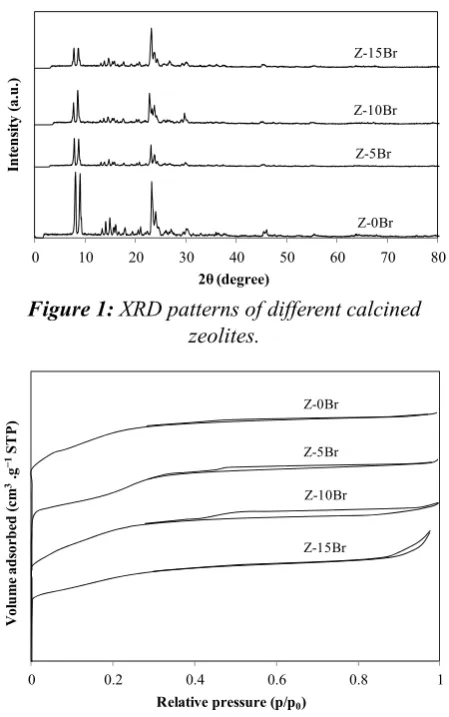
Figure1 shows XRD patterns of samples crystallized using different molar ratios of templates. The XRD patterns show peaks in the 2θ range of 21.5°–24°, which correspond to specific peaks of the H-ZSM-5 sample (JCPDS No. 42–24), and no peaks corresponding to Na-containing phases are detected. It is seen that all the samples are highly crystalline. The average crystal size of synthesized samples is summarized in Table 1 which was estimated using Scherer equation.
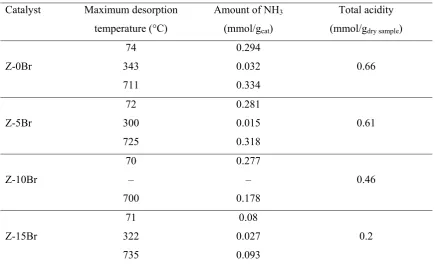
The N2 adsorption-desorption isotherms of the samples are shown in Figure 2. As it is evident, all
174
the samples can be classified as a type I isotherm and they indicate the presence of low fractions of mesopores structureto some extent.
17 Figure1
0 10 20 30 40 50 60 70 80
In
ten
sit
y (
a.u
.)
2θ (degree)
Z-0Br Z-5Br Z-10Br Z-15Br
Figure 1: XRD patterns of different calcined zeolites.
18
Figure2
0 0.2 0.4 0.6 0.8 1
V
ol
um
e a
ds
orb
ed
(c
m
3.g
−
1ST
P)
Relative pressure (p/p0)
Z-0Br Z-5Br Z-10Br
Z-15Br
Figure 2: N2 adsorption-desorption isotherms of different zeolite samples.
The BET surface area, pore volume and pore diameter of the prepared catalysts are summarized
in Table 2. As seen, the BET surface area of Z-xBr samples decreased with increasing the amount of TPABr in zeolites, while the pore volume and pore diameter of the samples increased.
In order to understand the distribution of the surface acidity and the strength of the acid sites, a systematic
study of NH3-TPD measurements was performed. The
NH3-TPD profiles of H-ZSM-5 samples are shown in Figure 3. The results of ammonia TPD-titration that contain the amount of desorbed ammonia and acidity content of the prepared catalysts are summarized in Table 3. As shown in Figure 3, There are three desorption peaks in TPD profiles of catalysts with maxima in the range of 70–240, 240–430 and 430– 800°C, which can be ascribed to the NH3 desorbed
from acid sites with low, medium and high strengths, respectively. The results showed that the total acidity of the catalysts decreased with increases in the TPABr molar ratio. Many researchers have reported that strong acid sites are responsible for the formation of hydrocarbons and acid sites of weak or intermediate strength are responsible for the selective formation of DME [22, 27]. Among the prepared catalysts, Z-0Br had the highest number of weak acid sites, followed by Z-5Br and Z-10Br. Therefore, it was expected that the Z-0Br has the highest methanol conversion and DME selectivity;but Z-5Br and Z-10Br havesimilar performance toZ-0Br.
Figure4 shows the SEM micrographs of the Z-xBrsamples synthesized in different concentrations of TPABr after calcinations. Our SEM study revealed that the particles present in
the prepared samples have a uniform distribution and their morphologies are regular. The average
particle sizes estimated from the SEM images
Abbasian and Taghizadeh
12
Table 1:Crystal size and molarity of catalysts Catalyst pH* Si/Al TPAOH/SiO
2 TPABr/SiO2 OH-/SiO2 H2O/SiO2 Crystal size (nm)
Z-0Br 11.59 125 0.36 0 0.35 10.8 26.64
Z-5Br 11.48 125 0.34 0.018 0.35 10.8 65.09
Z-10Br 11.47 125 0.32 0.036 0.35 10.8 75.68 Z-15Br 11.41 125 0.30 0.053 0.35 10.8 80.55
*pH values were measured before crystallization
175
increased with increasing TPABr concentration in the synthesis reaction mixture. These results are in good agreement with the XRD results.
3.2. Catalytic performance in the dehydration of methanol
In order to find the difference in the performance of the prepared catalysts in terms of methanol conversion and DME selectivity, all catalyst samples were evaluated for catalyticdehydration of methanol to dimethyl ether under the same and steady-state operating conditions
(300°C, 1 atm and WHSV of 26 h−1) for 3 h in a fixed bed reactor (ID=10 mm, L=920 mm). According to our previous research, the conversion reaches 90% at a
temperature of 300°C and WHSV of 26 h−1. To evaluate the reaction for a condition near the equilibrium, these temperature and WHSV values have been selected [13, 22]. The changes in the yield of DME, methanol conversion and DME selectivity of various catalysts
are listed in Table 4.
Methanol conversion, selectivity and yield of DME were defined as follows:
13
Table 2:Physical properties of samples Catalyst Surface area
(m2/g)
Pore volume x 103
(ml/g)
Pore diameter (nm)
Z-0Br 428.78 403.8 1.90 Z-5Br 420.81 406.8 1.97
Z-10Br 418.27 422.7 2.03
Z-15Br 415.44 421.3 2.18
14
Table 3:Results of NH3-TPD analysis of different H-ZSM-5 catalysts
Catalyst Maximum desorption temperature (°C)
Amount of NH3
(mmol/gcat)
Total acidity (mmol/gdry sample)
Z-0Br
74 343 711
0.294 0.032 0.334
0.66
Z-5Br
72 300 725
0.281 0.015 0.318
0.61
Z-10Br
70 – 700
0.277 – 0.178
0.46
Z-15Br
71 322 735
0.08 0.027 0.093
0.2
176
19
Figure3
15800 16000 16200 16400 16600 16800 17000 17200
0 100 200 300 400 500 600 700 800 900
TCD
Temperature (oC)
Z-0Br
16000 16200 16400 16600 16800 17000 17200
0 100 200 300 400 500 600 700 800 900
T
C
D
Temperature (oC)
Z-5Br
16000 16200 16400 16600 16800 17000 17200
0 100 200 300 400 500 600 700 800 900
TC
D
Temperature (oC)
Z-10Br
15950 16000 16050 16100 16150 16200 16250 16300
0 100 200 300 400 500 600 700 800 900
T
C
D
Temperature (oC)
Z-15Br
20 Figure44
20 Figure44
20 Figure44
20 Figure44
Figure 4: SEM images of samples: a) Z-0Br, b) Z-5Br, c) Z-10Br, d) Z-15Br.
Figure 3: NH3-TPD profiles of synthesized catalysts.
177
The results in Table 4 show that all the catalysts exhibit a very high conversion of methanol. As to the selectivity, no considerable differences were found among the samplesduring catalyst testing, though the DME selectivity over Z-0Br and Z-5Br was slightly higher than others.The maximum yield to DME was about 90% on Z-0Br, although the results showed that the Z-5Br and Z-10Br hada very good and comparable performancewith Z-0Br. These differences are relatedto theirsurface area and weak or intermediate number of acidic sites responsible for the selective formation of DME (Tables 2 and 3).
21 Figure 5 70 75 80 85 90 95
1 6 11 16 21 26 31 36
C onver si on ( m ol e%)
Time on stream (h)
Z-0Br Z-5Br Z-10Br Z-15Br
Figure 5: Variation of methanol conversion of different samples as a function of time on stream at
T = 300°C, P = 1 atm, and WHSV = 26 h−1.
The long-term stability of the prepared catalysts after 36 h of reaction is shown in Figure 5. As it can be seen, all samples are stable and showed excellent stability for the dehydration reaction.
To determine the main product and byproduct, a gaseous calibration mixture including CH4 and C2-C4 olefin/paraffin components was used, which was probably manufactured asthe byproduct of methanol dehydration reaction. In this work, C2H4 and C3H6 were the main byproducts which were slightly produced in DME synthesis because of low temperature. Figure6shows quantity of the main byproducts over different catalysts.
22 Figure6 0 0.2 0.4 0.6 0.8 1 B y-p ro du cts (m ol e% )
Type of catalyst Ethylene
Propylene
Z-0Br Z-5Br Z-10Br Z-15Br
Figure 6: Variation of the main byproduct concentration of different H-ZSM-5 catalysts.
7
Figure4 shows the SEM micrographs of the Z-xBrsamples synthesized in different concentrations of TPABr after calcinations. Our SEM study revealed that the particles present in the prepared samples have a uniform distribution and their morphologies are regular. The average particle sizes estimated from the SEM images increased with increasing TPABr concentration in the synthesis reaction mixture. These results are in good agreement with the XRD results.
Figure 4 near here
3.2. Catalytic performance in the dehydration of methanol
In order to find the difference in the performance of the prepared catalysts in terms of methanol conversion and DME selectivity, all catalyst samples were evaluated for catalyticdehydration of methanol to dimethyl ether under the same and steady-state operating conditions (300°C, 1 atm and WHSV of 26 h−1) for 3 h in a fixed bed reactor (ID=10 mm, L=920 mm). According to our
previous research, the conversion reaches 90% at a temperature of 300°C and WHSV of 26 h−1.
To evaluate the reaction for a condition near the equilibrium, these temperature and WHSV values have been selected [13, 22]. The changes in the yield of DME, methanol conversion and DME selectivity of various catalysts are listed in Table 4.
Methanol conversion, selectivity and yield of DME were defined as follows:
100 amount) (initial moles MeOH amount) (final moles MeOH -amount) (initial moles MeOH conversion
MeOH (2)
100 amount) (final moles MeOH -amount) (initial moles MeOH 2 produced moles
DME
y selectivit
DME (3)
MeOHconversion
DMEselectivity
DMEof
Yield (4)
The results in Table 4 show that all the catalysts exhibit a very high conversion of methanol. As to the selectivity, no considerable differences were found among the samplesduring catalyst testing, though the DME selectivity over Z-0Br and Z-5Br was slightly higher than others.The maximum yield to DME was about 90% on Z-0Br, although the results showed that the Z-5Br and Z-10Br hada very good and comparable performancewith Z-0Br. These differences are relatedto theirsurface area and weak or intermediate number of acidic sites responsible for the selective formation of DME (Tables 2 and 3).
15
Table 4:Catalytic activities of different H-ZSM-5 catalysts Catalyst MeOH conversion
(%)
DME selectivity (%)
DME yeild (%)
Z-0Br 90.92 99.68 90.63
Z-5Br 89.5 99.41 88.97
Z-10Br 87.98 99.12 87.21
Z-15Br 86.7 98.96 85.80
178
4. CONCLUSION
A mixture of two templates of TPAOH and TPABr was used in the synthesis of ZSM-5 nano-zeolite due to the high cost of using templates, especially TPAOH. The effects of TPABr/ TPAOH molar ratios on zeolite crystallization in the synthesis reaction mixture with a molar composition of 0.24Al2O3:60SiO2:(21.4-x)
TPAOH:xTPABr:xNaOH :650H2O were
investigated and H-ZSM-5 nano-zeolites were successfully synthesized by the hydrothermal crystallization method. All prepared H-form zeolites were active and selective for methanol dehydration to DME.
The structure and morphology of the catalysts were studied by X-ray diffraction (XRD) and BET. XRD patterns showed that the extent and percentage of crystallinity of catalysts did not differ significantly and all the catalysts were in nanoscale range.Also, with increasing TPABr concentration in the synthesis reaction mixture, crystal sizes increased. BET results showed that by increasing the amount of TPABr or TPABr/ TPAOH molar ratio in the synthesis reaction
mixture, pore volume and average pore diameters
of the catalysts increased but the surface area decreased.
The NH3-TPD analysis demonstrated that the sample with smaller crystallite size possessed higher concentration of weak and medium acidic sites and consequently a higher catalytic activity. The experimental data indicated that all the catalysts show very high conversion with nearly complete selectivity in methanol dehydration to DME. The addition of up to 10 mole% TPABr to TPAOH in the synthesis reaction mixture does not significantly affect the properties and performance of prepared catalysts; an economic saving in preparation cost can be achieved.
ACKNOWLEDGMENT
This work was financially supported by Iranian Nanotechnology Initiative Council.
REFERENCES
1. S. Sidhu, J. Graham, R. Striebich: Chemosphere,Vol. 42,(2001), pp. 681–690.
2. T. A. Semelsberger, R. L. Borup, H. L. Greene: J. Power Sources,Vol. 156, (2006),pp. 496–511.
3. G. A. Olah, A. Goeppert, G. K. S. Prakash: J. Org. Chem.,Vol. 74, (2009), pp. 487–498.
4. Y. Adachi, M. Komoto, I. Watanabe, Y. Ohno, K. Fujimoto: Fuel,Vol. 79, (2000), pp. 229–234. 5. Z. Gao, W. Huang, L. Yin, K. Xie: Fuel Process.
Technol.,Vol. 90, (2009), pp. 1442–1446.
6. G. Moradi, J. Ahmadpour, F. Yaripour: Energy Fuels,Vol. 22, (2008), pp. 3587–3593.
7. X. D. Peng, G. E. Parris, B. A. Toseland, P. J. Battavio: US Patent, No. 5, 753, 716, (1998).
8. J. H. Kim, M. J. Park, S. J. Kim, O. S. Joo, K. D. Jung: Appl. Catal. A: Gen.,Vol. 264, (2004), pp. 37–41.
9. T. Shikada, K. Fujimoto, Y. Ohno, T. Ogawa, M. Mizuguchi, M. Ono: US Patent No. 5,446,720
(2006).
10. B. Wang, Y. Wen, W. Huang: Energy Sources, Part A,Vol. 35, (2013), pp. 1590–1596.
11. R. J. Argauer, G. R.Landolt: US Patent, No. 3,702,886 (1972).
12. Y. Cheng, L. J. Wang, J. S. Li,Y. C. Yang, X. Y. Sun: Mater. Lett., Vol. 59, (2005), pp. 3427–3430.
13. S. Hosseini, M. Taghizadeh, A. Eliassi: J. Nat. Gas Chem., Vol. 21, (2012), pp. 344–351.
14. M. Firoozi, M. Baghalha, M. Asadi: Catal. Commun., Vol. 10, (2009), pp. 1582–1585.
15. J. Liu, C. X. Zhang, Z. H. Shen, W. M. Hua, Y. Tang, W. Shen, Y. H. Yue, H. L.Xu:Catal. Commun., Vol. 10, (2009), pp. 1506–1509.
16. S. N. Khadzhiev, N. V. Kolesnichenko, N. N. Ezhova: Pet. Chem.,Vol. 48, (2008), pp. 325–
334.
17. R. V. Ermakov, V. A. Plakhotnik: Pet. Chem., Vol. 48, (2008), pp. 1–5.
18. M. Xu, J. H. Lunsford, D. W. Goodman, A. Bhattacharyya: Appl. Catal. A: Gen., Vol. 149, (1997), pp. 289–301.
179
19. J. Fei, Z. Hou, B. Zhu, H. Lou, X. Zheng: Appl.Catal. A: Gen., Vol. 304, (2006), pp. 49–54.
20. S. D. Kim, S. C. Baek, Y. J. Lee, K. W. Jun, M. J. Kim, I. S. Yoo: Appl. Catal. A: Gen., Vol. 309, (2006), pp. 139–143.
21. F. Raoof, M. Taghizadeh, A. Eliassi, F. Yaripour: Fuel, Vol. 87, (2008), pp. 2967–2971.
22. S. Hassanpour, F. Yaripour, M. Taghizadeh: Fuel Process. Technol.,Vol. 91, (2010), pp. 1212–1221.
23. J. C. Védrine, A. Auroux, P. Dejaifve, V. Ducarme, H. Hoser, S. Zhou: J. Catal., Vol. 73, (1982), pp. 147–160.
24. N. Y. Chen, W. E. Garwood: J.Catal.,Vol. 52, (1978), pp. 453–458.
25. V. Valtchev,S. Mintova: Microporous Mesoporous Mater., Vol. 43, (2001), pp. 41–49.
26. Y. Wang,Y. Tang,A. Dong,X. Wang,N. Ren,Z.Gao:J. Mater. Chem., Vol. 12, (2002), pp. 1812–1818.
27. V. Siva Kumar, A. H. Padmasri, C. V. V.
Satyanarayana, I. Ajit Kumar Reddy, B. David Raju,
K. S. Rama Rao:Catal. Commun.,Vol. 7, (2006), pp.
745–751.
28. H. Zhu, Z. Liu, D. Kong, Y. Wang, X. Yuan, Z. Xie: J. Colloid Interface Sci., Vol. 331, (2009), pp. 432–
438.
29. H. Xin, A. Koekkoek, Q. Yang, R. van Santen, C. Li, E.J.M. Hensen: Chem. Commun., Vol. 48, (2009), pp. 7590–7592.
30. F. Meng, Y. Wang, L. Wang, R. Yang, T. Zhang: J. Mol. Catal. A: Chem., Vol. 335, (2011), pp. 105–111.
31. P. Chen, X. S. Chen, K. Tanaka, H. Kita: Chem. Lett., Vol. 36, (2007), pp. 1078–1079.
32. P. Chen, X. B. Chen, X. S. Chen, H. Kita: J. Membr. Sci.,Vol. 330, (2009), pp. 369–378.
33. R. F. Zhou, M. H. Zhu, X. S. Chen, H. Kita: Chem. Lett., Vol. 39, (2010), pp. 388–389.