Original Research Article
Evaluation of nutritional status of children aged 5-14 years
in rural areas of Kanpur
Anju Gahlot, Som Nath*, Pravin K. Sinha
INTRODUCTION
Despite India's 50% increase in GDP since 1991, more than one third of the world's malnourished children live in India.1,2 The World Bank estimates that India is one of the highest ranking countries in the world for the number of children suffering from malnutrition. There were 795 million undernourished people in the world in 2014, a decrease of 216 million since 1990.3 Apart from mid-day meal programme, which is run by the Government of India in government run schools, there are no other efforts for children in age group 5-14 years. A total of
925 million people are undernourished in 2010, an increase of 80 million since 1990. Nearly all of the undernourished are in developing countries.4 Census 2011 has shown that this age 5-14 years group forms a very large proportion of the population. The prevalence of underweight children is 47% in India, is among the highest in the world and is nearly double that of Sub-Saharan Africa with direct consequences for morbidity, mortality, productivity and economic growth.5,6
Based on the age, body weight and height, a number of indices such as height-for-age and weight-for-height have
ABSTRACT
Background: Despite India's 50% increase in GDP since 1991, more than one third of the world's malnourished children live in India. The prevalence of underweight children in India is among the highest in the world. In this endeavor, we have under-taken empirical research to evaluate the nutritional status of children aged 5-14 years and to improve nutritional status of children living in rural areas of Kanpur.
Methods: This is a cross sectional study conducted amongst children aged 5-14 years in rural area of Kanpur. Children were examined clinically and height and weight were measured following standard procedures. MS Excel and Interactive statistics page were used for analysis of data.
Results: Mean age of subjects (in years) was 10.09±2.57 and 9.43±2.42 of males and females respectively. Prevalence of underweight was 39.4%; underweight female (41.1%) and males (38.1%). Prevalence of stunting was 27.8%; girls 36.8% and males 20.3%. Thinness (BMI for age/sex <-2SD) was found in 26.6% of children. The prevalence of pallor was found in 27.5% subjects with Thinness. This association was found statistically significant (X2=6.250, p=0.001). Dental carries was found in 49 (13.61%) but in subjects with BMI < -2SD (thinness), 23 out of 92 had dental carries. This association was found statistically significant (X2=13.632, p=0.001).
Conclusions: The problem of underweight is still high in rural areas. Total 27.8% children were stunted showing chronic malnutrition. This needs to be tackled through adequate nutrition and health education. Nearly 40 percent of the children were under-weight; an acute condition if not corrected at earlier stage may progress to severe form of malnutrition.
Keywords: Children of age group 5-14 years, Anthropometry, Underweight, Stunting, Thinness Department of Community Medicine, Rama Medical College, Mandhana, Kanpur, Uttar Pradesh, India
Received: 18 March 2019
Accepted: 08 May 2019
*Correspondence:
Dr. Som Nath,
E-mail: [email protected]
Copyright: © the author(s), publisher and licensee Medip Academy. This is an open-access article distributed under the terms of the Creative Commons Attribution Non-Commercial License, which permits unrestricted non-commercial use, distribution, and reproduction in any medium, provided the original work is properly cited.
been suggested.7 The children are classified using three categories: 'underweight' (low weight-for-age), 'stunting' (low height-for-age) or 'wasting' (low weight-for-height). Low anthropometric values are those more than 2 SD away from the CDC 2000 (centers for disease control and prevention) standards India has the highest number of children stunted because of malnutrition (48.2 million) equivalent to Colombia's population, according to Save the Children's 'Stolen Childhoods' report.7-9 31 million of children are part of India's workforce, the highest in the world. These two factors along with the lack of education and early marriage/parenthood pushed India to 116th place among 172 countries assessed for threats to childhood. In this endeavor, we have under-taken empirical research to evaluate the nutritional status of children aged 5-14 years and to improve nutritional status of children living in rural areas of Kanpur.
METHODS
This is an observational, cross sectional study conducted amongst children aged 5-14 years, in field area of RHTC (Rural health training centre, Shivrajpur) of RMCH&RC, Mandhana, Kanpur. Study was conducted for duration of 1 year (December 2017 to December 2018). Sample size has been calculated considering the prevalence obtained for underweight in the study Abid et al, which is 40%.10
N≥
N≥
Approximately 15% more than the minimum sample size required was taken for present study (n=360).
Out of the total 24 villages located within the covered area of RHTC, Shivrajpur, Kanpur, 5 villages (Bairi, Mahipalpur, Munderi, Khathi Niwada, Chakbaka) were selected randomly by using computer generated random number and applying simple randomization method. First house was selected then every third house was visited in sequence and children of age 5-14 years were interviewed till 360 children were achieved. The children/parents who were not willing to give consent or children who were hospitalized or not available at the time of visit were excluded from our study.
A pre-designed and pre-tested semi-structural questionnaire based proforma was set and data was collected. After taking ethical clearance from ethical committee of our institute & consent from parents, the children were examined clinically and by using the standard procedures of Anthropometry, height and weight were recorded.
For assessing the nutritional status, height for age, Weight for age and BMI for age was calculated using new WHO growth reference standards separate for boys
and girls. To assess the dietary intake of the children, a 24 hour recall method of diet survey was adopted. The mother and the respective children were asked to give an account of the quantity of food items consumed. The data were analyzed by applying appropriate statistical tools.
RESULTS
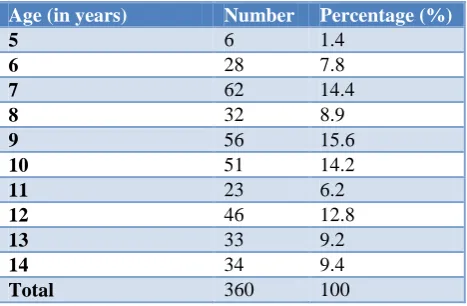
Table 1 shows that maximum numbers of respondents (56/360) 15.6% were aged 9 years and minimum (6/360) 1.4% aged 5 years.
Table 1: Demographic profile of study subjects according to age.
Age (in years) Number Percentage (%)
5 6 1.4
6 28 7.8
7 62 14.4
8 32 8.9
9 56 15.6
10 51 14.2
11 23 6.2
12 46 12.8
13 33 9.2
14 34 9.4
Total 360 100
Table 2: Gender wise distribution of study subject.
Gender Age in years
(Mean±SD) Number
Percentage (%) Male 10.09±2.57 197 54.7
Female 9.43±2.42 163 45.3
Age and gender wise distribution of respondent’s shows that 54.7% (197/360) were males and 45.3% (163/360) were females. There was no significant difference in mean age of subject. Mean age of subjects (in years) was 10.09±2.57 and 9.43±2.42 of males and females respectively (Table 2).
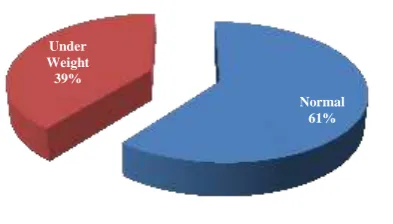
Table 3 shows 60.6% (218/360) subjects had normal weight for age remaining 39.4% (142/360) were underweight. Maximum 67.9% had normal weight for age and remaining 32.1% were underweight among 6 years age children and among 8 years children, minimum 46.9% subjects had normal weight and remaining 53.1%were found underweight.
Among total 142 underweight children, higher percentage of females was found to be under weight (41.1%), according to weight for age criteria than males (38.1%). But this difference is statistically not significant (p=0.7).
Table 3: Distribution of study subjects according to weight for age.
Age (in years)
Weight for age
Total N (%) Normal
N (%)
Under weight N (%)
5 3 (60.0) 2 (40.0) 5 (100.0)
6 19 (67.9) 9 (32.1) 28 (100.0)
7 29 (55.8) 23 (44.2) 52 (100.0)
8 15 (46.9) 17 (53.1) 32 (100.0)
9 36 (64.3) 20 (35.7) 56 (100.0)
10 32 (62.7) 19 (37.3) 51 (100.0)
11 13 (56.5) 10 (43.5) 23 (100.0)
12 30 (65.2) 16 (34.8) 46 (100.0)
13 19 (57.6) 14 (42.4) 33 (100.0)
14 22 (64.7) 12 (35.3) 34 (100.0)
Total 218 (60.6) 142 (39.4) 360 (100.0)
Table 4: Weight for age and genders among study subjects.
Weight for Age Weight in Kg.
(Mean±SD )
Gender
Total
Male Female
N (%) N (%) N (%)
Normal weight 29.4±10.6 122 (61.9) 96 (58.9) 218(60.6)
Under weight 19.2±4.9 75 (38.1) 67 (41.1) 142 (39.4)*
Total 197(100.0%) 163 (100.0) 360 (100.0)
*Z=0.37; p=0.7.
Table 5: Prevalence of stunting according to height for age among children aged (5-14 years).
Age (in years) Height for age(cm) Total
Normal height (±2SD) Stunting (<-2SD)
N (%) N (%) N (%)
5 4 (80.0) 1 (20.0) 5 (100.0)
6 15 (53.6) 13 (46.4) 28 (100.0)
7 27 (51.9) 25 (48.1) 52 (100.0)
8 15 (46.9) 17 (53.1) 32 (100.0)
9 33 (58.9) 23 (41.1) 56 (100.0)
10 40 (78.4) 11 (21.6) 51(100.0)
11 22 (95.7) 1 (4.3) 23 (100.0)
12 41 (89.1) 5 (10.9) 46 (100.0)
13 31 (93.9) 2 (6.1) 33 (100.0)
14 32 (94.1) 2 (5.9) 34 (100.0)
Total 260 (72.2) 100 (27.8) 360 (100.0)
*Height for age Boys/Girls (WHO 2007 reference)
Figure 1: Prevalence of under weight.
Table 5 shows 72.2% (260/360) subjects had normal height for age remaining (100/360) 27.8% were stunted out of 360. Maximum 95.7% had normal height for age and remaining 4.3% were stunted among 23 children of 11 years age and among 32 subjects of 8 years, minimum 46.9% subjects had normal weight and remaining 53.1%were found stunted.
Height for age was found normal in 260 (72.2%) with mean height for age (131±18.04) and remaining 100
(27.8%) subjects with mean height for age
(121.45±12.55) were stunted, out of total 360 study subjects. Among 100 subjects with stunted for age, 40 (20.3%) were boys and 60 (36.8%) were girls (Table 6). Normal
61% Under
Table 6: Height for Age and genders among study subjects mean.
Height for age* Height in cm.
Mean±SD
Gender
Male Female
N (%) N (%)
Normal HT (±2SD) 131.00±18.041 157 (79.7) 103 (63.2)
Stunting (<-2SD) 121.45±12.552 40 (20.3) 60 (36.8)
Total 197 (100.0) 163 (100.0)
Figure 2: Prevalence of stunting.
Table 7: Body mass index (BMI) of children aged (5-14 years).
Age (in years)
Nutritional status (BMI* for age)
Normal±2SD BMI (-2SD) (Thinness)
N (%) N (%)
5 3 (60.0) 2 (40.0)
6 21 (75.0) 7 (25.0)
7 35 (67.3) 17 (32.7)
8 17 (53.1) 15 (46.9)
9 39 (69.6) 17 (30.4)
10 35 (68.6) 16 (31.4)
11 16 (69.6) 7 (30.4)
12 37 (80.4) 9 (19.6)
13 31 (93.9) 2 (6.1)
14 34 (100.0) 0 (0.0)
Total 268 (74.4) 92 (25.6)
BMI* for age Boys/Girls (WHO 2007 reference).
Results shows that total 268 (74.4%) subjects had normal BMI for age/sex (±2SD) remaining 92 (26.6%) were found their BMI for age/sex <-2SD out of 360 subjects.
Among 33 subjects of age 13 years, maximum 93.9% had normal BMI for age/sex (±2SD) and remaining 6.1% were of BMI<-2SD and among 32 subjects of age 8 years, minimum 46.9% subjects had normal weight and remaining 53.1% were found BMI <-2SD (Table 7).
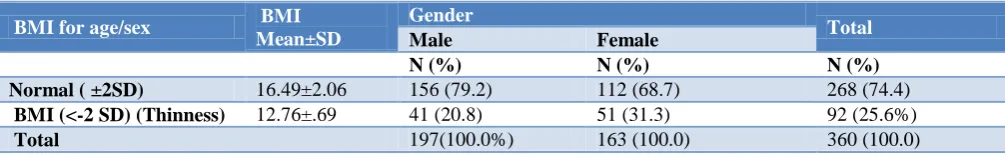
BMI for age/sex with BMI <-2SD (thinness) (92 subjects), only 41 (20.8%) were boys and remaining 51 (31.3%) were girls.
Results shows that 268 subjects had mean BMI 16.49±2.06 with normal nutritional status and remaining 92 had mean BMI 12.76±.69 were showing thinness (Table 8).
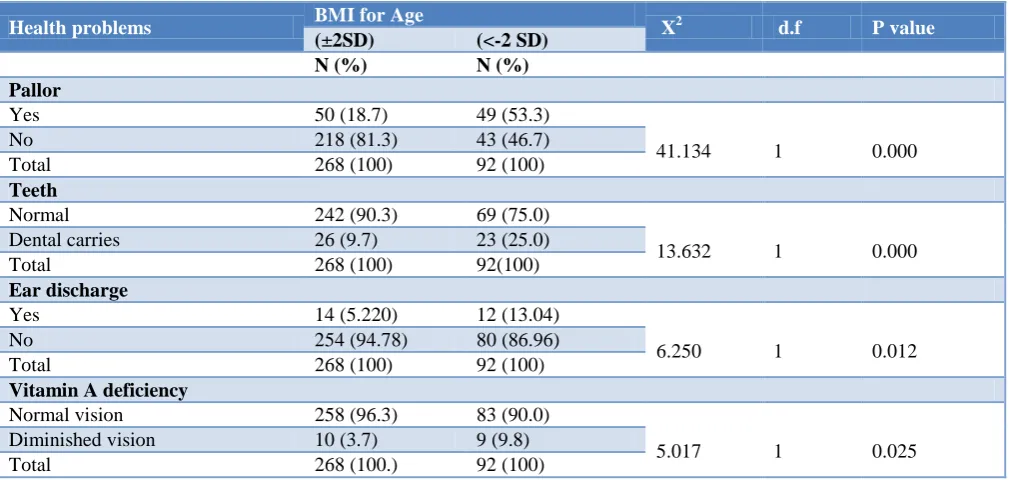
Present study shows that overall prevalence of pallor was found 99 (27.5%) out of total 360 subjects with BMI ±2SD, 50 out of 260 had pallor and subjects with BMI <-2SD, 49 out of 92 subjects had pallor. This association between pallor among study subjects and their nutritional status was found statistically significant (X2=6.250, p=0.000).
Table 9 shows that overall prevalence of dental carries was found 49 (13.61%) out of total 360, subjects with BMI±2SD 26 had dental carries and subjects with BMI <-2SD, 23 out of 92 subjects had dental carries. This association between dental carries among study subjects and their nutritional status was found statistically significant (X2=13.632, p=0.000).
Present study depicts the overall prevalence of Ear discharge was 26 (7.22%) in total 360 subjects. 14 out of 268 subjects with BMI±2SD had Ear discharge and subjects with BMI <-2SD, 12 out of 92 had Ear discharge. This association between Ear discharge among study subjects and their nutritional status was found statistically significant (X2=6.250, p=0.012).
Table 8: BMI for age and genders among study subjects.
BMI for age/sex BMI
Mean±SD
Gender
Total
Male Female
N (%) N (%) N (%)
Normal ( ±2SD) 16.49±2.06 156 (79.2) 112 (68.7) 268 (74.4)
BMI (<-2 SD) (Thinness) 12.76±.69 41 (20.8) 51 (31.3) 92 (25.6%)
Total 197(100.0%) 163 (100.0) 360 (100.0)
Normal (±2SD) 72% Stunting (<
Table 9: Health problems and nutritional status of study subjects according to BMI forage/sex.
Health problems BMI for Age X2 d.f P value
(±2SD) (<-2 SD)
N (%) N (%)
Pallor
Yes 50 (18.7) 49 (53.3)
41.134 1 0.000
No 218 (81.3) 43 (46.7)
Total 268 (100) 92 (100)
Teeth
Normal 242 (90.3) 69 (75.0)
13.632 1 0.000
Dental carries 26 (9.7) 23 (25.0)
Total 268 (100) 92(100)
Ear discharge
Yes 14 (5.220) 12 (13.04)
6.250 1 0.012
No 254 (94.78) 80 (86.96)
Total 268 (100) 92 (100)
Vitamin A deficiency
Normal vision 258 (96.3) 83 (90.0)
5.017 1 0.025
Diminished vision 10 (3.7) 9 (9.8)
Total 268 (100.) 92 (100)
Above table shows that overall prevalence of Night blindness was found 19 (5.27%) out of total 360 subjects. 10 out of 268 BMI±2SD had diminished vision in night and 9 out of 92 subjects with BMI <-2SD had diminished vision in night. This association between diminished vision among study subjects and their nutritional status was found statistically significant (X2=5.017, p=0.025).
DISCUSSION
Present study shows majority of study children 15.6% were aged 9 years and minimum 1.4% aged 5 years. Age and gender wise distribution of study subjects shows that 54.7% were males and 45.3% were females. Mean age of subjects was 10.09 yrs ±2.57 and 9.43 yrs ±2.42 of males and females respectively Sharma et al study in Rural Areas of Moradabad were also found similar results in their study 149 (50.50%) were boys and 146 (49.5%) were girl participants.11 The mean height and weight of girls was found to be lower than boys (Table 1 and 2).
Prevalence of underweight was 39.4% out of 360 (100%). Higher percentages of females (41.1%) were found to be under weight than males (38.1%). But this difference is statistically not significant (p=0.7) (Table 3 and 4, Figure 1). Tiwari et al conducted a study on health profile of primary school children study from a rural health block of Kanpur were also found similar results.12 Proportion of underweight was found higher in case of girls (33.3%) as compared to boys (26.2%).
Total 27.8% (100/360) subjects were found to be stunted in my study and out of this 40 (20.3%) were boys and only 60 (36.8%) were girls. (Table 5 and 6, Figure 2) Mondal et al conducted a study on Nutritional Status of Children in Rural Govt. Primary School, district
Khammam, Andhra Pradesh, India.13 Similar results were found among boys, stunting and severe stunting were 17.9% and 2% respectively. While among girls, stunting and severe stunting were 20.1% and 6% respectively. Girls (20.1%) were more stunted than boys (17.9%).
5 years thinness was less among females but above 5 years as age thinness was observed more among females.
The overall prevalence of pallor was found 99 (27.5%) out of total 360 subjects, and with BMI±2SD 50 had pallor and subjects with BMI <-2SD, 49 subjects had pallor. This association between pallor among study subjects and their nutritional status was found statistically significant (X2=6.250, p=0.000). Almost similar results were found by Prakash et al in their study on nutritional status of rural school going children (6-12 years) of Mandya district, Karnataka.16 Iron deficiency anemia is the most common nutritional deficiency which affects health, education, economy, and productivity of the entire nation. In their study, out of 484, pallor was noted in 123 (25.4%) children of this 59 were boys and 64 were girls.
Prevalence of dental carries was found in 49 (13.6%) out of total 360 subjects, and with BMI ±2SD, 26 had dental carries and with BMI <-2SD, 23 out of 92 subjects had dental carries. This association between dental carries among study subjects and their nutritional status was found statistically significant (X2=13.632, p=0.000). Almost similar results were found by Tiwari et al conducted a study on health profile of primary school children: study from a rural health block of Kanpur found that overall 25.7% children were affected by dental caries.12
The prevalence of Ear discharge was found 26 (7.22%) out of total 360 subjects. 14 out of 268 subjects with BMI ±2SD had Ear discharge and subjects with BMI <-2SD, 12 out of 92 had Ear discharge. This association between Ear discharge among study subjects and their nutritional status was found statistically significant (X2=6.250, p=0.012). Almost similar results were found by Asghar et al.10 Conducted a study on Health status of primary school children: study from a rural health block of Lucknow, found that ear discharge was noticed in 10% and was more common in girls (13.63%).
The prevalence of night blindness was found in 19 (5.27%) out of total 360 subjects. 10 out of 268 subjects with BMI±2SD, had diminished vision in night and 9 out of 92 subjects with BMI <-2SD, had diminished vision in night. This association between diminished vision among study subjects and their nutritional status was found statistically significant (X2=5.017, p=0.025) (Table 9). Almost similar results were found by Asghar et al conducted a study on health status of primary school children in a rural health block of Lucknow, found vitamin A deficiency in 4.70%; results are almost similar to our study.10
CONCLUSION
The children of age group 5-14 years period is nutritionally significant. Malnutrition has serious long term consequences for the child and adversely influences development of a nation. The problem of underweight is
still high in rural areas of Kanpur, in spite of a robust mid-day meal scheme and regular school health services in the state. Results shows that total 27.8% children were stunted as they were suffering from chronic malnutrition. This needs to be tackled through adequate nutrition and health education. Nearly 40 percent of the children were under-weight; an acute condition if not corrected at earlier stage may progress to severe form of malnutrition.
Recommendations
Health and nutritional education should be given to the children and their parents and should be made as a part of school curriculum apart from regular education activities. Regular health and nutritional assessment of the children for early detection and treatment should be stressed at ground level. School based nutritional screening programmes should be implemented and regularly monitored. There is role of I E C (information education and communication) like role playing, mass media, poster, folk media etc. and community participation, involvement of NGOs and other sectors in improving health status of children. Regular monitoring of growth of children and health education session for the mothers is going to be effective in prevention of malnutrition among the children.
Limitations of the study
Even though, this study provided important information regarding the nutritional health status of the children aged 5-14 years of rural community. It is required to assess some of the factors that influence health extension service utilization among communities, social desirability and recall bias among study participants were the drawback of this study.
ACKNOWLEDGEMENTS
We the authors wish to thank to all Staff of RHTC and Health Workers and ASHA of our study areas of Shivrajpur, Kanpur to undertake this research. In addition, we the authors like to express our gratitude to the medical social workers, supervisors and study participants.
Funding: No funding sources Conflict of interest: None declared
Ethical approval: The study was approved by the Institutional Ethics Committee of Rama Medical College and Research Centre, Mandhana, Kanpur
REFERENCES
1. The Indian exception". The Economist. 2011. 2. UNICEF. The Children. Available at: http://www.
unicef.org/india/children_2356.htm. Accessed on 2 October 2010.
Agriculture Organization of the United Nations, Economic and Social Development Department, 2015.
4. FAO. World Hunger and Poverty Facts and
Statistics 2010. Available at: http://www.fao.org/ publications/sofi/en. Accessed on 22 September 2010.
5. "World Bank Report". The World Bank. World Bank Report on Malnutrition in India, 2009. 6. Gragnolati M, Shekar M, Gupta MD, Bredenkamp
C, Lee YK. India’s Undernourished Children: A Call for Reform and Action: What are the dimensions of the undernutrition (Nutrition) problem in India? The World Bank; 2005: 6. 7. Waterlow IC, Buzina R, Keller W, Lane IM,
Nichaman MZ, Tanner IM. The presentation and use of height and weight data for comparing the nutritional status of groups of children under the age
of 10 years. Bull World Health Organ.
1977;55:489–98.
8. Kuczmarski RJ, Ogden CL, Guo SS, Grummer-Strawn LM, Flegal KM, Mei Z, et al. 2000 CDC Growth Charts for the United States: methods and development. Vital Health Stat. 2002;11(246):1– 190.
9. WHO Expert Committee on Physical Status.
Physical status: the use and interpretation of anthropometry, report of a WHO expert committee. Geneva, World Health Organization. 1995. (WHO Technical Report Series, No. 854; Available at: http://whqlibdoc.who.int/trs/WHO_TRS_854.pdf, Accessed on 20 May 2011.
10. Asghar SA, Gupta P, Srivastava MR, Srivastava JP, Zaidi ZH. Health status of primary school children:
study from a rural health block of Lucknow. Int J Community Med Public Health. 2017;4(7):2498-501.
11. Sharma M, Watode B, Srivastava A. Nutritional Status of Primary School Children through Anthropometric Assessment in Rural Areas of Moradabad. Ann Int Med Dent Res. 2016;3(2):1-5. 12. Tiwari HC, Gahlot A, Mishra R. Health profile of
Primary School Children: study from a rural health block of Kanpur. J Evol Med Dent Sci. 2013;2(36):6941-45.
13. Mondal R, Biswas T, Ravi Kumar BP, Arlappa N, Chatterjee C, Majumder A Nutritional Status of Rural Govt. Primary School Children in Khammam
District, Andhra Pradesh, India. IJMDS.
2015;4(2):818-27.
14. Best C, Neufinger N, Gee L, Briel T, Osendarp S. The nutritional status of school-aged children: Why
should we care? Food Nutr Bulletin.
2010;31(3):400-17.
15. Pandit IM, Ahmad SN, Khan S, Haq IU. Nutritional status of school age children (5-14 years) in a rural health block. Int J Current Res. 2015;7(2):12500-2. 16. Shivaprakash NC, Joseph RB. Nutritional Status of
Rural School Going Children (6 12 Years) of Mandya District, Karnataka. Int J Sci Study. 2014;2(2):39-43.