Original Research Article
Assessment of glycaemic control in patients with type 2 diabetes:
a clinic-based study in a slum of Kolkata
Tania Pan, Aparajita Dasgupta, Sweta Suman*, Bobby Paul,
Rajarshi Banerjee, Jayeeta Burman
INTRODUCTION
Diabetes is one of the largest global health challenges of the century. The prevalence of diabetes is rapidly increasing all over the world, thus posing severe economic burden to the patients and to the society at large. According to the International Diabetes Federation, it is estimated that globally 415 million people live with diabetes in 2015 and is predicted to increase to 642 million by 2040.1 More than 80% of diabetics live in low
and middle-income countries. India has the second largest burden of individuals with diabetes in the world–an estimate of 69.2 million people with diabetes.1
National Family Health Survey 4 reports that around 12.9% of male and 8.7% of females in urban West Bengal have high blood sugar level (>140 mg/dl),which is higher than the overall national figure of 8.8% for men and 6.9% for women in urban India.2,3 This increasing incidence is mainly attributed to population growth,
ABSTRACT
Background: Although diabetes is a chronic condition, it can be controlled and managed to prevent complications. Long-standing diabetes with poor glycaemic control leads to many complications. This study aims to assess the glycaemic control status and its associated factors among type 2 diabetes patients attending Urban Health Centre in a slum of Kolkata, West Bengal.
Methods: A clinic-based cross-sectional study was conducted among 184 diabetic patients attending clinic at Urban Health Centre, Chetla from October-December 2017.Each respondent was interviewed using a structured schedule to collect data on sociodemographic characteristics, physical activity, disease profile and self-care activities. Height and weight were measured. Individuals with PPBS ≥160 mg/dl were said to have poor glycaemic control.Data entry and analysis was done using SPSS version 16.0.
Results: Out of 184 participants, 37.5% had poor glycaemic control. Mean (±SD) age of the participants was 51.64 (9.64) years. Median duration of diabetes was 4 years. 104 (56.5%) had overweight/ obesity. Only 26.6% had satisfactory dietary practice. Test results revealed ≥4 years duration of diabetes, overweight/ obesity, smoking, unsatisfactory diet and non-adherence to medications as significant predictors of poor glycaemic control, explaining 31.6% of the variance of glycaemic control with non-significant Hosmer–Lemeshow statistics.
Conclusions: The study has identified factors associated with poor glycaemic control among the study participants. Emphasis on promoting a healthy lifestyle which includes a healthful eating plan, cessation of smoking, maintaining optimum body weight and strictly adhering of prescribed medications would go a long way in maintaining good glycaemic control.
Keywords: Glycaemic control, Type 2 diabetes, Self-care activities, Urban slum Department ofPSM, AIIHPH, Kolkata, West Bengal, India
Received: 12 June 2018
Accepted: 10 September 2018
*Correspondence:
Dr. Sweta Suman,
E-mail: [email protected]
Copyright: © the author(s), publisher and licensee Medip Academy. This is an open-access article distributed under the terms of the Creative Commons Attribution Non-Commercial License, which permits unrestricted non-commercial use, distribution, and reproduction in any medium, provided the original work is properly cited.
aging, urbanization, and increasing prevalence of obesity and physical inactivity.
Although diabetes is a chronic condition, it can be controlled and managed to prevent complications. Long-standing diabetes with poor glycaemic control leads to complications like diabetic neuropathy, nephropathy, retinopathy, and diabetic foot ulcer. In view of the chronic and progressive nature of the disease, interventions in terms of adherence to medication, routine self-care practices and risk-reduction behaviours have the potential to optimize the glycaemic control.
Diabetes in India is becoming common among people belonging to lower socioeconomic groups living in urban regions of the more developed states.4 In a developing country like India, where resources are limited and out-of-pocket expenditure is high, to achieve and maintain good glycaemic control among the diabetics, specially among the urban poor, is a challenge.
With this background, this study was conducted to assess the glycaemic control status and its associated factors among type 2 diabetes patients attending urban health centre in a slum of Kolkata, West Bengal.
METHODS
This study was a cross-sectional clinic based observational study conducted from October to December 2017 in urban health centre, of a slum of Kolkata. This health centre caters to more than one lakh population of Kolkata out of which 35.4% comprises of slum population. All the patients with diagnosed type 2 diabetes mellitus for more than six months who came to the non-communicable disease clinic (NCD clinic) during the study period were approached and all those who gave written informed consent was included in the study. A total of 184 patients could be interviewed in the study period.
Each respondent was interviewed with the help of structured pre-designed pre-tested schedule consisting of four parts; sociodemographic characteristics, physical activity, disease profile and self-care activities.
For disease profile, respondents were asked about the duration of disease, family history of diabetes and present history of hypertension.
Self-care activities were assessed using summary diabetes self-care activities questionnaire developed by Toobert et al after making minor changes to suit the food commonly consumed in Indian context and venous blood glucose monitoring was referred to instead of daily blood glucose monitoring.5 Face validity and content validity of the instrument was ascertained by experts of the institution.
Individuals with average score of questions (i, ii) ≥5 and average score of questions (iii, iv) ≤1 were classified as
satisfactory dietary practice, response to question (v) as ≥5 was classified as satisfactory exercise practice, with yes response to questions (vi, vii, and viii) were classified as satisfactory drug intake, blood monitoring, and foot care activities, respectively, while with no response to questions (ix) was classified as satisfactory smoking practice.6
Height and weight were measured following standard operating procedures. Individuals with body mass index (BMI) ≥25 kg/m2
were reported as overweight/ obese.7 Individuals with PPBS ≥160 mg/dl were classified as having poor glycaemic control.8
The data entry and analysis were performed using statistical software SPSS (IBM SPSS Statistics for Windows, Version 16.0). Descriptive statistics (mean ± standard deviation SD and median for the continuous variables and frequency in percentage for the categorical variables) were used to describe the demographic, disease-related characteristics and self-care activities of the participants. Univariate and multivariable logistic regression was used to determine the factors related with poor glycaemic control. Results were considered significant at p<0.05 level.
Ethical approval was obtained from the Institutional Ethics Committee. At the end of data collection, advice was given about measures to maintain good glycemic control and also the treatment for the patients with poor glycemic control
RESULTS
Out of 184 participants, 87 (47.3%) belonged to the 40-49 age group, and 102 (55.4%) were female. Mean (SD) age of the participants was 51.64 (9.64) years. 163 (88.6%) were Hindu and 165 (89.7%) were currently married. 97 (52.7%) lived in joint families, while 83 (45.1%) were educated up to primary.
Mean (SD) per capita income was 2691 (1039) INR and 94 (51.1%) belonged to middle class (according to Modified B. G. Prasad scale January 2017). A total of 85 (46.2%) were hypertensives and 77 (41.8%) had a family history of diabetes. Mean (±SD) duration of diabetes was 6.5 (±3) years and median duration was 4 years. Also, 104 (56.5%) were overweight/ obese.
Although 63 (34.3%) followed a healthy eating plan and 56 (30.4%) ate more than 5 serving of fruits and vegetables for more than 4 days in the past week (Table 1), only 49 (26.6%) had satisfactory dietary practice. Overall, 69 (37.5%) had poor glycaemic control.
From Table 2, it was evident education up to primary, low SES, ≥4 years duration of diabetes, presence of
hypertension, overweight/ obesity, smoking,
to medications were significantly associated with poor glycaemic control.
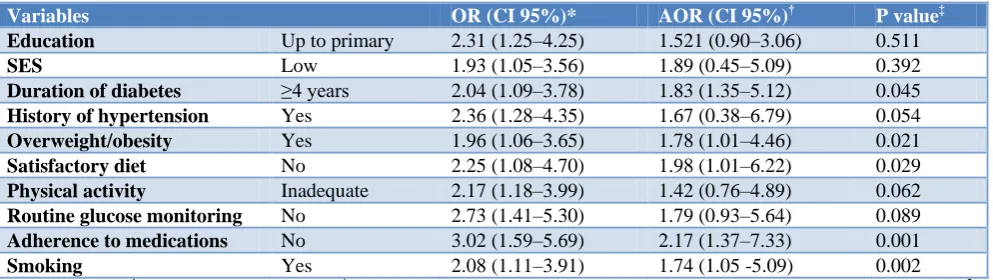
After adjusting for all the independent variables, only ≥4 years duration of diabetes, overweight/ obesity, smoking,
unsatisfactory diet and non-adherence to medications were significant predictors of poor glycaemic control (Table 3). The final model explained 31.6% of the variance of glycaemic control with non-significant Hosmer–Lemeshow statistics.
Table 1: Distribution of the study participants according to their self-care activities (N=184).
Questions N (%)
1. During the past 7 days, how many days have you followed a healthful eating plan?
0-4 days 121 (65.7)
5-7 days 63 (34.3)
2. During the past 7 days, how many days did you eat 5 or more servings of fruits and vegetables?
0-4 days 128 (69.6)
5-7 days 56 (30.4)
3. During the past 7 days, how many days did you eat high fat food such as red meat or full-fat dairy product?
0-1 day 105 (57.1)
>1 days 79 (42.9)
4. During the past 7 days, how many days did you eat sweets?
0-1 day 152 (82.6)
>1 days 32 (17.4)
5. During the past 7 days, how many days did you do physical activity for at least 30 minutes (total minutes of continuous activity, including walking)?
0-4 days 94 (51.1)
5-7 days 90 (48.9)
6. In the past 3 months, did you test your blood glucose level?
Yes 133 (72.3)
No 51 (27.7)
7. Do you take your prescribed medications daily?
Yes 94 (51.1)
No 90 (48.9)
8. Do you dry your toes after washing daily?
Yes 81 (44.0)
No 90 (56.0)
9. During the past 7 days, have you smoked a cigarette–even one puff?
Yes 61 (33.2)
No 123 (66.8)
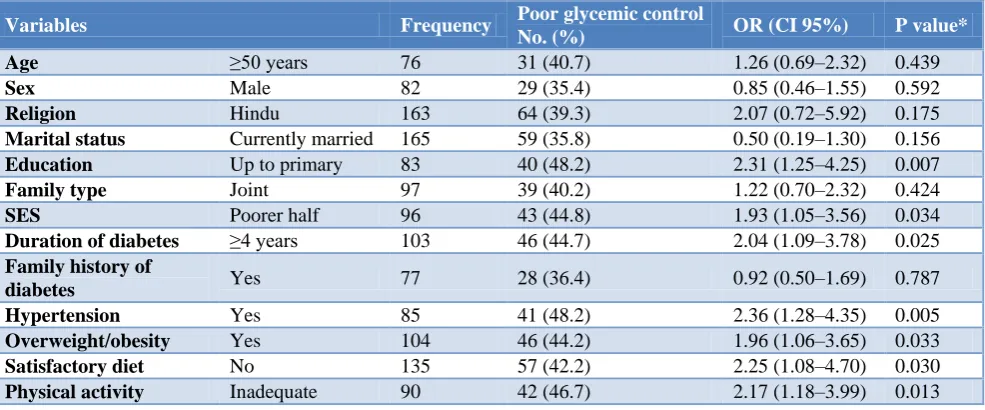
Table 2: Univariate logistic regression between poor glycaemic control and different variables (N=184).
Variables Frequency Poor glycemic control
No. (%) OR (CI 95%) P value*
Age ≥50 years 76 31 (40.7) 1.26 (0.69–2.32) 0.439
Sex Male 82 29 (35.4) 0.85 (0.46–1.55) 0.592
Religion Hindu 163 64 (39.3) 2.07 (0.72–5.92) 0.175
Marital status Currently married 165 59 (35.8) 0.50 (0.19–1.30) 0.156
Education Up to primary 83 40 (48.2) 2.31 (1.25–4.25) 0.007
Family type Joint 97 39 (40.2) 1.22 (0.70–2.32) 0.424
SES Poorer half 96 43 (44.8) 1.93 (1.05–3.56) 0.034
Duration of diabetes ≥4 years 103 46 (44.7) 2.04 (1.09–3.78) 0.025
Family history of
diabetes Yes 77 28 (36.4) 0.92 (0.50–1.69) 0.787
Hypertension Yes 85 41 (48.2) 2.36 (1.28–4.35) 0.005
Overweight/obesity Yes 104 46 (44.2) 1.96 (1.06–3.65) 0.033
Satisfactory diet No 135 57 (42.2) 2.25 (1.08–4.70) 0.030
Physical activity Inadequate 90 42 (46.7) 2.17 (1.18–3.99) 0.013
Variables Frequency Poor glycemic control
No. (%) OR (CI 95%) P value*
Routine glucose
monitoring No 51 28 (54.9) 2.73 (1.41–5.30) 0.003
Adherence to
medications No 62 34 (54.8) 3.02 (1.59–5.69) <0.001
Foot care No 103 41 (39.8) 1.25 (0.68–2.29) 0.467
Smoking Yes 61 30 (49.2) 2.08 (1.11–3.91) 0.022
*P value less than 0.05 was considered statistically significant.
Table 3: Multivariable logistic regression between poor glycaemic control and explanatory variables (N=184).
Variables OR (CI 95%)* AOR (CI 95%)† P value‡
Education Up to primary 2.31 (1.25–4.25) 1.521 (0.90–3.06) 0.511
SES Low 1.93 (1.05–3.56) 1.89 (0.45–5.09) 0.392
Duration of diabetes ≥4 years 2.04 (1.09–3.78) 1.83 (1.35–5.12) 0.045
History of hypertension Yes 2.36 (1.28–4.35) 1.67 (0.38–6.79) 0.054
Overweight/obesity Yes 1.96 (1.06–3.65) 1.78 (1.01–4.46) 0.021
Satisfactory diet No 2.25 (1.08–4.70) 1.98 (1.01–6.22) 0.029
Physical activity Inadequate 2.17 (1.18–3.99) 1.42 (0.76–4.89) 0.062
Routine glucose monitoring No 2.73 (1.41–5.30) 1.79 (0.93–5.64) 0.089
Adherence to medications No 3.02 (1.59–5.69) 2.17 (1.37–7.33) 0.001
Smoking Yes 2.08 (1.11–3.91) 1.74 (1.05 -5.09) 0.002
*OR–Odd’s ratio; †AOR–Adjusted odd’s ratio; ‡P value less than 0.05 was considered statistically significant. Value of Nagelkerke R2– 0.316.
DISCUSSION
Our study found that 37.5% of the diabetic patients had poor glycaemic control. This is lower than 63.0% as reported by a study in South India in 2017.9 It is also lower than 68.9% as reported in ICMR-INDIAB (Phase I) study in 4 states in 2014, and 78.6% as reported by a study in South India in 2012.10,11 Other studies also quote higher figures of poor glycaemic control.12-14 This may be attributed to the fact that in the previous studies glycaemic control was assessed using HbA1C. Also, high
prevalence of iron deficiency anaemia in India may falsely increase HbA1C levels.15
This study found that individuals with longer duration of diabetes had 1.83 times higher odds of having poor glycaemic control. Patients with longer duration of disease may gradually develop pathological changes in other parameter such as blood cholesterol etc. which may further impede optimum glycaemic control.
In our study, 33.2% were smokers and had 1.74 times higher odds of having poor glycaemic control. Smoking apparently affects through its association with insulin resistance, inflammation and dyslipidaemia.16 Overweight/obesity also has a strong role in resultant insulin resistance and thus increasing plasma glucose level.17
A balance diet plan is the cornerstone to maintain optimum blood sugar levels. The dietary pattern emphasizes a consumption of fat primarily from foods high in unsaturated fatty acids, and encourages daily
consumption of fruits, vegetables, low fat dairy products and whole grains, low consumption of fish, poultry, tree nuts, legumes, very less consumption of red meat.18-20
We have found 33.4% of diabetics were not adherent to regular medication. This may be due to many reasons - the poor economic conditions of the participants, who were either ignorant about the gravity of the disease or the inadequate availability of medicines at nearby health centres.
Good glycaemic control is a must for the diabetic patients to lead a good quality of life and prevent further complications. Emphasis must be given on promoting a healthy lifestyle which includes a healthful eating plan, cessation of smoking, maintaining optimum body weight and strictly adhering of prescribed medications.
Our study had the following strengths–components of self-care practices were assessed and a simple inexpensive test of PPBS was used to assess glycaemic control. It had limitations owing to small sample size and convenient sampling. Also, from our study, temporal association could not be established. Further community-based research including parameters like HbA1C to assess
glycaemic control with help identify the predictors with more generalizability.
ACKNOWLEDGEMENTS
we adapted the summary of diabetes self-care activities measure, we acknowledge Toobert DJ and colleagues.
Funding: No funding sources Conflict of interest: None declared
Ethical approval: The study was approved by the Institutional Ethics Committee
REFERENCES
1. International Diabetes Federation. IDF diabetes atlas, seventh edition. Brussels, Belgium: International Diabetes Federation 2015.
2. National Family Health Survey (NFHS-4): West Bengal Fact Sheet. Ministry of Health and Family Welfare 2015-2016.
3. National Family Health Survey (NFHS-4): India Fact Sheet. Ministry of Health and Family Welfare 2015-2016.
4. Anjana RM, Pradeepa R, Deepa M, Datta M, Sudha V, Unnikrishnan R, et al. ICMR–INDIAB Collaborative Study Group Prevalence of diabetes and prediabetes (impaired fasting glucose and/or impaired glucose tolerance) in urban and rural India: phase I results of the Indian Council of Medical Research-India Diabetes (ICMR-INDIAB) study. Diabetologia. 2011;54:3022-7.
5. Toobert DJ, Hampson SE, Glasgow RE. The summary of diabetes self-care activities measure: Results from 7 studies and a revised scale. Diabetes Care. 2000;23(7):943-50.
6. Garg S, Paul B, Dasgupta A, Maharana SP. Assessment of self-care activities: A study among type 2 diabetic patients in a rural area of West
Bengal. Int J Med Sci Public Health
2017;6(7):1173-8.
7. WHO/IASO/ITO. Asia Pacific Perspective
Redefining Obesity and its Treatment, WHO Western Pacific Region; 2000. Available at:
http://www.cadiresearch.org/topic/obesity/global-obesity/obesity-overview. Accessed on 30
December 2017.
8. Ministry of Health and Family Welfare Government of India. National Program for Prevention and Control of Cancers, Diabetes, Cardiovascular Diseases and Stroke. Training Module for Medical Officers for Prevention, Control and Population Level Screening of Hypertension, Diabetes and Common Cancer (Oral, Breast and Cervical); 2017: 17.
9. De P, Banu S, Muthukumar D. Predictors of poor glycemic control in type 2 diabetic patients in South
Indian population. Int J Res Med Sci. 2018;6:545-50.
10. Unnikrishnan R, Anjana RM, Deepa M, Pradeepa R, Joshi SR, Bhansali A, et al. Glycemic Control Among Individuals with Self-Reported Diabetes in
India—The ICMR–INDIAB Study. Diabetes
Technology Therap. 2014;16(9):596-603.
11. Gopinath B, Sri Sai Prasad M, Jayarama N, Prabhakara K. Study of factors associated with poor glycaemic control in Type-2 Diabetic patients. GJMEDPH. 2013;2(2).
12. Raithatha SJ, Shankar SU, Dinesh K. Self-care practices among diabetic patients in Anand district of Gujarat. ISRN Family Med. 2014;2014:743-91. 13. Sasi ST, Kodali M, Burra KC, Muppala BS, Gutta
P, Bethanbhatla MK. Self-care activities, diabetic distress and other factors which affected the glycaemic control in a tertiary care teaching hospital in South India. J Clin Diagn Res. 2013;7(5):857-60. 14. Sekhar TV, Shabana S, Bhargav SY. Gender: Does
it have role has a role in glycaemic control and diabetic distress in Type 2 diabetes? IOSR J Dent Med Sci. 2013;4(6):48-51.
15. Unnikrishnan R, Mohan V. Challenges in
Estimation of Glycated Hemoglobin in India. Diabetes Tech Therap. 2013;15(10):897-9.
16. Sang Ah Chang. Smoking and Type 2 Diabetes Mellitus. Diabetes Metab J. 2012;36(6):399–403. 17. Olga T. Hardy, Michael P. Czech, Silvia Corvera.
What causes the insulin resistance underlying obesity? Curr Opin Endocrinol Diabetes Obes. 2012;19(2):81–7.
18. American Diabetes Association. Standards of medical care in diabetes-2010. Diabetes Care. 2010;33(1):11–61.
19. American Diabetes Association: Evidence-based nutrition principles and recommendations for the treatment and prevention of diabetes and related complications (Position Statement) Diabetes Care. 2003;26(1):51–61.
20. Barnard ND, Scialli AR, Turner-McGrievy G, Lanou AJ, Glass J. The effects of a low fat, plant-based dietary intervention on body weight, metabolism, and insulin sensitivity. Am J Med. 2005;118:991–7.