Volume 12, Issue 12 (December 2016), PP.01-08
Agriculture Intelligence’ Performance Enhancement Through
Implementation of Preprocessing Techniques
Tejaskumar Ghadiyali
1, Kalpesh Lad
2 1Uccc & Spbcba & Uaccait,Udhna, Surat, Gujarat – India
2Srimca, Uka Tarsadia University, Bardoli, Surat, Gujarat – India
Abstract:-
To help the crucial, economically contributing sector agriculture, in India, the authors have developed an „Agriculture Intelligence‟ system. This system basically aims to generate the Agri-business knowledge at the right place and at the right time to increase the farmer‟s agriculture business knowledge and thereby enhance the profitability. Available web-portals and services are still not able to generate the farm/farmer centric strategic information. In this context, at the time of developing agriculture intelligence system, the authors found plenty of inconsistence and misleading data in the agriculture sector which needs to be preprocessed and transformed. In this paper the authors propose several data preprocessing techniques which preprocess agriculture data for agriculture intelligence system to enhance the data quality of outcomes and thereby performance for knowledge generation.Keywords:-
Agriculture Intelligence, Preprocessing, Agriculture Data Quality, Agriculture Intelligence, Agriculture Preprocessing techniques.I.
INTRODUCTION
Agriculture is the dominant sector of the Indian economy. It accounts for about 19% of GDP [1]. This sector contributes close to a quarter of India‟s National Income, and the work force engaged in agriculture is about 60% [2]. About 43% of India‟s geographical area is used for agricultural activity [3]. About 70% of the population lives in rural areas and majority of them depend upon agriculture as their primary source of income [2]. By considering the importance of agriculture sector in the economic development of India, the authors have developed an Agriculture Intelligence system.
Agriculture Intelligence was coined by Ghadiyali et al.[4] and it is an emerging trend that provides proper solution to the farmer communities in the area of the agriculture business. Basically the final information in the form of knowledge gets transformed towards the farmer communities and on the basis of the generated knowledge; the farmer can take decisions regarding the trading of a particular agriculture product. The authors have defined Agriculture Intelligence as “Agriculture Intelligence is neither a product nor a system. It is an architecture, which is a collection of integrated operational as well as decision-support components, technologies and Databases that provide the agriculture community easy access to agriculture knowledge”[4].
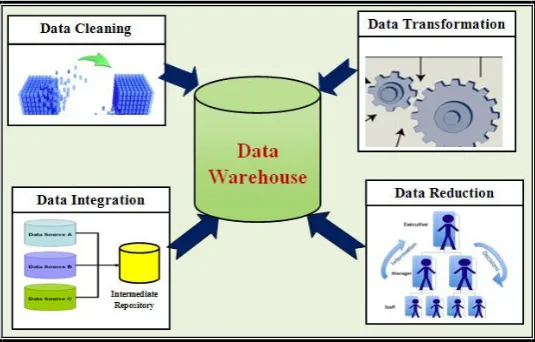
At the time of developing agriculture intelligence system the authors found several issues related to it [5]. Data quality is one of them. As the entire generated knowledge is based on the intelligence process and intelligence process is ultimately based on the quality of the input / gathered data, improving quality of input / gathered data is quite important in this architecture. Qualitative data [6] in terms of accuracy, completeness, consistency, believability and interpretability is intended for the knowledge generation process in the agriculture intelligence. Such data can be availed using the preprocessing on the dirty data available from the heterogeneous resources. So this paper aims at using necessary preprocessing techniques to improve data quality and thereby helping to improve the accuracy and efficiency and thereby performance of the subsequent knowledge generation process in agriculture intelligence. Major steps involved in preprocessing are data cleaning, data integration, data reduction and data transformation [5]. In agriculture intelligence all steps of preprocessing can be involved by the intention to get fine, clean (error free) and useful data for further knowledge generation process.
The following sections show the various available data preprocessing techniques as literature review. The subsequent section describes the applicability of such data preprocessing techniques in the Agriculture Intelligence System. A conclusion has been offered at the end of the paper.
II.
DATA PREPROCESSING TECHNIQUES
attributes from data file. Data Transformation requires to scale the data into uniform scale. These techniques are not mutually exclusive; they may work together and overlap each another as and when required.
Data Cleaning is required when we have the „missing values‟, „noisy data‟ and „inconsistent data‟ of agriculture sector. To deal with such problematic data there are several data cleaning approaches shown in the literature [7]. „Missing Value‟ of agriculture sector may be generated due to reason(s) like Data may not be entered due to some misunderstanding or Data may not be considered important at the time of data entry or the equipment through which data entered into system may not be active enough to feed the right data at right time (e.g. in agriculture sector sensor can be used to feed the level of micronutrients of the soil which may not be active enough to feed the right data at right time). Such missing data can be handled using approaches like „Ignore the tupple‟, „Fill in manually‟, „Use global constant‟, „Use central tendency (mean or median)‟ or „Use the most probable value‟. Noise is a random error or variance in a measure variable. „Noisy Data‟ can be handled using the smoothing approaches like „Binning‟, „Regression‟ and „Outlier analysis‟. „Inconsistent data‟ may be generated due to poor data entry form with many optional fields, human error in data entry and instrument error. To handle such discrepancy, error made at data entry may be corrected by applying some validation rule and known functional dependencies can be used to find the value contradiction.
For data cleaning besides the above stated approaches, several other hybrid approaches are also used. E.g. Potter‟s Wheel [8], a complete data cleaning system which shows the data cleaning strategies which allows users to gradually build a transformation to clean the data by adding transforms as discrepancies are detected. Another approach is the Heuristic approach used by Ming Hua et.al[9]. In this approach they developed an effective and efficient method to identify the frequently used disguise values which capture the major body of the disguised missing data. Lately, the Department of Agricultural, Food and Resource Economics Michigan State University suggests the data cleaning guidance using SPSS and Stata[10]. A data cleaning workshop [11] was basically conducted to get started on data cleaning exercise.
Data Integration is the merging of data from multiple sources is known as data integration. As per ARF [12] data integration can be defined as “A formal process to combine information from two or more
separate data sources, making use of information in the databases for the purpose of accurately estimating certain values that are not available in any single data source.” In Agriculture sector as the data exists on heterogeneous sources this type of preprocessing requires to get the finished, good data as the output for the further knowledge management task. Careful integration can help reduce and avoid redundancies and inconsistencies in the resulting data set. This can improve the speed and accuracy of the subsequent knowledge management process in agriculture intelligence. In Agriculture Intelligence the environment semantic heterogeneity and the structure of data pose great challenges in data integration. Matching of schema and data object from other sources can be handled using the „Entity Identification Problem‟. Attributes correlation can be maintained by the „Correlation Test (for nominal and numeric data – chi-square test)‟. Other approaches include „Tuple duplication‟ which resolves the duplicate tuple, „Detection and resolution of conflict data‟ which resolves the conflict value problem in the relation and „ETL‟ which basically performs the Extract, Transform and Loading operation. „Data Profiling is an analysis of the candidate data sources for a data warehouse to clarify the structure, content, relationships and derivation rules of the data‟[13]. Elvira Schäfer et.al. use DB-Prism for
data integration in the distributed financial and controlling management[14]. DB-Prism is an integrated data warehouse system developed for distributed financial and management controlling (data collection, processing, and reporting) at Deutsche Bank.
Some of the important aspects of data integration process in the agriculture sector are explained by L.Kabat et.al.[15]. According to them the integration of agriculture data can be broadly classified into three major groups i. Integration of socio-economic data collected in statistical enquiries, (e.g. GDP, Price, food availability), ii. Integration of socio-economic data collected in statistical inquiries with the information collected from administrative sources and iii. Integration of physical and monetary data (e.g. satellite accounts). Administrative data integration was introduced by Michel Trant et.al.[16] for the agriculture sector with survey and census data. There are several other readymade tools available for the purpose of data integration task. E.g. SAS Enterprise - ETL Server [17], Monarch Data Pump[18] and ENVI[19].
by Ranjana Agarwal et.al [23] with the aim to apply such techniques in the agriculture sector to aggregate the information contained in the large data sets into manageable (smaller) information nuggets.
The main aim of Data Transformation is to consolidate the data sets so that the resulting further knowledge management process such as agriculture intelligence may be more efficient, and the pattern found may be easier to understand. Available data transformation strategies are Smoothing (binning, regression and clustering), Aggregation (summary applied to the data set), Normalization (scale to smaller range), Attribute construction (new attribute added to data set also known as feature construction), Discretization (numeric data converted into nominal data) and Generalization (Concept hierarchy generation for nominal data).In the domain of data transformation task, J.Han et.al. proposed the automatic hierarchy generation from categorical data [24]. Other data transformation tools are also available. E.g. data transform tool- Informatica [25], ArcGIS[26] and Data Wrangler[27].
On the base of literature review authors found out that in context of agriculture data, the main challenge is to choose the methodology to extract data and to integrate them from heterogeneous data sources like agriculture market, agriculture web service and agriculture mandis (agriculture societies). In the agriculture domain, data is bulky, so there are many challenges to preprocess data in this domain. Some common challenges are:
Missing value in the source data
Multiple naming standards from different source data
Multiple data types
Inconsistent values
No default value
Multiple character sets and
Incompatible structures
To deal with such challenges, the authors have applied different approaches in the form of Merge-Purge as mentioned in the next section.
III.
PREPROCESSING IN AGRICULTURE INTELLIGENCE
To collect data from various heterogeneous resources, the researcher downloaded commodity wise agriculture market price data from APMC portal [28]. Downloaded agriculture market price data from January 2004 to December 2014 was used as training data and from January 2015 to December 2015 data was used as testing data in the entire study. Such downloaded data was available in web page form and the researcher converted it into its equivalent comma separated value (.CSV) file and then into database table using spread sheet application software for further analyses. Likewise, meteorological data [29, 30] and fiscal data [28] were also converted for further analyses.
Fig. 1- Data Preprocessing Techniques in Agriculture Intelligence
A. Data Cleaning
The researcher found „noisy data‟ in APMC database as shown in following Figure 14. This figures shows „missing data‟ in the form of NR (Not Reporting) for agriculture commodity „arrival quantity‟ (in tones). For recovery of missing data the researcher used „Periodical Attribute Mean‟ approach for the period of last two weeks data.
Fig-2 Missing Data observation from APMC Database
In the same database, the researcher also found different price data for same agriculture commodity with different variety. In that case, the researcher used Binning Approach to smooth the price data for respective agriculture commodity. „Binning‟ method is smoothing a sorted data value by consulting the neighborhood or values around it.
Data which has value beyond the pre-defined lower or upper boundary (outlier) for respective attribute can be treated as Inconsistent Data. In APMC database, due to data entry error, there are some records whose value is too high or too low. To resolve this problem, data was arranged in descending order of price. Then by monitoring the upper major and lower minor dataset, the researcher found that not more than 2% of the entire data set has very higher value or very low value. So 2% was set as the data boundary defined percentage and beyond (upper or lower) data was treated as outlier and removed from the data set to justify the real APMC data.
B. Data Integration
Data Integration is the merging of data from multiple heterogeneous resources in well defined and required form. The system retrieved heterogeneous data such as Arrival and Market Price from APMC web service as well as Temperature, Rainfall and Humidity from IMD. Merging of all these data date-wise is the most crucial and essential task for further analysis. Selected attributes for in line information are arrival date of agriculture commodity (Arrival Date), Average arrival quantity for that agriculture commodity (Arrival), average Humidity on that date (Humidity), average precipitation on that date (Rainfall), average temperature on that date (Temperature) and average modal price for that agriculture commodity for that date (Modal_Price). Such inline data were used for further data analysis for every selected agriculture commodity.
C. Data Transformation
Data Transformation is the technique through which the data are transformed into forms appropriate for knowledge management process. Data transformation is possible in different ways such as Normalization, Attribute Construction, Aggregation, Attribute subset selection, Discretization and Generalization. In
Normalization the attribute data are scaled so as to fall within a small specified range, such as -1.0 to 1.0 or 0.0 to 1.0. Attribute Construction is a process of new attribute construction and addition from the given set of attributes to help further analyses. Aggregation operation refers to summarization of single attribute multiple tupples. This process helps in reducing workspace and thereby process time in execution. Discretization refers to dividing the range of continuous attributes into intervals. For example in this study, the researcher discretized the continuous attribute Arrival Date into „Seasonal Date‟ and Seasonal data into „Month Date‟. In
De-duplication‟ in APMC database. De-duplication is a process of removing duplicates and non-necessary data
from the datasets. In the absence of „Modal Price‟ in APMC database, attribute construction was done by averaging two attributes „Minimum Price‟ and „Maximum Price‟ for that record. This process not only saves the storage space but also saves the calculation time at the time of analysis of data.
D. Data Reduction
Data Reduction is useful to obtain a reduced representation of the data set that is much smaller in volume but still maintains the integrity of the original data set. Out of the given attributes in market price data file, the researcher selected required attribute by experiments conducted in WEKA [31]. This feature selection experiments was conducted using two different approaches. i) Attribute Selection using CfsSubsetEval algorithm with BestFirst search algorithm which gives the attribute selection as the attribute number and name with the total number of selected attributes and ii) Attribute Selection using InfoGainAttributeEval algorithm and Ranker search method which gives rank to all the attributes of the relation. “CfsSubsetEval” evaluates the worth of a subset of attributes by considering the individual predictive ability of each feature along with the degree of redundancy between them. Here the search method selected is Bestfirst which searches the space of attribute subsets with a backtracking facility. InfoGainAttributeEval algorithm with Ranker Search, ranks all the attributes as per their importance need to be recorded i.e. if the importance of the attribute is higher the rank is earlier. So the higher rank attributes have the lower importance at the time of the classification process
Correlation based Feature Subset selection Evaluator is the process of identifying and removing as much irrelevant and redundant data as far as possible. This reduces the dimensionality of the data and allows learning algorithms to operate faster and more effectively. Here, the search method used is Best First Search. Detail algorithm for „Best First Search‟ of Mark A. Hall is mentioned in [32].
Information Gain Attribute Evaluator [31] evaluates the worth of an attribute by measuring the information gain with respect to the class. Here, the researcher used search method as „Rank Search‟. Rank Search uses an attribute/subset evaluator to rank all attributes. If a subset evaluator is specified, then a forward selection search is used to generate a ranked list. From the ranked list of attributes, subsets of increasing size are evaluated, ie. The best attribute, the best attribute plus the next best attribute, etc.
In this study, the researcher reduced a multiple variant of the same agriculture commodity into a single variant of agriculture commodity for that specific date. This process thus helps to prevent the unwanted complexity of the sub-variant and multiple data of a single agriculture commodity for that date. The researchers have applied „Attribute Ranked using Principal Component Analysis‟ approach in WEKA[31] and based on its experiment result, selected three top most ranked meteorological parameters „Temperature‟, „Humidity‟ and „Rainfall‟. After that, rests of attributes were removed from the meteorological database which reduced the overall size of that database. Such preprocessed qualitative data then load in to data warehouse component of Agriculture Intelligent for future purpose.
IV.
CONCLUSIONS
In this paper the authors have proposed several data preprocessing techniques as a survey. The authors have also shown implementation of such techniques in the agriculture intelligence system to enhance its performance. Such preprocessed qualitative data contributes huge and indirectly helps farmer community in their agri-business decision making through gaining better knowledge from agriculture intelligence. As the selection of the data quality encompass techniques heavily depend on the nature of the dirty data, the authors do not claim any exclusive technique for the Agriculture Intelligence system, and rather show the hybrid approach or the applicability of the particular technique in the appropriate application of the agriculture intelligence system as and when required.
[1].
REFERENCES
[2]. Golait, Current Issues in Agriculture Credit in India: An Assessment, Reserve Bank of India Occasional Papers, Vol.28, Issue No.1, pp. 1-2, 2007.
[3]. Twelfth five year plan (2012-2017): Planning Commission, Govt. of India, Vol.2 (1), pp.1-50.
[4]. Planning Commission Govt. of India, “Eleventh Five Year Plan 2007–12”, Agriculture, Rural development, Industry, Service and physical infrastructure, Vol. III.
[5]. Ghadiyali, Tejas; Lad, Kalpesh and Patel, Bankim, “Agriculture Intelligence: An emerging tool for farmer community”, Proceedings of Second International Conference on “Emerging Application of Information Technology” EAIT 2011.18–20 Feb, Kolkata. 2011 IEEE DOI 10.1108\9/EAIT 2011.36, Vol.2 pp 313-316.
[7]. R.Wang, V.Storey, and C.Firth. „A Framework for analysis of data quality research. IEEE Trans. Knowledge and Data Engineering‟ Vol.7 pp 623-640, 1995
[8]. MichelineKamber et.al. “Data Preprocessing” of 3rd Edition “Data Mining Concept and Techniques”, Published by Morgan Kaufmann, An imprint of Elsevier, 2012 by Elsevier. Original ISBN: 978-0-12-381479-1 pp 83-124.
[9]. V.Raman and J.M. Hellerstein. “Potter‟s wheel: An Interactive data cleaning system.” In proceedings of 2001 International Conference Very Large Database (VLDB‟01), Rome, Italy,Sept.2001, pp.381-390
[10]. M Hua and J. Pei. “Cleaning disguised missing data: A heuristic approach”. In Proc. 2007 ACM SIGKDD International Conference Knowledge Discovery and Data Mining (KDD'07), San Jose, CA, Aug. 2007
[11]. Department of Agriculture, Food and Resource Economics, Michigan State University. “Data Cleaning Guidelines (SPSS and Stata) 1st Edition, January 2012.
[12]. FARA (Forum for Agriculture Research in Africa) , “Data Cleaning Workshop of the Kano-Katsina-Maradi Pilot Learning Site (KKM PLS) of the Sub-Saharan Africa Challenge Programme (SSA CP )”, 10-12 February 2009 IITA Kano Station Nigeria.
[13]. William A. Cook, Denman Maroney and Gabe Samuels Staff ARF, “ARF Guideline for Data Integration” Approved by ARF Board, New York, November 2003.
[14]. Ralph Kimball et al. (2008), “The Data Warehouse Lifecycle Toolkit”, Second Edition, Wiley Publishing, Inc., ISBN 9780470149775], (p. 297) (p. 376)
[15]. Elvira Schäfer, Jan-Dirk Becker and Matthias Jarke, “DB-Prism: Integrated Data Warehouses and Knowledge Networks for Bank Controlling” Proceedings of the 26th International Conference on Very Large Databases, Cairo, Egypt, 2000
[16]. L. Kabat, L. Naiken and P. Narain,”Data integration and its role in the development of better agriculture and food information systems”, International Conference on Establishment Surveys – II, „Integrating Agriculture and Food Statistics: National and International Perspectives‟
[17]. Trant, M and Whitridge, P: - Integration of administrative data with survey and census data, Proceedings of Agricultural Statistics, 2000: An intenternational conference on agricultural statistics, Washington, D.C., 1998.
[18]. Data Extraction and Integration Methods in Medium and Large Databases-SAS data warehousing unit white paper, 2000.
[19]. Tis, Laurie L., PhD, AT,C and Perrin, David H., PhD, AT,C Tis, L.L. and Perrin, D.H, “Validity of Data Extraction and Integration Techniques on the Kinetic Communicator (KinCom) Isokinetic Device” (1993).
[20]. http://www.exelisvis.com/ENVI.aspx An extraction & Integration tool developed by Exelis Visual Information Solutions. Visited on 12th January 2013 at 4.30 p.m.
[21]. Ramona Geargesc et.al. “Comparison of Data Reduction Techniques Based on the Performance of SVM-type Classifier”.
[22]. M. Dash and H. Liu. Feature selection methods for classification. Intelligent Data Analysis, ELSEVIER, 1:131–156, 1997.
[23]. R. Kohavi and G. H. John. „Wrappers for feature subset selection.‟ Artificial Intelligence, ELSEVIER, 97:273–324, 1997.
[24]. Ranjana Agarwal and A.S.Rao, “Data Reduction Techniques”, A Reseach Report from Indian Agricultural Statistics Research Institute (IASRI).
[25]. J. Han and Y. Fu. Dynamic generation and refinement of concept hierarchies for knowledge discovery in databases. In Proc. AAAI'94 Workshop on Knowledge Discovery in Databases (KDD'94), pp 157– 168, Seattle, WA, July 1994.
[26]. http://www.talend.com/products-master-datamanagement 12th Jan- 2013 at 5.30 p.m. [27]. Maplex® for ArcGIS®, An ESRI ® White Paper, May 2009, www.esri.com.
[28]. http://vis.stanford.edu/wrangler/visited on 13 January 2016 6.00 p.m. [29]. www.agmarknet.nic.in, visit on 1st September 2016 at 4.00 p.m.
[30]. Meteorological Department, Government of India, www.imd.gov.in visit on 28th August 2016 at 6.30 p.m.
[31]. Weather and Meteorological data Portal, www.tutimpo.in visit on 28th August 2016 at 7.15 p.m [32]. WEKA (www.cs.waikato.ac.nz/ml/weka/)