e-ISSN: 2278-7461, p-ISSN: 2319-6491
Volume 6, Issue 12 [December. 2017] PP: 01-18
Geophysical Prospecting By Geoelectric Method In The Ras Jerry
Meknes Region (Morocco)
Hmad Bouikbane
1, Hassane Sahbi
1, Omar El Fassi Fehri
2.
(1)
Laboratory of Geoengineering and Environment, Department of Geology, Faculty of Science, Meknes.
(2)
Direction of Equipment Meknes.
Abstract:
The study area is located at the western boundary of the Sais basin, where groundwater resourcesare limited, the substratum is close to the ground and sometimes it is flush with the absence of the ground water, with high productivity. In this study, the deep aquifer corresponds to liasic limestones and dolomites are absent, due to geological complexity. The main source of this area is most often limited in surface formations of the Plio-Quaternary, and sometimes quartzite intercalations in Paleozoic schists, sandstones, sand and conglomerates forming low-productivity aquifers water. The purpose of this work and geophysics by geoelectric method (52 VES and 03 electrics train) is to identify certain characteristics of aquifers and aquicludes in the Ras Jerry region of the Meknes plateau, all the levels likely to be hydraulic reservoirs.
The direction of flow is generally SE-NW in the direction of the faults or fractures.
Key words:
substratum, groundwater, liasic limestones, geoelectric, underground flow.--- ---Date of Submission: 06-11-2017 ---Date of acceptance: 23-12-2017 ---
---I.
Introduction
In order to obtain a general knowledge about Ras Jerry region from a hydrogeological point of view, a geophysical prospecting study using the geoelectric method was initiated. Its main objective is to monitor in depth the continuity of the various aquifers existing in the study area.
Thus, and in order to achieve this objective, we have set ourselves the following important points:
The geometry and depth of the superficial aquifers corresponds to the Plio-Quaternary and deep of the lias if there is or Paleozoic ;
The geometry and depth of the aquitard which corresponds to marls of Miocene or Triassic red clays ; Areas favorable to the implantation of reconnaissance boreholes.
II.
General Data Of The Study Area
II-1-GEOGRAPHICALFRAMEWORKOFTHESTUDYAREA
The center of Ras Jerry is located in the north-central area of the country, about 23 km southeast of the city of Meknes. It is crossed by the regional road n ° 701 which connects the city of Meknès with the municipality of Ras Jerry. The average Lambert coordinates are as follows: X = 470.000m; Y = 353.700m; Z = 605m.
The study area shown on the map (Figure 1) is located in the western end of the basin of Saiss.
II-2-CONTEXTE GEOLOGIQUE ET HYDROGEOLOGIQUE
Geologically, the study area is part of the western basin of Sais; which belongs to a transition zone between the central Meseta and the Pre Rif. It is characterized by the absence of outcrops, with the exception of the borders: Outcrops of schistose formations, in the banks of the valley of oued ouchket.
Outcrops of marly and calcareous formations, respectively in the valleys of Larbaa Wadi and Wadi Jerry.
According to the geological map of Morocco at 1 / 100,000 (North Meknes) supported by the observations of the cuttings facies of the boreholes made in the region, the geological formations present in the study area are generally from bottom to top as following :
a- Primary schists, which are omnipresent throughout the region, are encountered in the form of gray or black schists with zones of alteration of 10 to 20 m and fracturing little developed. These formations can be aquifer in the case of alteration or intense fracturing. They then give rise to very localized aquifers. The mobilized flows are generally low with points up to 3 l / s. The quality of the water is generally good.
b- The Moi-pliocene formations consist mainly of sandstones, consolidated sands with inlays of yellow marls and often sandy clays. These formations constitute a large part of the post-primary recovery of the province of Khemisset and in particular in the region of Ait Mimoun. Their thickness can sometimes reach one hundred and seventy meters.
The sandstone levels contain a relatively interesting aquifer, but its extent is very limited. Boreholes that have captured these levels can generate drilling flows of up to 20 l/s.
These sandy formations are well developed in the study area. According to the SW-NE geological section, these sandstones plunge north with a dip of 2.5%. To the south-west, they are close to the surface and are surmounted by a sandy formation, relatively permeable. Taking into account the topography of the terrain, it can be concluded that the supply of the groundwater from the stormwater is mainly south of the regional road leading to souk Had in Mimoun.
In the study area, the sandstone levels are not very developed and are rather marly. They are not always productive. Drill holes F6 and F13 in this zone are dry.
On the other hand, in drilling F7, the sandstones are not very productive. They overcome the lacustrine limestones at the coast 180m. The set rests on red clays of the trias. This formation was found nowhere in the parcel of the two domains, which shows that we are in the presence of an abnormal contact between the formations of the Causse d'Agourai and that of the central meseta (Ait Mimoun's aquifer).
On the hydrological level this area would be very complicated. The identification of the aquifer zones can only be done by a careful electrical geophysical study.
c- The Quaternary formations consist mainly of slightly marly yellowish sands. With an average thickness of 25 m, they constitute an aquifer of low potential.
III.
Geoelectric Prospecting
III-1-INTRODUCTION
The geophysical study by the geoelectric method involved several measurements, in particular: 52 vertical electric survey and 03 electric trails.
The electrical survey carried out with the aim of making an overall reconnaissance of the prospected site (Picture 1). This recognition would make it possible to locate potential aquifers likely to be potentially rich in water reserves. The electric trails were performed in order to locate the deep electrical discontinuities materialized essentially by the presence in the site of faults, fractures or cracks. The measurements were placed according to a mesh (Figure 3). The position of the geo-electric measurements was taken by the GPS Meridian in Longitudes / Latitudes coordinates.
III-2- EQUIPMENT
The geoelectric prospecting equipment used includes the following accessories (photo 2) - A resistivity ;
- a current converter;
- two coils of electric wire of a length each of 750m ; - two coils of electric wire of a length each of 100m ; - two steel electrodes for the injection of the electric current ; - two copper electrodes for measuring the potential difference ΔV.
-Photo 2 : Electrical equipment used
III-3-SITUATION OF MEASURES
! A
! A !
A A!
! ! ! ! ! ! ! ! ! ! ! ! ! ! ! ! ! ! ! ! ! ! ! ! ! ! ! ! ! ! ! ! ! ! ! ! ! ! ! ! ! ! ! ! ! ! ! ! ! ! ! ! Oued Larbaa Ras Jerry Route 701
Vers Had ait Mimoum
Via Oulmès F7 F3 F6 F13 TE3 TE2 TE1
TE5 TE4 TE3' TE2'
TE1' S3 S2 S1 4C 3C 2C 1C 9A 8A 7A 6A 5A 4A 3A 2A 1A 9B 8B 7B 6B 5B 4B 3B 2B 1B 17A 16A 15A 14A 13A 12A 11A 10A 17B 16B 15B 14B 13B 12B 11B 10B SEF7 SEF6 464800 464800 465600 465600 466400 466400 467200 467200 350000 350000 351000 351000 352000 352000 353000 353000
±
430 0 430
Légende
! Trainés électriques ! Sondages électriques UN2
Trainé électrique réalisés !
A Forages_de_la_zone Oued Larbaa Route
III-4-RESULTSOFELECTRICTRAINS
In the prospected field, three electric trains were executed. It is:
- Electric train ET1 in the central part of the domain along the road. Its length is 1650m (Figure 3) ; - Electric train ET2 in the north of the domain it’s lenght is 1650m (figure 4)
- Electric train ET3 in the south of study’s area, it’s lenght is 2100m (figure 5).
The profiles obtained by all these trails show that the area studied is very heterogeneous electrically. This testifies to the geological complexity in this region. However, these profiles have made it possible to locate, on approximately 60% of the domain, highly fractured areas very interesting in water resources.
In order to study well the area, and to know the structure of the ground in depth, we will complete our study by the realization of a set of vertical electric survey; their results will be presented later in this work.
0 2 0 0 4 0 0 6 0 0 8 0 0 1 0 0 0 1 2 0 0 1 4 0 0 1 6 0 0 1 8 0 0 - 5 0
0 5 0 1 0 0 1 5 0 2 0 0 2 5 0
D i s t a n c e e n m è t r e s
r
é
s
is
ti
v
it
é
a
p
p
a
r
e
n
te
e
n
o
h
m
.m
E T r a în é é le c t r iq u e T E 1 W
Figure 3: Profile of Electric Train ET 1
0 2 0 0 4 0 0 6 0 0 8 0 0 1 0 0 0 1 2 0 0 1 4 0 0 1 6 0 0 1 8 0 0 - 5 0
0 5 0 1 0 0 1 5 0 2 0 0 2 5 0
W E T r a în é é le c t r iq u e T E 2
r
é
s
is
ti
v
it
é
a
p
p
a
r
e
n
te
e
n
o
h
m
.m
D i s t a n c e e n m è t r e s
0 2 0 0 4 0 0 6 0 0 8 0 0 1 0 0 0 1 2 0 0 1 4 0 0 1 6 0 0 1 8 0 0 -5 0
0 5 0 1 0 0 1 5 0 2 0 0 2 5 0
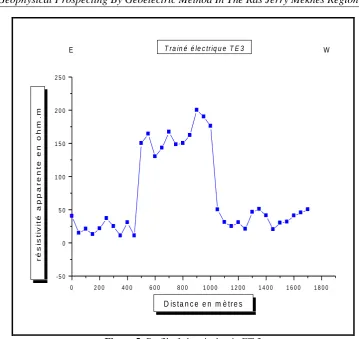
W E T ra in é é le c triq u e T E 3
r
é
s
is
ti
v
it
é
a
p
p
a
r
e
n
te
e
n
o
h
m
.m
D is ta n c e e n m è tr e s
Figure 5: Profil of electrical train ET 3
III-5-MECHANICALDRILLING
The mechanical boreholes that have been carried out in this zone are three-fold, rated F6, F7 and F13, are very useful to complement our geophysical study by calibrating the results obtained by those drillings the results of these drilling make it possible to determine the thicknesses of different formations encountered during drilling, the calibration can provide important information on the variation of the resistivities of the various formations and thus to locate the roof and the substratum of those likely to be water reservoirs. It should be noted that the mechanical drilling used is described in the annex to drilling.
III-6-GEOELECTRICCORRELATION III-6-1- Electric survey of calibration
The electrical surveys of calibrations are carried out in the vicinities of drillings F6; F7 and F13. These soundings has an important role in the interpretation of all survey did in this area.
III-6-1- 1- ELECTRIC SURVEY OF CALIBRATION ESF6
Figure 6: Electrical survey of calibration F6
III-6-1- 2- ELECTRICAL SURVEY OF CALIBRATION ESF7
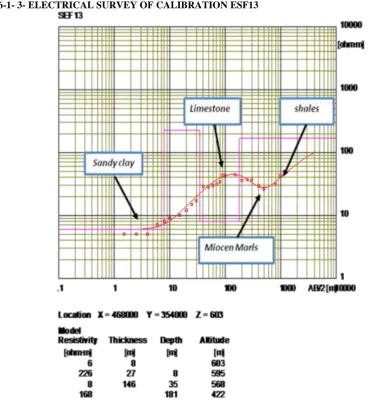
III-6-1- 3- ELECTRICAL SURVEY OF CALIBRATION ESF13
Figure 9: Electrical survey of calibration ESF13
III-7-QUALITATIVEANALYSISOFELECTRICALSURVEYS
The analysis of all the electrical survey carried out in the Ras Jerry region makes it possible to distinguish roughly three electrical levels.
Level I: Superficial resistant Level II: Intermediate conductor Level III: Deep resisant
III-7-1- Superficial resistant level
The surface resistant level corresponds to the first level encountered on the surface and is constituted by an alternation of conductive levels and resistant levels of power ranging from a few meters to a depth of 60 m, their electrical resistivities varying from 5Ω.m to 40Ω.m for the conductor levels, and from 60Ω.m to 220Ω.m for the resistant levels From a geological point of view this level may correspond to Plio-Quaternary formations (topsoil, fawn sands, lake limestones, sandstones, clays, etc.).
III-7-2- Intermediate conductor level
III-7-3- Deep resistant level
The deep resistant level corresponds to the substratum of the Saïs basin, its resistivity is variable, it is generally greater than 100Ω.m.
From a geological point of view, the lias is absent in this region, so the substratum corresponds to Paleozoic schists.
III-8- FAMILIES OF ELECTRICAL SURVEYS
According to the shape of the electric survey curves, three types of families can be distinguished, based on the shape of the curve of the electric survey, and the succession of the various conductive and resistant levels.
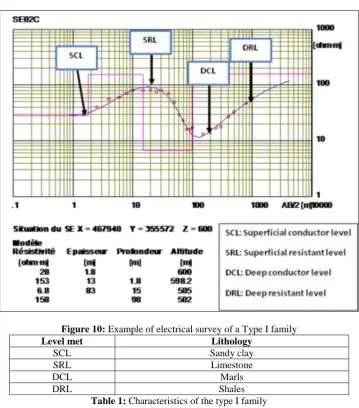
III-8-1- Type I family
The curves of the electric survey of this family show a succession of resistant and conductive level, going from the bottom up (Figure 10). In the table below we give the lithology that corresponds to each level.
Figure 10: Example of electrical survey of a Type I family
Level met Lithology
SCL Sandy clay
SRL Limestone
DCL Marls
DRL Shales
Table 1: Characteristics of the type I family
III-8-2- Type II Family
Figure 11: Example of electrical survey of type II family
III-8-3- Type III family
Figure 12: Example of electrical survey of type III family
III-9- QUALITATIVE INTERPRETATION OF THE RESULTS
The results obtained from the electrical survey, it is possible to establish maps of apparent resistivities. These maps present a significant idea about the variations of the apparent resistivity on a given slice of land.
II-9-1- Map of apparent resistivities for AB / 2 = 50m
The map obtained for AB / 2 = 50m (FIG. 13) corresponds to the superficial Plio-Quaternary age formations, according to the observation of the map, there are mainly two areas:
Conductive areas (ρa <50m): These are the most extensive zones that correspond to surface formations most often clayey, or sandy clays;
467500 468000 468500 469000 469500 354500 355000 355500 30.21 40.52 30.99 61.2 31 30 21 30.12 27.25 35 51.6 41 33 48 50.14 40 70.25 13.54 198.46 200.08 140.26 100.48 130.49 100.67 20 20.76 30.12 18.07 17 15.74 20.14 21.48 22.94 17.49 14.54 17.24 19.25 15.91 F7 F13 F6 10 ohm.m 30 ohm.m 50 ohm.m 70 ohm.m 90 ohm.m 110 ohm.m 130 ohm.m 150 ohm.m 170 ohm.m 190 ohm.m
0 m 500 m
Forage
Figure 13: Map of apparent resistivities for AB/2 = 50m
III-9-2- Map of apparent resisitivities for AB/2 = 500 m
The map of the apparent resistivities for AB / 2 = 500 m gives information rather more deeply, because the more the AB electrodes are moved away towards the depth and the effect of the superficial lands becomes a little negligible, according to the map presented below we can be seen:
Conductive areas (ρa <40Ω.m): it is found that the conductive zones are reduced compared to those of the map seen previously this time the conductive zones eventually correspond to marls formations because we are a bit deep;
Resistive areas (ρa> 60Ω.m): These are more extensive zones that can always be attributed to resistant formations that may probably correspond to Paleozoic shales.
467500 468000 468500 469000 469500
354500 355000 355500 40.32 41.2 40.05 145.26 91.47 86 46.8 30.1 10.4 9.8 40.14 38 39 42 40 50.24 71.45 62.89 62 72.8 39.46 26.18 15.72 28.24 8.56 8.49 9.08 8 8.56 5 5.19 6.71 23.06 6 65.54 60.24 78.25 90.91 F6 F6 F13 0 ohm.m 25 ohm.m 45 ohm.m 65 ohm.m 80 ohm.m 100 ohm.m 120 ohm.m 140 ohm.m
0 m 500 m
Figure 14: map of apparent resistivities for AB/2 = 500 m
III-9-3- Map of apparent resistivities for AB/2 = 1000 m
From the examination of the map shown in the figure below (Figure 15), we can distinguish:
Resistive areas (ρa> 50Ω.m): These zones are distributed in the southern part and also in the northwest end of the study area, the maximum value can reach about 140Ω.m. These strong resistivity values may possibly correspond to shale formations ;
467500 468000 468500 469000 469500 354500 355000 355500 40.32 41.2 40.05 145.26 91.47 86 46.8 30.1 10.4 9.8 40.14 38 39 42 40 50.24 71.45 62.89 62 72.8 39.46 26.18 15.72 28.24 8.56 8.49 9.08 8 8.56 5 5.19 6.71 23.06 6 65.54 60.24 78.25 90.91 F6 F6 F13 0 ohm.m 10 ohm.m 20 ohm.m 30 ohm.m 40 ohm.m 50 ohm.m 60 ohm.m 70 ohm.m 80 ohm.m 90 ohm.m 100 ohm.m 110 ohm.m 120 ohm.m 130 ohm.m 140 ohm.m
0 m 500 m
Figure 15: Map of apparent resistivities for AB/2 = 1000 m
III-10- QUANTITATIVE INTERPRETATION OF THE RESULTS
II-10-1- Map of the transverse resistance (RT) of plio-quaternary formations
The Knowledge of this electrical parameter for a resistant level is very important, by definition TR is the product of the electrical resistivity and the thickness of the formation.
e
RT
V
V : True resistivity of traininge
: Thickness of the formation.In general, a good aquifer is characterized by a high transverse strength but the resistivity must not be too high but a high thickness. In addition, a spatial continuity of the aquifer level must be taken into account.
We chose the Plio-Quaternary level because it is the level that forms the surface aquifer in the Saïs basin, so it sometimes contains permeable and semi-permeable levels.
The transverse resistance map shown below (Figure 16) shows that the areas with high RT values are somewhat smaller and are located west of the F7, and also to the north-west of the F7. drilling F7. On the other hand, the minimum values are more nearly covering the entire study area.
467500 468000 468500 469000 469500
354500 355000 355500 0 ohm.m² 4000 ohm.m² 8000 ohm.m² 12000 ohm.m² 16000 ohm.m² 20000 ohm.m² 24000 ohm.m² 28000 ohm.m² 32000 ohm.m² F7 F13 F6
0 m 500 m
3205.2 3566.5 2764 6230 2822 3568.9 4570 4188.6 2857.2 2905.38 2029 2827.44 6647 4587 4610 3918 5584 2172 26171 37628 26048 18347 22880 14070 3114 4245 4500 1129 2338.4 1262 3075.4 3326 4655 1967 2349 2039.4 858 2326
467500 468000 468500 469000 469500
354500 355000 355500
Figure 16: Map of the transverse resistance (RT) of plio-quaternary formations
III-10-2- Map of the isopachs of the Plio-Quaternary lands
The determination of the thickness of the Plio-Quaternary terrains, based on electrical survey, is based essentially on possible correlations between the calibration survey carried out in the vicinity of the mechanical drilling, the lithological logs of these drilling and the analysis of the electrical horizons.
The examination of the isopach map of the Plio-Quaternary lands presented in Figure 13-III shows that the maximum values are of the order of 130m, are observed in the central part, in the North and in the North West of the zone as well as minimum values can reach up to 20 m thick.
Generally, we note the decrease in the power of the Plio-Quaternary formations going south of the study area. The combination of this map with those of the apparent resistivity for AB / 2 = 50m, and the transverse resistance of the previous Plio-Quaternary terrains (Figure 17), allows us to determine probably aquifer levels.
F6 F6
F13
467500 468000 468500 469000 469500
354500 355000 355500 38 32 36 41 37 38 39 37 31 31 53 53 39 40 40 39 38 16 121 128 104 119 121 118 79 75 68 34 47 37 61 58 67 49 107 98 94 86 20 m 30 m 40 m 50 m 60 m 70 m 80 m 90 m 100 m 110 m 120 m 130 m
0 m 500 m
Figure 17: Map of the isopachs of the Plio-Quaternary lands
III-10-3-Map of deep conductor roof isohypses
The map of the isohypses of the roof of the deep conductor gives an idea of its structure, which could attribute either to miocene marls or triassic clays.
From the map of the isohypses (Figure 18), a gradual deepening can be detected from the central part near the F7 to the entire of the study area. This graduation of the depth is probably did to a set of faults.
467500 468000 468500 469000 469500
354500 355000 355500 578 588 585 564 572 568 572 574 581 580 547 537 566 564 562 553 555 577 585 581 486 472 471 474 513 517 536 570 563 565 535 540 525 534 572 585 579 588 470 m 500 m 530 m 565 m 580 m
0 m 500 m
F7
F13
F6
III-10-4- Deep conductor roof isobaths map
The isobath map shown below (Figure 19) corresponds to the difference between the coast of the electric survey and the coast of the deep conductor roof, and corresponds mostly to Miocene marls.
The analysis of this map shows that the conductive formations become deeper from north to south.
467500 468000 468500 469000 469500
354500 355000 355500
38 32 36 39 37 31 26 53 54 37 46 48 39 40 40 39 38
16 15
16
17 18
22
17 19
20
11 9
17
11 21
18 21
20 17
15 21 18
8 m 16 m 24 m 32 m 40 m 48 m 56 m
0 m 500 m
Figure 19: Map isobath of deep conductor roof
III-11- GEO-ELECTRIC CUTTING
Geo-electric cuts are very important in a geoelectric study because they can give a general view of the geological structure of the prospected area, in order to arrive at a palaeogeographic structure and to fully understand the tectonic affected land. To this goal, we have made two longitudinal geo-electric cuts along the East-West of study area (Figure 20: GCA, Figure 21: GCB), and four geo-electric cuts cross-sections oriented North-South, (GC1, GC2, GC3, GC4)
III-11-1-Longitudinal geo-electric cut LGCA (E-W)
The longitudinal geoelectric cut LGC (FIG. 20) is obtained from the analysis and interpretation of the electric survey, carried out according to the profile A and C.
From this geoelectric cut there is a variation of the thickness of the soil from SE17A; up to SE10A, this variation in thickness is clearly accentuated by the evidence of an abnormal contact (electrical discontinuity) between the survey SE10a and SE7A, which shows that one is on a raised compartment, towards the West we also find ourselves in front of another electrical discontinuity which can eventually materialize through a fault, based on data from the soundings and the lithological log of drilling F7, we note that the marls are absent only in this compartment and they exist elsewhere, indicating that there is probably an abnormal contact.
Towards the west the structure of the land is almost tabular; the thicknesses of the Plio-Quaternary soils are more or less variable, whereas the thickness of the conductive layer corresponds most often to the Miocene marls, and the shallow paleozoic substratum becomes shallower.
III-11-2- Longitudinal geoelectric cut LGCB (E-W)
The longitudinal geoelectric cut (LGCB) shown in Figure 21 shows the same variations in ground thickness as the LGCA cut, going from the west, there is a smaller variation in the thickness of the existing land, thickness of the marly conductor is important, thus unlike the LGCA cut, here the schistous substratum has been reached. The presence of two electrical discontinuities which are visualized at the level of the LGCB cut, these electrical discontinuities always show the presence of a raised compartment,
To the west of the geoelectric cut, the variation of the land is almost the same as that of the LGCA cut, the thickness of the Plio-Quaternary soils is more or less variable along the section, especially towards the western end, for the marly conductor its thickness diminishes towards the west, the presence of schistous substratum is noted which becomes shallower.
Figure 21: Longitudinal geoelectric cut LGCB (E-W)
III-11-3- Cross-sectional geoelectric cut (CGC1) (N-S)
III-11-4- Cross-sectional geoelectric cut (CGC2) (N-S)
The description of this section (fig. 23) is almost the same as CGC1, it always shows the presence of an electrical discontinuity, a small variation in the thickness of the grounds, towards the South of the zone at the level of the sounding SE9B.
Figure 23: Cross-sectional geoelectric cut (CGC2) (N-S)
III-11-5- Cross-sectional geoelectric cut (CGC3) (N-S)
The geoelectric cut CGC3 (fig. 24) shows the same variations of the terrain as CGT2 and CGT1, going from north to south, the presence of two electrical discontinuities which are visualized around the electrical survey SE7A, these two electrical discontinuities make the raising of a compartment, and the lowering of the other. To the north, the electric survey have not reached the roof of the schistous substratum, which can be translated by the thickening of the marly conductor, whereas in the compartment situated towards the south, the schists, even the fractured schists or contain silt elements which are translated by low resistivities. Taking into account the set of these faults which correspond to electrical discontinuities; the thickness of the formations along the section are more or less variable.
III-11-6- Cross-sectional geoelectric cut (CGC4) (N-S)
The appearance of the cut CGC4 (Figure 25) is the same as the previous ones, it shows the abnormal contact between the different geological formations, the presence of the marly conductor in the left compartment and the absence of the schistous substratum at the level of the compartment on the right, their thickness is reduced,
Figure 25: Cross-sectional geoelectric cut (CGC4) (N-S)
IV.
Conclusion
The geoelectric method used in this area has revealed the existence of a superficial aquifer in the Plio-quaternary formations. The geoelectric correlation made from drilling F7, F6 and F13, whose lithostratigraphic logs are known, and also taking into account all the physical parameters measured (electrical resistivity), of various resistivity maps of the transverse resistance of the Plio-Quaternary, the depth (isobaths) of the roof of the marly conductor, and that of the isohypses of the roof of the marly conductor allowed us to deduce: The absence of the liasic resistant;
The aquifer is superficial, it is situated in the Plio-quaternary formations; The substrate is shale ;
The existence of a set of tectonic structures, most often they are faults which have brought into contact land of different lithological nature;
The thickness of the marly conductor is more developed in the eastern part, and is thinner towards the west, which confirms that it is towards the borders of the basin of the Sais, because from the geological point of view the shaly substratum becomes shallower east to west of the basin ;
The favorable location from the water point of view is located in the vicinity of electric survey A01 and A02, and in the vicinity of drilling F7.
Bibliographic References
[1]. AMRAOUI F. (2005): Contribution to the knowledge of karstic aquifers: Case of the Lias of the Saïs plain and the Causs’s middle atlas (Morocco). Thesis of State in Hydrogeology, p.13, pp.40-45.
[2]. Beresnev I.A., Hruby C.E. & Davis C.A., (2002). The use of multi-electrode resistivity imaging in gravel prospecting. Journal of Applied Geophysics 49, 245-254.
[3]. DAHLIN T. & LOKE M. H., (1998). Resolution of 2D Wenner resistivity imaging as assessed by numerical modelling. Journal of Applied Geophysics 38, 237-259.
[4]. DASSARGUES A., (2006). Geo-electrical data fusion by stochastic co-conditioning simulations for delineating groundwater protection zones, Proc. 16th International Conference on Computational Methods in Water Resources, CMWR-XVI, Copenhagen, Denmark, 18-22 June.
www.ijeijournal.com Page | 18 [6]. FLEURY P., PLAGNES V., BAKALOWICZ M., (2007): Modelling of the functioning of karstic aquifers and flow-rate simulation: Fontaine of Vaucluse (SE France). Journal of Hydrology, Vol. 345, Issues 1-2, 38-49.
[7]. MEYER C. DE STADELHOFEN, (1991). Applications of Geophysics to Water Research, pp.7-29 [8]. MIMOUNI A., OUJIDI M., NEGADI M., HADLACH M., BENGAMRA S., (2011). Use of
geoelectric prospecting to determine the geometry of the Miocene aquifer in the El Aïoun region (Northeast Morocco), Journal of Materials and Environmental Science 2 (S1) (2011) 491-494 ISSN: 2028- 2508.
[9]. SCHMUTZ M., MONTOROI J. P., ANDRIEUX P., BOBACHEV A. & NASRI S., (2003). Contribution of electrical resistivity methods in a semi-arid Mediterranean environment. Application to the lake of El Gouazine (Central Tunisia). 4th GEOFCAN Symposium. Paris, France).