334 Abstract—With the proliferation of very large network datasets in real world applications, there has been increasing interest towards link prediction, especially in social networks. Most of our previous efforts have neglected the semantic information associated with such networks. The abstract information of research documents in a co-authorship network is one such example. We build a link predictor for such networks, where nodes represent researchers and links represent co-authorships. We use the structure of the constructed graph, and propose to add a semantic approach using abstract information, research titles and the event information to improve the accuracy of the predictor. We also make use of the fact that researchers tend to work in close knit communities. The knowledge of a pair of researchers belonging to the same research community can be used to improve the accuracy of our predictor. To test our hypothesis, we use an Ensemble clustering of the DBLP network to supplement its structural features and test it in a reasonable time by under-sampling and balancing the dataset using decision trees and the SMOTE technique.
Index Terms—Graph mining, Link Prediction, Graph Clustering, Co-authorship Networks
I. INTRODUCTION
Over the years, the belief that research collaborations are beneficial has been well established. Intermittently, there have been many attempts to detect these collaborations. Popular data mining technique of representing the network as a vector space on various graphical measures in the network have been proved to be effective.
We work on an assumption that collaborations happen when researchers meet each other say, in a conference or if they co-author a publication. We would build a predictor based on the structure of a network where researchers are represented as nodes and collaborations as links between them. Hence, we essentially transform the non-trivial problem of finding future collaborators into a link prediction problem for such networks.
We identify some graph metrics defined purely for the link prediction problem in previous attempts to link mining. This graph is sparse and dynamic. Traditional graph metrics in the realms of graph theory do not suffice alone. Hence, we try to introduce semantic measures based on all the work done by the researchers in the network. Here, we use the research titles and paper abstracts to compute the relatedness of research undertaken by the pair of researchers in question. We also consider the common events (conferences/journals)
Mrinmaya Sachan, Computer Science and Engineering Indian Institute of Technology, Kanpur,India(email:[email protected])
Ryutaro Ichise, Principles of Informatics Research Division, National Institute of Informatics,Tokyo,Japan(email:[email protected])
where researchers presented their works to identify more precisely potential future collaborations. We are implicitly finding communities of researchers based on the nature of their research and events participated.
However, this notion of using community detection is only semantic and event based. Effective community detection techniques can be used to identify researchers working together in a particular topic/area. Prediction rate would be significantly improved if we can somehow capture the fact that people who work together, in the same research group or belong to the same research community collaborate more often in future.
Scalability of most community detection techniques for such sparse datasets is limited to at most a few thousand nodes and execution becomes intractable for very large networks. Hence, we use ideas from stochastic flow simulation in graphs described by Van Dongen [16] and an Ensemble clustering technique given by Frossyniotis, Likas & Stafylopatis [20] to detect research communities in approximately linear time.
In the next section, we briefly mention previous research work undertaken in the area of link prediction and compare them to our method. Section 3 formally defines our approach and Section 4 delineates the experiment performed and results. Finally, Section 5 suggests possible improvements in future and concludes.
II. PREVIOUS WORK
One of the most effective breakthroughs in the area of link prediction [10] introduced the concept of “Time Slicing”, where a collaboration network was cut into time slices and the network structure of one time slice was used to predict the structure in the next slice. A predictor was built using a training set based on attribute values obtained by running various graph algorithms for the two end-nodes. Though the prediction rate was low, yet their approach was promising in the sense that it significantly outperformed a random predictor. Hence, a correlation between the structure of a collaboration network and future collaborations was established. Since then, there have been many attempts to improve prediction rates of such predictors by introducing various measures based on the graph topology.
More related is the work on link prediction using multiple structural attributes and research titles by Pavlov- Ichise and Wohlfarth-Ichise [11, 13]. They introduced structural features of the graph (shown in Table 1) trying to capture the network structure effectively. Then, they used supervised learning techniques for link prediction.
Using Semantic Information to Improve Link
Prediction Results in Network Datasets
335
TABLE1. STRUCTURAL ATTRIBUTES FOR EACH NODE PAIR (VI,VJ)
Attribute Name Formula
Shortest Path Min{s| pathss
ij>0}
Common Neighbors
|Γ(vi) ∩ Γ(vj)|
Jaccard’s Coefficient
|Γ(vi) ∩ Γ(vj)|/ |Γ(vi) U Γ(vj)|
Adamic/Adar Σvk Є Γ(vi)UΓ(vj) 1/log Γ(vk) Preferential
Attachment |Γ(vi)|| Γ(vj)|
Katzβ Σs=1βs. pathssij
Weighted Katzβ Same as above but paths1ij = wvi,vj
PageRankdmin Min{PageRankd(vi),PageRankd(vj)}
PageRankdmax Max{PageRankd(vi),PageRankd(vj)}
SimRankΓ 1 if vi=vj
γΣaЄΓ(vi) ΣbЄΓ(vj)SimRank(a,b)/|Γ(vi)|Γ(vj)| otherwise
Linkvalue wij
“Shortest Path” between two nodes defines the minimum number of edges connecting vi and vj. If there is no such connecting path then, the value of this attribute is taken as infinite. “Common Neighbors” reports the number of neighbors that the two nodes have in common. “Jaccard's Coefficient” [14] is the normalized measure of “Common Neighbors”. It computes the ratio of common neighbors to all neighbors of the nodes. According to [13], it is a better measure than common neighbors when one end-node has a substantially larger neighborhood than the other. “Adamic/Adar” measures the similarity between two nodes by weighing rarer common neighbors more heavily. Here we use the fact that nodes that have a common neighbor that no other node in the network has are often more similar than nodes whose common neighbors are shared by many nodes. “Preferential Attachment” which is the product of the nodes degrees quantifies the probability that new nodes would connect to vi and vj. It states that a new collaboration is more likely to occur between authors who collaborate more often (regardless of who they collaborate with). “Katz” [9] is a much more refined measure of shortest path. It considers all paths between the two nodes and weighs shorter ones more heavily. The non-attenuation parameter γ controls the aggressiveness of weighing. A very small γ yields a measure similar to common neighbors, since paths-values for higher lengths do not contribute significantly to the summation. “Weighted Katz” also observes the weight between linked nodes in this calculation. “Page Rank” is the core algorithm used by Google to rank its search results.
PageRank (vi) = (1 - d) + d∑vmЄΓ(vi)PageRank(vm)/ Γ(vm)
In effect, the rank of a node in the graph is proportional to the probability that it will be reached by a random walk in the graph. The damping factor d Є [0, 1] specifies the likelihood with which the algorithm visits the node's neighbors rather than starting over. Note that the algorithm computes rank of each node. Since we need ranks over pairs, we take the minimum and maximum page ranks for the two nodes in every pair. “Similarity Rank” [18] uses that two nodes are similar to the extent they are connected to similar neighbors. γ Є [0,1] controls how fast the weight of connected nodes decreases as they get further away from the original nodes. Finally, “Link Value” is the weight of the edge between the pair of vertices.
However these attributes do not make sufficient use of the properties of the nodes themselves and focus mainly on link information. Our approach aims to build an improved method for link prediction by utilizing node attributes like abstract information and local network density.
III. METHOD
Our method extracts structural attributes from the past collaboration graph along with some semantic and event-based features and uses them to train a predictor reporting future collaborations using supervised learning algorithms. We test our method on a co-authorship network generated using the DBLP database.
We would like to add that the approach is not specific to the domain of co-authorship networks and can be easily applied to most networks in which link prediction is desirable.
A. Construct the Graph and the Feature Vectors
Structural Attributes: These are based on the work by Pavlov and Ichise [11]. For every pair of researchers in the co-authorship network, we construct a feature vector i.e. a vector of real numbers; each calculated using various graph algorithms on the network described in Table 1. Then, each pair is given its own binary label depending on whether a link exists between them in the future or not. Our goal is to build a classifier which can successfully predict if the pair is likely to work together in future.
336 they do, even though the research topics might be the same. Similarly, researchers far apart in the graph might collaborate in the future if they work in similar areas. Hence, the need to look into their research work undertaken by the researchers arises.
Moreover, methods [11] and [13] do not make significant use of node properties and rely on link information. Our approach aims to build an improved method by utilizing node properties like abstract information, community alignment and network density to improve the predictor of [13].
New Attributes: First, we look into abstracts of all research papers penned by the authors. Hence, in our approach we combine the structural and non-structural attributes to resolve the link prediction problem.
Thus, by counting the number of words in common between all the abstracts of their previous research papers, we can introduce a new feature based on the semantics of their research and not purely on the network structure. First of all, we pre-process the abstracts to eliminate stop words (words that do not add a meaning, like 'the' or 'a'). Then we use Jaccard's coefficient to compare the similarity of the two abstracts. We call this feature Abstract Keywords Match Count (AKMC).
AKMC(wi,wj) = |wi∩wj |/|wiUwj|
where, wi and wj are the multiset of all words in the abstracts of all research papers by the two authors. The semantic features do not use the structure of the graph, thus, we can have good results even on small datasets which are very sparse. To be more accurate, we combine this feature with other keyword matches on research titles and meeting places (conference/journal) used in [13].
Still we have missed major semantic information hidden in the abstracts. We need to use state of the art text mining techniques to completely capture all the abstract information. Hence, we use the popular Term frequency- Inverse Document frequency technique after eliminating stop-words. We use the L1 distance {d(X, Y) =||X-Y||} of the TF-IDF values for each term in the set of research documents published by each pair of researchers and add them as new dimensions tour dataset.
Another new attribute introduced is the density index. Density index for a node u computes the fraction of its previous collaborators who have collaborated among themselves in the past.
Clustering Index (u) = 3*Δ (u)/|P (u1, u2)|
where, Δ(u) = Number of triangles in the graph with u as a node and |P(u1,u2)| = Number of paths from any neighbor of u to another in the network not passing through u.
To represent the density index relation for a pair of nodes (i, j), we simply take the product of the density indices for both the nodes.
Next, we try and use various clustering approaches to improve our link predictor.
B. Community Detection
Identifying meaningful communities in social networks is hard. Extremely large network sizes or sparse network structures compound to the difficulty of the task. Constant efforts to come up with better and scalable approaches to detect communities are being made.
Estimating the quality of clustering obtained is another challenge. We use Modularity measure or Q value for such purposes. Modularity measure Q was proposed by Clauset, Newmann and Moore [18] and captures the idea that a good clustering must have a small cut value i.e. sum of weights of edges that have their end points in two different communities must be small.
Q = Number of edges within communities - Expected number of such edges
While standard clustering approaches like EM clustering and k-means on the feature space representing the structural attributes discussed earlier are easy to implement but they do not bring about any significant improvements. Other popular approaches like Spectral Clustering are known to do well for graphs. It gives a much more regular clustering for general graphs. The Q value rises significantly but the scalability of the algorithm is low. Due to the heavy Eigen value computation, it takes more than a day’s computation for a network with only 1000 nodes to compute the clustering.
The Markov clustering algorithm best answers our demands. Developed by Dongen[17], it is based on stochastic flows in graphs and is based on the intuition that a random walk of length k starting at a point is more likely to end up in the same cluster. It betters most graph clustering techniques for graphs in general. We introduce a stochastic matrix (normalized Adjacency matrix) M=A*d-1, A is the adjacency matrix of the graph, d is the diagonal matrix where dii is the sum of elements in the ith column of A.
The algorithm uses two important results on stochastic matrices namely expansion and inflation. Expansion is simple matrix multiplication by itself whereas inflation (Γ) is obtained by taking k hadamard power followed by scaling the diagonal. The two process when applied in unison, on convergence result into a matrix [M]ij where Mij represents the probability that a walk starting at i ends at j. Finally, the clustering is given by the set of connected components of the matrix so obtained. A sequential description of the algorithm is included below.
The Markov algorithm does really well in sparse regions of the graph. However, we can get closer to Q-optimality by recursively bi-partitioning the graph, each partition chosen to optimize for Q. Since, working through each possible partition is exponential in time; we will use this idea only for dense sub graphs where the Markov algorithm does not do as well. As the problem of finding dense sub graphs is in the NP space, we use an approximation factor-2 heuristic by Khuller-Saha [21].
Input: M1=A d-1as described before Δ = 0
Algorithm:
While (Δ) {
M2=M1; M1= Γ(M2);
Δ=||M1-M2||; }
337 The number of sub graphs for which the optimization algorithms is to be applied can be learnt by a linear-regression against the edge-node ratio of the graph.
Given these clustering techniques namely E.M. clustering of the structural attributes, Spectral clustering, and the Density based technique introduced above, next we attempt to boost the clustering methods we have adopted i.e. we try to combine the community results on each of these methods to form a better representative community partition. The boost-clustering algorithm [20] is a novel clustering methodology and exploits the general principles of boosting to provide a consistent partitioning.
The algorithm, inspired from Ada-boost algorithm: its classification counterpart establishes a cluster hypothesis comprising of the membership degree of each node with a community and learns the weight of all the nodes in every iteration. Pseudo-loss function is introduced using the concept of Gini-impurity borrowed from decision trees. The algorithm stops when the loss attains a threshold value.
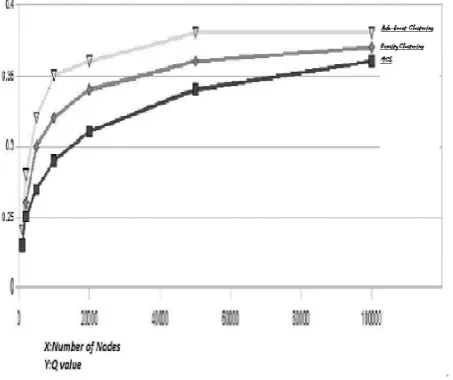
The graphic below clearly shows the comparison of the Q values obtained for graphs of varying size and the improvements of the boost clusterer over other standard methods.
Fig. 1: Comparison of Q values in Various Clustering Methods
Community Attribute: Once we have come up with communities through the process described above, we add a Boolean dimension to our training set signifying if the pair of researchers belongs to the same community.
C. Using Supervised Learning forLink Prediction
In this work, we use decision trees for supervised learning. We use the J48 algorithm (the Weka [16] adaptation of C4.5 algorithm [12]). An advantage of this is that we can observe the learned decision tree directly and make meaningful conclusions about the attributes that are important to the
prediction problem. However, after constructing feature vectors for every possible pair of researchers, we notice that most of them do not work together in future. The dataset is highly imbalanced and skews the learning algorithm by predicting that very few couples will collaborate. Though the decision tree is correct at almost all points (since there are very few positive examples), we are not able to predict any future co-authorships. Furthermore, due to the huge dataset, the process of learning becomes computationally very expensive. So we preprocess the dataset to reduce and balance it without modifying the general structure of the network.
D. Pre-processingof the Dataset
Co-authorship datasets are generally imbalanced since the classification categories are not equally represented. Very few pairs of researchers in a time slice collaborate in the next slice. This results in a skewed classifier. Hence, we need to re balance the dataset. We use under-sampling of the majority class by deleting some negative examples and over-sampling of the minority class by creating synthetics examples.
We conduct under-sampling by ignoring the pair of nodes which do not have any path between them. Since, the dataset is very sparse and the percentage of non reachable nodes is huge, we train the learning algorithm only on the pair of researchers who could possibly know each other. Under-sampling reduces the training set significantly, giving better results in much lesser time and prevents over fitting. Nevertheless, the set of examples are still imbalanced and we would have to oversample the minority class. In [3], the Synthetic Minority Over-sampling Technique (SMOTE)[4] is claimed to answer our demands. To overcome the over fitting and to increase the decision region of minority class examples, it generates synthetic examples by selecting of a random point along the line segment between positive features. This causes the classifier to create less specific decision regions. More general regions are learned for the minority class rather than being subsumed by the majority class examples around them. Hence, the decision trees generalize better.
It is important to note that the order of performing under-sampling and over-under-sampling matters for large datasets. Applying over-sampling before under-sampling results into a more stable and better predictor, as we would prove later. Hence, unlike [13], we initially over-sample the collaborations which are linked in the future followed by under-sampling those which do not.
IV. EXPERIMENTATION
To back up our ideas, we used the Digital Bibliography Library Project (DBLP) database [5]. It contains bibliographic information on major computer science journals and proceedings. We used only a part of the DBLP database pertaining only to the conferences on Artificial Intelligence. It results into a network of 20,182 authors and 66,660 links, about 0.01% of the DBLP dataset. The network contains 30 years of evolution history but the data increases irregularly with time. Hence, we choose only the conferences in 21st century for our testing. Then, to see (or predict) evolution patterns we consider time slicing. We DENSEST-SUBGRAPH (Graph G):
n←||V||, Hn ←G; for i = n to 2 do
Let v be a vertex in Hi of minimum degree Hi-1 ← Hi − {v}
338 split the data set into partitions, depending on the year of publishing. We analyze our results on two consecutive years of evolution data. For example, to analyze for years 2006-07 we use data from six partitions 2000-05 to create our network G = (V, E, W). Let V be the set of all authors in the data set and E = {(vi, vj )|vi and vj have co-authored at least one paper} be the set of edges. Finally, we assign weights to the network, weight of collaboration between two authors say vi and vj: wij is equal to the number of co-authored papers between them. Before extracting features, we should note that much collaboration between authors occurs only once resulting into many edges of weight one. These tenuous edges do not seem to carry much information about collaboration tendencies between authors. According to [13], such collaborations could often be attributed to chance. Hence, we leave out all edges with unit weight.
At this point, the average percentage of positive examples is only 0.0002%. Thus we use under sampling and the SMOTE algorithm and finally train the J48 algorithm on 10 fold validation. Finally, we use the Weka implementation of J48 for our experiment. We use the same performance metrics namely, precision, recall and F-Score for predictor evaluation as used by [13].
We also define some performance metrics for predictor evaluation. They are the same as used by [13]. For each feature vector, a predictor p can make either a positive (P) or a negative (N) prediction concerning the corresponding label. In the positive case, if p is correct, the prediction is said to be true-positive (TP); otherwise it is false-positive (FP). Conversely, in the negative case a prediction can be either true-negative (TN) if correct or false-negative (FN) if wrong. We can now define the metric recall as the proportion of TP predictions out of all true labels. Recall will give us an idea of how well p is able to predict collaborations that will happen in the future. It might also be useful to define the metric precision as the proportion of TP predictions out of all positive predictions. Precision will be useful in determining how well predicts the whole data (as opposed to just always predicting true, which guarantees a 100% recall rate).
Precision = |TP|/(|TP| + |FP|) Recall = |TP|/(|TP| + |FN|)
Using precision and recall, a final metric called the F-measure or F-score is introduced to numerically compare predictors. It is the harmonic mean of the precision and recall, and lies between 0 and 1.
F-Score = 2*Precision*Recall/ (Precision +Recall)
A. Results
In this section, we will show the improvement of our contribution by testing successively the classification of the previous method [13], then the one with the new features and finally, by examining the results with the under-sampling and with the SMOTE algorithm. For the following experimentations, the parameters of the SMOTE methods are 200 for the percentage of increase of the minority class and 5 for number of nearest neighbors that we use.
In Figure 1, we observe a gradual increase of the F-Score, on the 10 fold validation results, both on the test set and the training set. The new features have a better semantic approach for link prediction bringing about 15% improvement on the test split but, because of the dataset
being heavily imbalanced, we still have a low score. The first treatment which deletes the unreachable pairs of researchers and then uses the SMOTE algorithm increases the results significantly and sometimes even doubles the F-Score. The second treatment, which uses SMOTE algorithm first and then deletes the unreachable pairs of researchers (pairs in which the shortest path feature is infinite) actually gives more stable and significantly improved results to an extent of 5-6% in terms of the F-Score. This follows intuitively as the SMOTE algorithm would be more effective if used on the full data rather than under sampled data. The experiments have been conducted for 2004-05, 2005-06, 2006-07 and 2007-08. The improvements over the previous method are evident.
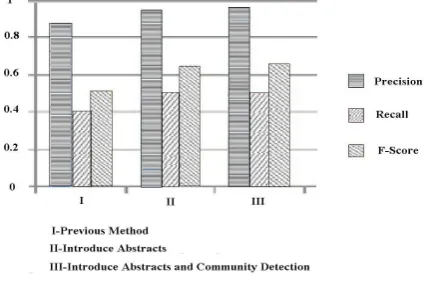
Fig. 2: F Score measure in the three approaches
Next, we would prove that both Abstract information and Community detection play a significant part towards the improvement. The graphic (Fig 3) shows a steady and consistent increase in the F-Score by addition of abstract information and community detection techniques.
Fig. 3: Improvement over the previous methods
V. CONCLUSION
339 large and sparse. We tested our algorithms with increased prediction rate in reasonable time using under-sampling and over-sampling methods. In a network of researchers, where a link represents a collaboration, such predictors could be useful in suggesting unrealized collaborations and thus help in building and maintaining strong research teams. In addition, by analyzing the algorithmic structure of predictors constructed for a specific network, we could gain valuable information about which attributes are most informative for the link prediction problem. This approach not only tries to help the world of research but can also be deployed in many other areas that need link prediction. Some of the important applications could be in the areas of social networking, bioinformatics and web based problems.
There is a lot of potential future research in this area to pursue. We think considering citation information, age of links, and directed graphs linked with time are some of them.
ACKNOWLEDGEMENT
We would like to thank Dr. Harish Karnick, Professor, Department of Computer Science and Engineering, Indian Institute of Technology, Kanpur for his invaluable advice on the community detection approaches adopted in this work.
REFERENCES
[1] Adamic, L.A., Adar, E.: Friends and neighbors on the web. Social Networks 25(3), 211-230 (2003)
[2] Brin, S., Page, L.: The anatomy of a large-scale hyper textual Web search engine. Computer Networks and ISDN Systems 30(17), 107-117 (1998)
[3] Chawla, N.V.: Data mining for imbalanced datasets: An overview. In: The Data Mining and Knowledge Discovery Handbook, pp. 853-867. Springer, Heidelberg (2005)
[4] Chawla, N.V., Bowyer, K.W., Hall, L.O., Kegelmeyer, and W.P.:
Smote: Synthetic minority over-sampling technique. Journal of Artificial Intelligence and Research 16, 321-357 (2002)
[5] The DBLP computer science bibliography (2008), http://dblp.uni-trier.de/xml/-
[6] Getoor, L., Diehl, C. P.: Link mining: a survey. SIGKDD
Explorations 7(2), 312 (2005)
[7] Hasan, M.A.: Link prediction using supervised learning. In:
Proceedings of the Workshop on Link Analysis, Counter-terrorism and Security (2006)
[8] Jeh, G., Widom, J.: Simrank: a measure of structural-context
similarity. In: Proceedings of the eighth ACM SIGKDD International Conference on Knowledge Discovery and Data Mining, pp. 538-543. ACM Press, New York (2002)
[9] Katz, L.: A new status index derived from sociometric analysis. Psychometrika 18(1), 39-43 (1953)
[10] Liben-Nowell, D., Kleinberg, J.: The link prediction problem for social networks. In: Proceedings of the twelfth international conference on Information and Knowledge Management, pp. 556-559. ACM Press, New York (2003)
[11] Pavlov, M., Ichise, R.: Finding experts by link prediction in co-authorship networks. In: Proceedings of the 2nd International Workshop on Finding Experts on the Web with Semantics (2007)
[12] Quinlan, J.R.: C4.5: Programs for Machine Learning. Morgan
Kaufmann, San Francisco (1993)
[13] Wohlfarth T., Ichise, R.: Semantic and Event-Based Approach for Link Prediction, in Proceedings of the7th International Conference on Practical aspects of Knowledge Management 50-61 (2008)
[14] Manning, C.D., Raghavan, P., Schutze, H.: Introduction to
Information Retrieval. Cambridge University Press, Cambridge (2008) [15] Newman, M.E.J.: Clustering and preferential attachment in growing
networks. Physical Review E 64,025102 (2001)
[16] Witten, I.H., Frank, E.: Data Mining: Practical Machine Learning Tools and Techniques with Java Implementations. Morgan Kaufmann, San Francisco (1999)
[17] Van Dongen S.: Graph clustering via a discrete uncoupling process. SIAM Journal on Matrix Analysis and Applications 30-1, p121-141, 2008
[18] Aaron Clauset, M. E. J. Newman, and Cristopher Moore, Physical Review E 70, 066-111 (2004)
[19] Sachan M., Ichise R.: Using Abstract Information and Community Alignment information for link prediction, in Proceedings of the 2nd International Conference on Machine Learning and Computing, pp61-65
[20] D. Frossyniotis, A. Likas & A. Stafylopatis: A clustering method based on boosting, Pattern Recognition Letters 25 (2004) 641654 [21] [21] Khuller S. & Saha B.: On finding Dense Subgraphs, In