e-ISSN: 2278-7461, p-ISSN: 2319-6491
Volume 7, Issue 9 [September 2018] PP: 61-69
Intrusive Assessment Of Speech Quality Over Wireless Networks
Prof. A. Olatubosun
1, Patrick O. Olabisi
21University of Ibadan, Ibadan, Nigeria. 2Bells University of Technology, Ota, Nigeria.
Corresponding Author: Patrick Olabisi
ABSTRACT:This work examined the intrusive aspect of objective assessment of the quality of speech transmitted over wireless mobile networks using the automated end-to-end PESQ algorithm, particularly for speech database developed locally. The immense merits objective assessment techniques have were highlighted. The raw PESQ scores were mapped using the more accurate Morfitt and Cotanis U. S. Patented logistic function. Correlating the mapped PESQ MOS scores with the subjective MOS score, coefficients of 0.77, 0.81, and 0.75 were obtained for speeches transmitted over three different wireless networks respectively.
KEYWORDS:Speech quality, assessment, MOS, intrusive, PESQ, mapping function, correlation.
--- --- Date of Submission: 15-11-2018 Date of acceptance:29-11-2018 --- ---
I. INTRODUCTION
Quality of service (QoS) of telecommunication services and applications was defined by [1] as: ―The collective effect of service performance that determines the degree of satisfaction of a user of the service.‖ Voice services provided on telecommunication networks is the major type of service in highest demand for network resources.Quality of voice services therefore, which refers to the clearness of a speaker‘s speech that makes for its intelligibility, as perceived by a listener, takes center stage in ensuring provision of quality services by network operators. This becomes particularly important to be credibly estimated in order to determine the reliability, viability and overall health of telecommunication networks whether fixed, fixed wireless or mobile wireless.
Estimation of the quality of transmitted speeches other than by parametric approach which is based on network parameters obtained from measurements by meters and indicators at the operation and maintenance center (OMC) and other nodes in the network [2], can also be by perceptual approach. Estimation of quality of transmitted speech from these two perspectives:network and perceptual perspectives, was dealt with in [3]. The perceptual approach to assessing speech quality is built upon the perspectives of users of services provided by the network. This as expressed in the quality framework of International Telecommunication Union (ITU-T) [4] is the level of quality of the services received or experienced by users of the service as perceived by them. This perceptual quality of service is either subjective or objective. Figure 1 shows an overall schematic diagram of techniques involved in perceptual speech quality assessment, namely:
1. Subjective Assessment: degraded (or output) speech is listened to by human subjects who make their ratings based on internationally accredited standards. The perceived quality of such speech is determined upon the background of the cognitive senses of what normal (clean) speech should sound like.
2. Objective Assessment: this is the application of computational models to mimic human auditory perception of speech to predict quality of transmitted speech, and is of the following two types:
(i) Intrusive Approach: predict speech quality by making use of both the original and the degraded speeches in its computations;
(ii) Non-intrusive Approach: compute and predict speech quality only from the psychoacoustic features of degraded (output) speech comparing it with a reference model.
The unit of expressing estimated speech quality, theMean Opinion Score (MOS), was first used in 1996 for voice codecs [5]. It is a well-established parameter which has over the years been applied to both analogue and digital telephone connections and telecommunications devices such as codecs, for characterizing the quality of telephone equipment and services [6,7].
Objective speech quality assessment techniques on the other hand have the following general characteristics [1, 10]:
1. They offer automatic voice quality assessment on communication systems; 2. They are based on complex mathematical models;
3. They utilize algorithms that compute the MOS value using a small portion of the speech in question; 4. They can be coded and computerized;
5. They are widely used to supplement subjective test results;
6. They are less costly means of implementing signals quality assessment;
7. They can be used to continuously measure speech quality on real-time basis on live telecommunication networks or voice processing systems.
Fig. 1: Perceptual Speech Quality Assessment Approaches.
II. OBJECTIVE APPROACH TO SPEECH QUALITY ASSESSMENT
Objective methods of assessing speech quality make use of mathematical models to automatically estimate the perceived quality of speech signals without dependence on human subjects at such a level that would equal or be close to that obtained from human subjects in subjective assessment. These methods predict speech quality based on speech signals that are physically measurable and are classified into parameter-based, signal-based and packet-layer models.
The parametric models mostly make use of estimates of network properties to predict quality of speech communication and usually carried out during network planning before implementation for full characterization of the network [9,12,13]. Signal-based models make use ofthe degraded signals from existing telecommunication networks or speech processing systems in evaluating the quality of the transmitted speech. Rix et al in [12] noted that several signal-based methods focus on models of speech production or speech signal likelihood, while others exploit aspects of perception such as noise loudness. Objective signal-based models are either intrusive or non-intrusive in nature.
Though they are computationally very intensive, objective quality measures are used for monitoring speech quality on telecommunication networks based on end-user‘s experience, in order to optimize the networks and speech processing systems for better quality, increased capacity or cost effectiveness [12].
III. INTRUSIVE OBJECTIVE SPEECH QUALITY ASSESSMENT
Perceptual models form the core of intrusive techniques for assessing speech quality. The earlier ones include the Masked-error model, which was proposed by Schroeder in 1979 and extended by Brandenburg in 1987 [13, 15].Simple masking methods according to [13] were used to obtain the mean Noise-to-Masking Ratio (NMR) in order to estimate the audibility of coding noise in a speech codersuch that the difference on the time frame between reference and distorted speeches was counted to be noise.The waveform-comparison algorithm models namely the Signal-to-Noise Ratio (SNR) and the Segmented Signal-to-Noise Ratio (SSNR) techniques [16, 17] required low computational algorithms but they do not correlate well with subjective assessment results at the face of comparison of diverse distortions [10].
The SNR waveform-comparison technique does not sufficiently provide a prediction of speech quality in modern telecommunication networks, which led to the development of some more complex objective quality assessment measures [18]. Some of these were discussed in [9,19], and they include the Cepstral Distance (CD) which compares two smoothed spectra in the cepstral domain, Log Spectral Distance (LSD) which obtains the log difference of the power spectra of the clean and the degraded speech signals, the Weighted Spectral Slope (WSS) based on weighted differences between the spectral slopes of 36 overlapping frequency bands, and the Auditory Spectrum Distance (ASD) which compares the audible time (in ms), pitch (in Bark) and amplitude (in dB) representations of the clean and the degraded speech signals.
Perceptual-domain models require that psychoacoustic processes are utilized to transform both the reference and degraded speech signals in accordance with the peripheral auditory system. Cote indicated that this transformation follows the psychoacoustic model for loudness calculation developed by Zwicker and Fastl [15]. In estimating speech quality, the integral quality is obtained from the combination of the perceptual transform and a simulation of the cognitive processes in the human auditory cortex. Perceptual-domain models include the Bark Spectral Distortion (BSD) whose perceptual transformation emulates auditory phenomena of critical integration in the cochlea and the loudness compression, and the distortion obtained as the square of the Euclidean distance between the transformed speeches. The Modified Bark Spectral Distortion (MBSD) incorporated a noise-masking threshold so as to make a difference between audible and inaudible distortions. Perceptual Speech Quality Measure (PSQM) developed in 1994 and published as an ITU-T standard [18] compares a coded signal to a source signal by mimicking sound perception and judgement processes of humans. PSQM is the first of the four most important and more recent intrusive speech quality objective models, with the others being Perceptual Analysis Measurement System (PAMS), Perceptual Evaluation Speech Quality (PESQ), and the latest Perceptual Objective Listening Quality Analysis (POLQA) still under test[20].
Other perceptual-domain models include Measuring Normalization Blocks (MNB), which was developed in [16,21] and based primarily on essential components of objective estimators of perceived speech quality namely: perceptual transformation and distance measures reflecting the magnitude of the perceived distance between two perceptually transformed signals. The Perceptual Analysis Measurement System (PAMS) describes audible errors introduced by the system or network as the differences between the original and the degraded speeches and obtained the total errors from the error spread.
IV. PERCEPTUAL EVALUATION OF SPEECH QUALITY (PESQ)
The Perceptual Evaluation of Speech Quality (PESQ) was developed and deployed for automated end-to-end assessment of the quality of transmitted speech on telephone networks [22], and standardized in [23]. It is a more robust speech quality measurement model which incorporates importantproperties from its predecessors like the perceptual transformation ofthe PSQM99 model and the time-alignment algorithm of the PAMS model. The wideband version of PESQ (WB-PESQ) was developed in 2005 [15], standardized as [24], and is currently the most widely used perceptual model particularly for wideband audio systems with frequency range of 50– 7,000 Hz[25]. The most recent Perceptual Objective Listening Quality Analysis (POLQA) is aimed at correcting alignment defects in PESQ model and at predicting integral speech transmission quality for all types of telecommunication networks when fully in use.On the other hand, the perceptual evaluation of audio quality (PEAQ) algorithm designed and standardized as [26], makes it possible to evaluate the quality of stereo audio signals [27].
The PESQ algorithm is a ―full reference‖ algorithm in that it requires the reference speech signal in estimating the quality of the degraded speech signal. It offers high accuracy and repeatability particularly in dedicated tests of speech quality in live telecommunication networks, like in drive tests on mobile networks.
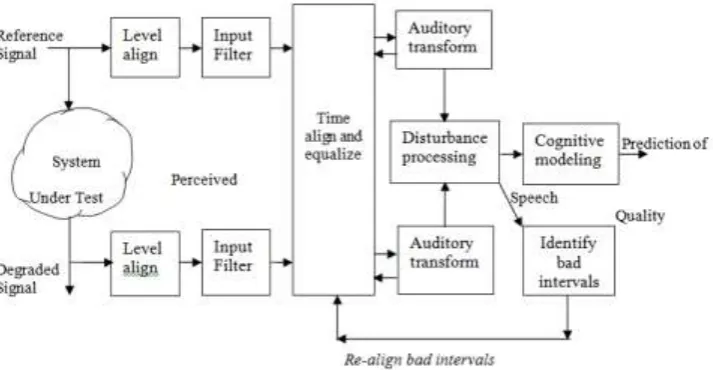
In the structure of PESQ model shown in figure 2 [12, 30], the reference and degraded speech signals are level-aligned to the same power level, filtered using Fast Fourier Transform (FFT), time-aligned, equalized, and processed through auditory transformation. Input speech signals are broken into phonemes each of 32ms duration from which spectral characteristics are calculated and perceptual differences from the reference signal are obtained for each phoneme [31]. These are the distortion parameters which are extracted, aggregated and mapped to the subjective MOS.
The auditory transform in PESQ algorithm maps the processed signals in time-frequency resolution in accordance with loudness perception to represent the human auditory system. This includes using an FFT with a Hamming window to calculate the instantaneous power spectrum in each frame known as Bark spectrum, calculating the mean Bark spectrum for the active speech frames in order to obtain a ratio between reference and degraded spectra which is useful for equalization of the reference to the degraded speech signals at + 20dB, determining gain variations in the reference and the degraded, and mapping the Bark spectrum to loudness to obtain the perceived loudness in each time – frequency representation.
Fig. 2: Structure of the PESQ model
The values of differences in disturbance inherent in the reference and degraded speech signals are aggregated to obtain a non-linear average using [32]:
Lp=
1
N disturbance
N
m=1
m p 1/p
(1)
In order to compute the difference existing between the reference and the degraded speech signals, these speeches are broken into phonemes of about 32ms each and are overlapped by 50%. Twenty phonemes are aggregated into a long 320ms syllable. A measure of perceived disturbance is estimated for each phoneme by calculating the symmetric and asymmetric disturbances Dsn and Dan and the aggregation of phoneme disturbance Dsn and Dan for every syllable, LDS and LDC, are given by [33]:
LDS =
1 20 Dsn
6 20
i=1
1/6
(2)
and,
LDC =
1
20 Dan
6 20
i=1
1/6
dsym =
1 N LDS
2 N
i=1
(i)
1/2
(4)
and,
dasym =
1 N LDC
2 N
i=1
(i)
1/2
(5)
where, N is the number of syllables in PESQ measurement window T.
The speech quality prediction is made from the two disturbance parameters, given above, and given by [32, 33]: PESQMOS = 4.5 − 0.1 dSYM − 0.0309 dASYM (6)
Goldstein and Rix [30] extended PESQ to measure terminals in mobile and hands-free telephones using the ITU-T P.AAM (acoustic assessment model). They found out that AAM has higher correlation with subjective MOS than with PESQ.
Sources Of Reference Speech Database
Reference speech samples used as raw materials for speech quality assessment are obtained from different source.There are a number of ready-made speech databases available out there, like the ITU-T P-series Suppl.23, NOIZEUS-960, NOIZEUS-2240, and E4 [34]. These speech databases were recorded in international languages like English, French, German, Italian, and so on, but of particular note is that they were spoken by nationalities of those languages. With this, the issues of accent and intonation are likely to cause problems of audibility and intelligibility for subjects while listening to transmitted speech samples in order to make their ratings during subjective quality tests. Instead of purchasing foreign-based speech databases or corpuses,we decided to locally build a speech database based on internationally standardized provisions and techniques outlined in [35]. Thespeeches were spoken in English language and by real Nigerian people, men and women, since subjects selected for subjective test are Nigerians of the same locality of the Southwestern region.
Pre-Processes To Objective Quality Assessment
Speeches were recorded with professional sound recording systems: complete Focusrite Scarlett Sound Studio Pack with advanced CUBASE LE software, a multi-track digital audio workstation (DAW) capable of taking multi source input, loaded on a Pentium Quad Core computer system. Recording was carried out in a professional studio with background noise level being less than the ideal 30dB prescribed by ITU-T.Recording of different speeches was done by eight (8) males and eight (8) females,each of them recorded four (4)different speeches bringing the total recorded original speeches to 64. The recorded speech was then converted from its original ‗.amr‘speech format to the ‗.wav‘ speech format for processing.
The 64 original wav speech samples were transmitted over three mobile wireless networks: two intra-networks (E to E network and G to G network) and one inter-network (E to M network), bringing the total transmitted speeches to 192. These transmitted speeches were made available for the speech quality tests that were carried out.
Subjective quality test was carried out using the listening-only test approach, with all transmitted speeches listened to and rated by a group of subjects based on the Absolute Category Rating (ACR) scale of 1 to 5, where 1 stands for bad quality, 2 for poor quality, 3 for fair quality, 4 for good quality, and 5 for excellent quality.Theseratings were collated per transmitted speech, summed up and averaged over the total number of subjects. The average score values obtained weredocumented as the Mean Opinion Score (MOS) per transmitted speech.
V. IMPLEMENTING THE OBJECTIVE QUALITY ASSESSMENT
Fig.3: Command prompt showing PESQ result
Files of original speech, degraded speech and simulated PESQ program were saved in a folder on the desktop, and were accessed for each speech file (having .wav extension added to the filename and the sampling rate +8000used). This step is repeated for all the speeches inputting the original speech and the corresponding degraded speech to generate the raw PESQ quality score.
Pesq Mapping Function
The raw PESQ quality scores obtained for each speech pair(the original and the corresponding transmitted speeches), were tabulated and the data analysed.The output raw score range of -0.5 to 4.5 was generated by the internal mapping polynomial function in the PESQ algorithm. This is different from the normal Subjective MOS rating obtained from ACR tests occupying the range of 1 to 5.Before the raw PESQ quality score was correlated with the Subjective MOS score, it is first mapped to a new scale that was linearly approximated to the Subjective MOS scale.The quality of each of the transmitted speeches is determined from the values of the mapped PESQ Listening Quality Only (MOS-LQO) rather than from just the PESQ raw quality scores only.
Mapping was carried out with the use of a transfer function for better correlation, which helps to correct the mismatch in the quality score range. Some mapping functions have evolved over time at correcting this mismatch, like the Auryst mapping function among others [36].The following are among the major mapping functions available in literature for speech signals (narrowband):
1. ITU-T Rec. P.862.1 Amendment to PESQ [37]:
y = 0.999 + 4.999 − 0.999
1 + e(−1.4945 x+ 4.6607 ) (7)
2. United States Patented logistic function by Morfitt and Cotanis [30]:
wherex is the raw PESQ Score and y becomes the mapped PESQ MOS score (MOS-LQO).
In making comparative analysis of these two mapping functions, table 1 presents the minimum and the maximum of the raw PESQ quality scores, the de-facto Subjective MOS score, and the mapped PESQ MOS score.It could be seen from this comparative analysis that the mapped PESQ MOS Score due to the United States Patented logistic function has accuracy of 93.6% to the Subjective MOS and the P.862.1 mapping function has accuracy of 88.3% to the Subjective MOS.
With the usage of a mapping function the capability of the PESQ algorithm to provide better accuracy is being increased.Therefore, there is the need to choose the mapping function with better accuracy. To this end, the logistic (mapping) function patented for Morfitt and Cotanis showed better accuracy than the ITU-T standardized in mapping function in ITU-T Rec. P.862.1. The Morfitt and Cotanis logistic (mapping) function was therefore used for analysis in this work.
Table 1: Comparative analysis of mapping functions in [36] and [37].
Raw PESQ Score Subjective MOS
Score
Morfitt&Cotanis logistic function Mapped PESQ MOS Score
ITI-T Rec. P.862.1 mapping function Mapped PESQ MOS Score
1. -0.5 1 1.0111489 1.0178433
2. 4.5 5 4.7556190 4.5496383
Difference between highest & lowest scores
4 3.7444701 3.531795
%age of MOS Score 100% 93.6% of MOS 88.3% of MOS
VI. SCATTER PLOTS AND CORRELATIONS ANALYSIS
Correlation analysis is of the essence of fitting the intrusive quality assessment to the subjective quality score to determine its figure of merits, with normalized correlation given by ρ ∈ (0, 1) [38]. This is because subjective quality assessment is been adjudged the best and most accurate technique for quality assessment despite its challenges and constraints.
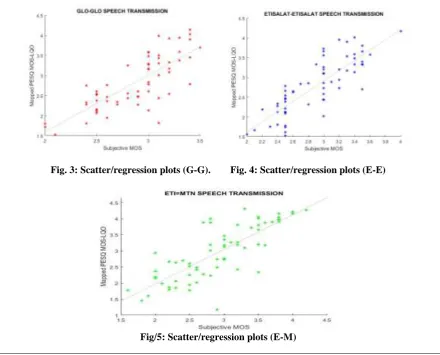
Correlational plots of the quality scores obtained from subjective tests (MOS) and the intrusive objective tests were made with the aid of scatter plots on MATLAB software. These are shown in figures 3 to 5, each including a plot of the line of regression.
Fig. 3: Scatter/regression plots (G-G). Fig. 4: Scatter/regression plots (E-E)
The correlation coefficients of fitting the objective quality score to the subjective quality score for the various transmission conditions or networks as in this case, was obtained using the Pearson‘s coefficient equation given by [17]:
R = xi− x
N
i=1 Ni=1 yi− y
Ni=1 xi− x 2 Ni=1 yi− y 2
(9)
The obtained coefficient correlation figures of merit for each of the three network speech transmissions are shown in table 2.
Table 2: Correlation Coefficients Subjective vs. PESQ MOS-LQO.
Networks G – G E – E E – M
Correlation Coefficient, R
0.77 0.81 0.75
III. CONCLUSION:
Approaches for perceptive quality of assessment of speeches transmitted over telecommunication networks were considered with particular focus on intrusive objective quality assessment methods. Speech database locally developed in English language with local accents were used as the raw materials or speech samples for this speech quality assessment. Locally developing original speech database allowed for proper and more accurate rating of speech quality by subjects in subjective speech assessment. Recorded speech samples were transmitted over two intra-networks and one inter-network for evaluation purpose for this research work.
Objective methods of speech quality estimation are highly computational but possess very important merits that make them much more desirable over subjective speech quality estimation methods. In this work, the PESQ algorithm was compiled on Dev C++ software to obtain raw MOS scores that were mapped using the Morfitt and Cotanis logistic mapping function that proved more accurate than the ITU-T Rec. P.862.1 mapping function. The mapped PESQ MOS-LQO scores were correlated with quality scores (MOS) obtained from subjective assessment to determine the figure of merit of the whole research work done.
REFERENCES:
[1]. ITU-T Rec. E.800. 2008. Definitions of terms related to quality of service. ITU-T, Geneva, Switzerland, ITU-T Recommendation E.800, 09/2008.
[2]. Werner, M., Kumps, K., Tuisel, U., Beerend, J. G., and Vary, P. 2003. Parameter-Based Speech Quality Measures for GSM.In Proceedings of The 14th IEEE 2003 International Symposium on Persona1,lndoor and Mobile Radio Communication, PIMRC 2003, 7-10 Sept, 2003 3: 2611-2615.
[3]. Olatubosun, A. and Olabisi, P. O. 2018. Dual perspectives to the assessment of quality of service of transmitted speeches.
[4]. ITU-T Rec. G.1000. 2001. Communications quality of service: A framework and definitions. ITU-T Geneva, Switzerland, ITU-T Recommendation G.1000, 11/2001.
[5]. Kajackas, A and Vindasius, A. 2010. Analysis and Monitoring of End-user Perceived QoS in Mobile Networks. 14th IEEE Int'l Conference on Telecommunications Network Strategy & Planning Symposium, 2010, NETWORK '10, Warsaw, 27-30 Sept 2010: 1-4.
[6]. Mahdi A. E. and Picovici D. 2006. Perceptual Voice Quality Measurement – Can You Hear [7]. Me Loud and Clear.ICI Publishers.210–231.
[8]. Falk, T. H. and Chan, W. Y. 2006a. Non-Intrusive Speech Quality Estimation Using Gaussian Mixture Models.IEEE Signal Processing Letters, February 2006 13.2: 108-111.
[9]. Kim, D.-S. andTarraf, A. 2004. Perceptual Model for Non-Intrusive Speech Quality Assessment.In Proceedings of IEEE International Conference on Acoustics, Speech and Signal Processing, 2004, (ICASSP-04), Florence, Italy, 4-9 May, 2004 3:iii – 1060 – 3.
[10]. Bayya, A. and Vis, M. 1996. Objective Measures for Speech Quality Assessment in Wireless Communications. Proceedings of IEEE International Conference on Acoustics, Speech, and Signal Processing, 1996, (ICASSP-96), Atlanta, Georgia, USA, 7-10 May, 1996 1: 495-498.
[11]. Grancharov, V., Zhao, D. Y., Lindblom, J., and Kleijn, W. B. 2006. Low-Complexity, Nonintrusive Speech Quality Assessment.IEEE Transactions on Audio, Speech and Language Processing, November 2006 14.6: 1948-195.
[12]. Koster, F., Moller, S, Antons, J-N., Arndt, S., Guse, D., and Weiss, B. 2014. Methods for Assessing the Quality of Transmitted Speech and of Speech Communication Services.Acoustics Australia.Vol 42, No 3. December 2014. 179 – 184.
[13]. Rix, A. W., Beerends, J. G., Kim, D. S., Kroon, P., and Ghitza, O. 2006. Objective Assessment of Speech and Audio Quality – Technology and Applications.IEEE Transactions on Audio, Speech and Language Processing, November 2006 14.6: 1890 – 1901. [14]. Rix, A. W. 2004. Perceptual Speech Quality Assessment – A Review.Proceedings of IEEE
[15]. International Conference on Acoustics, Speech, and Signal Processing, 2004, (ICASSP‘04), 3: 1056 – 1059.
[16]. Grancharov, V. and Kleijn, W. B. 2008. Springer Handbook of Speech Processing, Chapter on Speech Quality Assessment. Springer – Verlag, Berlin Heidelberg.83–99.
[17]. Cote, N., 2011. Integral and Diagnostic Intrusive Prediction of Speech Quality, Springer Book Series.Springer-Verlag Berlin Heidelberg. 2011. 37-85.
[19]. Hu, Y and Louzoui, P. C. 2008. Evaluation of Objective Quality Measures for Speech Enhancement.IEEE Transactions on Audio, Speech, and Language Processing, Vol. 16, No. 1, January 2008.229-238.
[20]. ITU-T Rec. P.861. 1996. Objective quality measurement of telephone band (300 – 3400 Hz) speech codecs. ITU-T Geneva, Switzerland, ITU-T Recommendation, P.861, 08/1996.
[21]. Liu, W. M., Jellyman, K. A., Mason, J. S. D., and Evans, N. W. D. 2006. Assessment of Objective Quality Measures for Speech Intelligibility Estimation.Proceedings of IEEE International Conference on Acoustic, Speech, and Signal Processing (ICASSP ‗06), Toulouse, 14-19 May, 2006 1: 1225 – 1228.
[22]. Voznak, M., Rozhon, J., Rezac, F., and Slachta, J. 2013. Real-Time Speech Quality Monitoring Using Non-Intrusive Method.Journal of Recent Researches in Circuits, Communications and Signal Processing, World Scientific and Engineering Academy and Society (WSEAS) Publications,201343-48.
[23]. Voran, S. 1999. Objective Estimation of Perceived Speech Quality—Part II: Evaluation of the measuring normalizing block technique. IEEE Transactions on Speech and Audio Processing, July 1999 7.4: 385–390.
[24]. Conway, A. E. 2014. Output-Based Method of Applying PESQ to Measure the Perceptual Quality of Framed Speech Signals. In Proceedings of IEEE Wireless Communications and Network Conference, 2014.WCNC, 2014.Vol 4, 2521-2526.
[25]. ITU-T Rec. P.862. 2001 Perceptual Evaluation of Speech Quality (PESQ): An objective method for end-to-end speech quality assessment of narrow-band telephone networks and speech codecs. ITU-T Geneva, Switzerland, ITU-T Recommendation, P.862, 02/2001.
[26]. ITU-T Rec. P. 862.2. 2007. Wideband extension to Recommendation P.862 for the assessment of wideband telephone networks and speech codecs. ITU-T Geneva, Switzerland, ITU-T Recommendation, P.862, 11/2007.
[27]. Ekman, L. A., Grancharov, V. and Kleijn, W. B. 2011. Double-Ended Quality Assessment System for Super-Wideband Speech.IEEE Transactions on Audio, Speech, and Language Processing, Vol. 19, No. 3, March 2011.558-569.
[28]. ITU-T Rec. BS.1387-1. 2001. Method for objective measurements of perceived audio quality.ITU-T Geneva, Switzerland, ITU-T Recommendation, BS.1387-1, 2001.
[29]. Schafer, M., Bahram, M., and Vary, P. 2013. An Extension of the PEAQ Measure by a Binaural Hearing Model.In Proceedings of 2013 IEEE International Conference on Acoustics, Speech, and Signal Processing, ICASSP ‘13, Vancouver, Canada, 26-31 May, 2013. 8164-8168.
[30]. Sun, L. and Ifeachor, E. C. 2006. Voice Quality Prediction Models and their Applications in VoIP Networks.IEEE Transactions on Multimedia, August 2006 8.4: 809-820.
[31]. Psytechnics . 2004. PESQ: An Introduction. Ipswich, 23, Museum Street, Ipswich Suffolk, United Kingdom, IP1 1HN September, 2001 7.
[32]. Goldstein, T. and Rix, A. W. 2004. Perceptual Speech Quality Assessment in Acoustic and Binaural Applications.In Proceedings of IEEE InternationalConference on Acoustics, Speech and Signal Processing, ICASSP‘04, Montreal, Quebec, Canada, 17-21 May, 2004 3: 1064-1067.
[33]. Kajackas, A and Vindasius, A. 2010. Analysis and Monitoring of End-user Perceived QoS in
[34]. Mobile Networks. 14th IEEE Int'l Conference on Telecommunications Network Strategy & Planning Symposium, 2010, NETWORK '10, Warsaw, 27-30 Sept 2010: 1-4.
[35]. Rix, A. W., Beerends, J. G., Hollier, M. P., and Hekstra, A. P. 2001. Perceptual Evaluation of Speech Quality (PESQ) – A New Method for Speech Quality Assessment of Telephone Networks and Codecs.In Proceedings of IEEE International Conference on Acoustics, Speech, and Signal Processing (ICASSP ‘01), Salt Lake City, UT, 07-11 May, 2001 2: 749-752.
[36]. Kajackas, A. and Anskaitis, A. 2009. An Investigation of the Perceptual Value of Voice Frames.INFORMATICA, 2009.Institute of Mathematics and Informatics, Vilnius.Vol. 20, No 4. 487 – 498.
[37]. Hines, A., Skoglund, J., Kokaram, A., and Harte, N. 2013. Robustness of speech quality metrics to background noise and network degradations: comparing VISQOL, PESQ and POLQA.Proceedings of 2013 IEEE International Conference on Acoustics, Speech and Signal Processing, ICASSP ‘13. Vancouver, BC, Canada. 26-31 May, 2013. 3697 – 3701.
[38]. ITU-T Rec. P.830. 1996. Subjective Performance Assessment of Telephone Bad and Wideband Digital Codecs. ITU-T Geneva, Switzerland, ITU-T Recommendation, P.830 02/1996.
[39]. Morfitt III, J. C. and Cotanis, I. C. 2008. Mapping Objective Voice Quality Metrics to a MOS Domain for Field Measurements.United States Patent. Patent No. US007327985B2. https://www.google.com/patents/US7327985 Feb 5, 2008. [40]. ITU-T Rec. P.862.1 2003 Mapping function for transforming P.862 raw result scores to MOS-LQO. ITU-T Geneva, Switzerland,
ITU-T Recommendation, P.862.1 11/2003.
[41]. Gierlich, H. W., Heute, U., and Moller, S. 2008. Aspects of Speech Quality Assessment. ITG-FachtagungSprachkommunikation, Aachen. VDE VERLAG GMBH, 8 – 10 Oktober, 2008.