Abstract— In this paper, Erosion–Corrosion (E-C) behaviors of the Nano-Structured pure copper were investigated using a slurry pot rig by weight-loss measurements. The Nano-structured pure copper samples were produced by equal channel angular pressing (ECAP) process and the hardness of the material was measured. The E-C testing parameters included the slurry flow velocity, sand concentration, and impact angle. The values of flowing velocities were 1.4m/s, 2.7m/s, 3.8m/s. 4.5m/s, and 5.4m/s. The impacting angles ranging from 30o to 60o and sand concentration percentages were 0wt%, 10wt%, 20wt%, and 30wt% The results showed that, with the increase of slurry flow velocity and sand concentration, the E–C rate of the Nano-structured pure copper increases. However, the E–C rate of the material in sea water sand slurry decreases with increasing impact angle. The maximum value of weight loss per unit area for Nano-structured pure copper occurred at an impact angle of 45o.
Index Term— Erosion-corrosion, ECAP, Nano-structured
copper, Slurry pot.
I. INTRODUCTION
EROSION–corrosion (E-C) consists of both chemical processes and mechanical effect of a moving medium onto a metal surface. As a result of this synergism effect, the metal loss rate can increase significantly beyond that due to either erosion or corrosion alone separately [1-6]. E-C problems arise in power plants, oil processing plants, and chemical plants where a target material is subjected to the interaction between solid parts and corrosive fluid. It usually results in corrosion that occurs at a higher rate than would be expected under stagnant conditions. The problem has been, also, reported to affect different types of equipment and components for example pressure vessels, heat exchangers, pipelines, and valves. Selection of materials is important for E-C applications as the wear can be accelerated due to the aggressive conditions in harsh environments [7].
Copper is considered one of the most widely used metals in manufacturing processes next to aluminum and steel. It is used in shipbuilding, power generation, manufacturing of electronic products, and production of transportation vehicles. Copper is also an essential component in the motors, radiators, connectors, brakes, and bearings used in cars and trucks as well as in aerospace industries. Furthermore, copper is used as nutrient for plants and animals. Modern medicine applies
Osama Mohamed Irfan is an assistant professor at the Mechanical Engineering Department, Qassim University KSA, on leave from Bani Suief University, Egypt.
copper bracelets to reduce pains in joints. Copper is used as a treatment because of its anti-microbial elements that benefit in producing hygienic surfaces [8]. In case of copper alloys, it has been known that increasing flow velocities has no significant effect on the corrosion rate until a critical flow velocity is reached. For example, the maximum flow rate for Cu Ni alloy 90/10 in seawater systems is known to be limited to about 3 m/s [9]. The combination effect of both erosion and corrosion is usually measured in accordance with ASTM G119 [10]. The overall E-C wear rate can be calculated as follows:
T = Wo + Co + S (1)
S = ΔWC + ΔCW (2)
Where, Wo: mechanical erosion wear rate, Co: corrosion rate,
S: synergistic effect of two processes, ΔWC: change in erosion
rate due to corrosion, and ΔCW: change in corrosion rate due
to erosion. The value of ΔCw can be calculated as follow:
ΔCW = WC - Co (3)
In order to find the value of ΔWc, equations (1) and (3) are combined as follows [11-13]:
ΔWc = T - Wo - CW (4)
Previously, E-C phenomenon has been studied for different materials. For example, in case of steel it has been reported that increasing of sand concentration and slurry flow velocity, resulted in increasing the E–C rate. However, an increasing impacting angle would decrease the E–C rate in oil sands slurry[14]. High NaCl concentration decreases the sand erosion rate of 1018 carbon steel slightly by increasing the density and viscosity of the liquid solution [15]. Three dimensional topographies have been developed to study the effects of both impact angle and flow velocity on corrosion pits of Q235 steel in dynamic flow The results indicated that deeper corrosion pits appeared at impacting angle of 30o than that at 0o and 90o, and under flow velocity of 0.8 m/s[16]. E-C behavior of AISI 1020 carbon steel has been examined by J. Malik et. al. [17]. The results showed significant increase in erosion rates of corroded samples. E-C of Aluminum alloy AA6061 has been studied by Osama Irfan et al. [2]. The results demonstrated that weight loss of AA6061 increases with increasing the testing time, flow velocity and projected area. Meanwhile, the total weight-loss in case of NaCl solution that contains sand particles is generally higher than that caused by NaCl solution (corrosion only). Corrosion tests on many copper alloys have been conducted by A. Sakamoto et al. [18]. The results indicated that the damage originated was identified with the flow induced localized corrosion. X.Y. Li et al. [19]
Erosion-Corrosion Behavior of Nano-Structured
Pure Copper under Different Flowing Velocities
O
SAMAM
OHAMED IRFANMechanical Engineering Department, Engineering College, Qassim University, KSA. On leave from Bani Suief University, Egypt
carried out an investigation into the cavitation erosion and corrosion behaviors of the Copper–manganese–aluminum alloy weldment in 3.5% NaCl solution. The results showed that welding zone exhibited better cavitation erosion resistance than the base metal.
Equal Channel Angular Pressing (ECAP) is considered one of the Severe Plastic Deformation (SPD) processes suitable for producing Nano-crystalline bulk materials. Processing by (ECAP) has become a recognized technique for introducing significant grain refinement into bulk metals [20-21]. Farideh Farda et.al [22] applied ECAP on pure copper with the channels intersected at an angle of 120◦. Pressing was implemented at room temperature. F. Al-Mufadi and F. Djavanroodi have designed and manufactured a die with a channel diameter of 20mm an angle of 90° to apply ECAP on pure copper. Four ECAP passes have been achieved. Then the mechanical properties of deformed samples were investigated [23]. It was observed lack of studies regarding E-C behavior of Nano-structured materials from which pure copper. This paper investigates experimentally the E-C behavior of Nano-structured pure copper produced by ECAP process. Firstly, hardness measurement was carried out along the four passes of ECAP. Then the work focused on E-C conditions such as different slurry flow velocities, different duration times, different impacting angles, and different sand concentrations. E-C experiments were conducted by using slurry pot tester which had been designed and manufactured for this purpose. carefully proofread your paper.
II. EXPERIMENTAL DETAILS
A. Material
Nano-structured commercial pure copper produced by ECAP was used for the study. Chemical composition of commercial pure copper is listed in Table 1.
Table. Chemical composition of pure copper samples (wt. %)
Bi Sb As Fe Pb S Cu
0.001 0.002 0.002 0.005 0.005 0.005 99.95
B. Samples Preparation and hardness testing
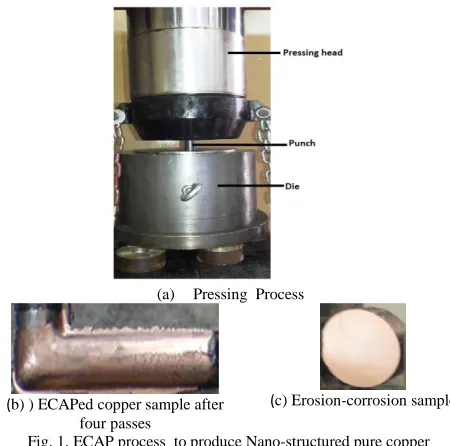
A die was designed and manufactured from steel H13 was used to carry out the experiments. Four ECAP passes at room temperature were performed to achieve Nano structured commercial pure copper samples. A hydraulic press of 160 tons was used for the pressing process. The ECAPed copper samples were prepared from extruded rods with nominal dimensions of 20mm diameter and 140mm length. The conditions of the ECAP process were die channel diameter of 20mm, channel angle of 90o, and ram speed of 2mm/s [23]. To verify refining of the grains, optical microscopy for initial samples and SEM for ECAPed samples were applied to measure the grain size of material. The average grain sizes of both initial samples and ECAPed ones after four passes were 120µm and 600nm respectively. Then samples of Nano-structured pure copper were prepared for E-C experiments by
cutting the ECAPed samples to dimensions of 20mm diameter and 6 mm thickness through a Wire Electrical Discharge Machining (WEDM). The ECAP process, ECAPed sample, and E-C sample are illustrated in Fig.1.
(a) Pressing Process
(b) ) ECAPed copper sample after four passes
(c) Erosion-corrosion sample
Fig. 1. ECAP process to produce Nano-structured pure copper
C. Erosion-Corrosion Tests
The tests had been conducted according to ASTM G31-72 and G119 standards [10, 24] in a slurry pot tester that developed for this purpose. The set up details of the developed slurry pot consists of a cylindrical pot made of stainless steel. Its dimensions are 300 mm diameter and 300mm height to handle large slurry volume. A circular disc has a diameter of 200mm and thickness of 25mm was bolted to a shaft. The whole assembly was then fitted to the spindle of a 1.5 KW drilling machine through a rigid coupling. The drilling machine has a maximum speed of 1670 rpm. In order to have different linear speeds, the samples are attached to the disc at different radial distances. The required linear speed can be calculated from the following equations.
v = ω.r (5) ω = 2π.N (6) v= 2π.N.r/60 (7)
Where, v: linear velocity (m/s), ω: angular velocity (rad/s) and N: Number of revolutions per minute (rpm), and r: radius of rotation (mm).
The sample holders could be rotated to allow the erodent medium impacting the surface at different angles. The slurry pot and details of the disc are shown in Fig.2. A slurry solution of 3.5wt% sodium chloride (NaCl) and SiO2 with
(a)Erosion-corrosion test (b)Details of disc, sample holders, shaft, and coupling Fig. 2. Set Up of Erosion-Corrosion Test
III. RESULTS AND DISCUSSION
A. Hardness measurement
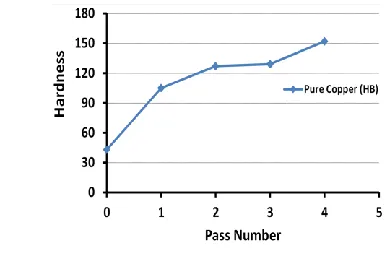
The measured Vickers hardness versus the number of the passes on the plane perpendicular to the longitudinal axis of the ECAPed copper samples is shown in Fig.3. It can be observed that the hardness dramatically increases after a single pass of ECAP, but the rate of the hardness decreases as the number of passes increases. After the second pass the hardness was ≈130 HB. In the subsequent pass (pass three) the magnitude of hardness remains almost the same until the maximum number of 4 passes, whereas hardness increases up to its highest value of ≈152HB. Due to dislocation hardening exists in pure copper; a short time is required to reach strain saturation. The effects of the increasing hardness magnitude in the ECAP process were previously studied [25].
B. Effect of flowing velocity on weight loss at various duration times.
The increase in weight loss per unit area with an increase in flowing velocity is as expected [17 and 26]. It can be seen from Fig.4 that the weight loss of Nano-structured pure copper gradually increases with increasing the flowing velocity at different duration times. The constant parameters during this test were impacting angle of 45o and sand concentration of 20wt. % with the flowing velocities ranging from 1.4 m/s to 5.4 m/s, the weight loss of Nano-structured pure copper for 12 h, increased from 1.3x10⁻⁶ gm/mm2 to 22.2x10⁻⁶ gm/mm2. For 24 h the weight loss increased from 3.7 x10⁻⁶ gm/mm2 to 24.8 x10⁻⁶ gm/mm2. For 48 h the weight loss increased from 8.1 x10⁻⁶ gm/mm2 to 28.9 x10⁻⁶ gm/mm2. This occurs as a result
of the increase in kinetic energy that leads to higher shear stresses which causes more mass loss. Furthermore, the increases in E-C rate for Nano-structured pure copper occurs due to loss of non-adherent layer of corrode during immersion time of experiment. Also the increase in weight loss is mainly due to aggressive erosion and corrosion attack on metal surface.
C. Effect of flowing velocity on weight loss at various sand concentrations.
The weight loss per unit area of Nano-structured pure copper as a function of the flowing velocity at various sand concentration percentages is shown in Fig.5. It is noticed that weight loss increased with increasing the sand concentration in the slurry at all values of the flowing velocity. For the flowing velocities from 1.4 m/s to 5.4 m/s, the weight loss per unit area of Nano-structured pure copper for only corrosion effect (0wt% of sand in the slurry), increased from 2.1x10⁻⁶ gm/mm2 to 7.9x10⁻⁶ gm/mm2. For 10 wt. % of sand, the weight loss per unit area increased from 6.4 x10⁻⁶ gm/mm2 to 21.4 x10⁻⁶ gm/mm2. For 20wt% of sand, the weight loss increased from 8.1 x10⁻⁶ gm/mm2 to 23.8 x10⁻⁶ gm/mm2. For 30wt% of sand, the weight loss increased from 10.2 x10⁻⁶ gm/mm2 to 24.8 x10⁻⁶ gm/mm2. Moreover, it is observed of the total E–C that the erosion rate component is the dominant part, and the contribution of corrosion is slight. Also there was an identical effect of the slurry flow velocity on E–C to the sand concentration.
Drilling m/c
Slurry Pot
Table
Coupling
Disc Samples
holders
Fig. 3. Hardness measurement through ECAP passes
Fig. 4. Variation of weight loss per unit area with flowing velocity at various duration times
(Impacting angle=45o and Sandingconcentration=20wt%)
Fig. 5. Variation of weight loss per unit area withflowing velocityat various sand concentrations
D. Effect of flowing velocity on weight loss at various impact angles.
It is clear from the graph shown in Fig.6 that the weight loss per unit area of Nano-structured pure copper at various flowing velocities is small with an impact angle of 30o and increased to be maximum with an impact angle of 45o, and then decreased with an impact angle of 60o. For flowing velocity from 1.4m/s to 5.4m/s the weight loss per unit area for 30o, increased from 5.2x10⁻⁶ gm/mm2 to 15.8x10⁻⁶ gm/mm2. For 60o the weight loss per unit area increased from 6.7 x10⁻⁶ gm/mm2 to 23.1 x10⁻⁶ gm/mm2. For 45o the weight loss increased from 8.1 x10⁻⁶ gm/mm2 to 28.9 x10⁻⁶ gm/mm2. These results may be interpreted as follows: when the fluid impacts the sample at 30o, the surface film is broken and damaged, but still remains on the surface, providing somewhat protection. At an impact angle of 45o a combined effect of shear stress and normal stress are involved, resulting in both physical damage and removal of surface layers as well as appearing of pits. Therefore, the highest E-C rate was observed at 45o. Two mechanisms have been proposed to illustrate the synergism of corrosion and erosion. One is the corrosion-enhanced erosion which is related to the degradation of surface hardness or strength of materials. The role of corrosion is to roughen the material surface, which in turn greatly increases the erosion rate. Another is the erosion-enhanced corrosion which is caused by the retardation of formation of a protective film on metal surface. As a consequence, corrosion proceeds at a high rate in the absence of such protective films [27].
E. Microscopic examination
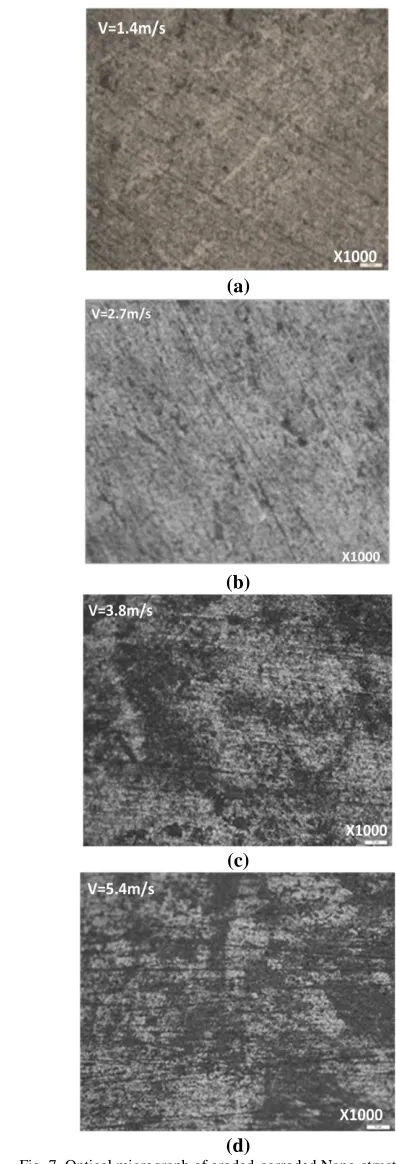
An optical microscopy investigation was carried out in order to study the eroded-corroded surfaces of Nano-structured pure copper at various flowing velocities. Fig.7 shows the surface degradation due to erosion corrosion attack. The photos indicate a formation of brittle corrosion products shown as cracks and pits. It is seen that, at low velocity (1.4m/s), the surface of sample has few small pits as shown in Fig. (7- a). After erosion corrosion at a velocity of 2.7m/s, it is seen that there is a slight wear deformation and small pits on the surface as shown in Figure (7-b). When the flowing velocity reached 3.8m/s there is some cracks in the surface and the eroded surface increased as shown in Fig. (7-c). At flowing velocity of 5.4m/s, bigger pits appeared in the surface shown as dark zones in Fig. (7-d).
IV. CONCLUSIONS
Nano-structured commercial pure copper samples were studied under different E-C conditions. Equal channel angular pressing (ECAP) process had been applied to produce the Fig. 6. Variation of weight loss per unit area with flowing velocity at
various impact angles
(Time=48hr and Sand concentration=20 wt%)
(a)
(b)
(c)
(d)
Fig. 7. Optical micrograph of eroded-corroded Nano-structured pure copper at various flow velocities
Nano-structured samples and Vickers hardness tests were performed at all ECAP passes. Based on the work described above, conclusions can be summarized as follows: with the increase of ECAP passes, the hardness of Nano-structured pure copper increases. After four passes, the hardness increased by ≈237% compared to initial material. Increasing of the slurry flow velocity and duration time results in increasing the weight loss per unit area of the Nano-structured pure copper. There is a significant effect of sand concentration on weight loss of the Nano-structured pure copper. Increasing sand concentration results in increasing weight loss per unit area. The maximum value of weight loss per unit area occurs at an impact angle of 45o, and then decreases with impact angels of 30o and 60o. The effect of impact angle on E–C depends on the combination of normal stress and shear stress. With the decrease of impact angle, shear stress becomes dominant and resulting in an increasing weight loss per unit area.
REFERENCES
[1] Yanlin Zhao, Fang Zhou, Jun Yao, Shigang Dong, Ning Li , Erosion corrosion behaviour and corrosion resistance of AISI316 stainless steel in flow jet impingement, Wear328-329(2015) 464– 474
[2] Osama Erfan, Al-badrawy, Fahad Al-mufadi, Erosion-Corrosion behaviour of AA 6066 Aluminium alloy, IJME, 3 (2014) 2319-2259
[3] Z. Kamid, P.H. Shipway, T. Voisey, A.J. Sturgeon, Abrasive wear behaviour of conventional and large particle tungsten carbide-based cement coatings as a function of abrasive size and type, Wear 271 (2011) 1264-1272.
[4] R.J.K. Wood, J.A.Wharton, A.J.Speyer, K.S.Tan, Investigation of erosion–corrosion processes using electrochemical noise measurements,Tribol.Int.35 (2002)631–641.
[5] Y. Zheng, Z.Yao, X.Wei, W.Ke, The synergistic effect between erosion and corrosion in acidic slurry medium,Wear186– 187(1995)555–561.
[6] V.A.D. Souza, A. Neville, Aspect of microstructure on the synergy and overall material loss of thermal spray coating in erosion-corrosion environment, Wear 263 (2007) 339-348.
[7] S. S. Rajahram, T.J. Harvey, R.J.K. Wood, “Erosion-corrosion resistance of engineering materials in various test conditions”, Wear 267, (2009), pp. 244-254.
[8] Copper Uses, Resources, Supply, Demand and Production Information, USGS Fact Sheets January 2014
[9] B. Jiang, S.L. Jiang, A.L. Ma, and Y.G. Zheng, Erosion-Corrosion Behaviour of Electroless Ni-P Coating on Copper-Nickel Alloy in 3.5 wt.% Sodium Chloride Solution, JMEPEG 2014 23:230–237. [10] ASTM G119, Standard guide for determining synergism between
wear and corrosion,( 2009).
[11] S S.S.ajahram, T.J.Harvey, J.C.Walker, S.C.Wang, R.J.K.Wood, Investigation of erosion–corrosion mechanisms of UNSS31603 using FIB and TEM,Tribol.Int. 46 (2012)161–173
[12] R.J.K. Wood, Erosion–corrosion interactions and their effect on marine and off shore materials, Wear 261(2006)1012–1023. [13] M. Abedini, H.M. Ghasemi, Synergistic erosion–corrosion
behaviour of Al–brass alloy at various impingement angles, Wear 319 (2014) 49 – 55.
[14] Y. Yang, Y.F. Cheng , Parametric effects on the erosion–corrosion rate and mechanism of carbon steel pipes in oil sands slurry, Wear 276–277 (2012) 141–148
[15] Hassani, Sh; Roberts, K P; Shirazi, S A; Shadley, J R; Rybicki, E F, Flow Loop Study of NaCl Concentration Effect on Erosion, Corrosion, and Erosion-Corrosion of Carbon Steel in CO2-Saturated Systems, Corrosion 68.2 (2012): G1-G9.
[16] Qin-Ying Wang , Shu-Lin Bai , Zong-De Liu, Surface Characterization and Erosion–Corrosion Behavior of Q235 Steel in Dynamic Flow, Tribol Lett (2014) 53:271–279
[17] J. Malik, I.H. Toor , W.H. Ahmed, Z.M. Gasem, M.A. Habib, R. Ben-Mansour and H.M. Badr, Investigations on the Corrosion-Enhanced Erosion Behavior of Carbon Steel AISI 1020, Int. J. Electrochem. Sci., 9 (2014) 6765 - 6780
[18] A. Sakamoto, T. Yamasaki, M. Matsumura, Erosion-corrosion tests on copper alloys for water tap use, Wear186 -187 (1995) 548-554
[19] X.Y. Li et al. Cavitation erosion and corrosion behaviour of copper–manganese–aluminium alloy weldment. Materials Science and Engineering 382 (2004) 82–89.
[20] Yue Zhanga, Roberto B. Figueiredob,c, Saleh N. Alhajerib,d, Jing Tao Wanga, Nong Gaob, Terence G. Langdonb,e, Structure and mechanical properties of commercial purity titanium processed by ECAP at room temperature, Materials Science and Engineering A 528 (2011) 7708– 7714.
[21] J.H. Li, Z.J. Yu, L.P. Zhang, Effect of Channel Inner Angle on Aluminium ECAP Plastic Deformation, Applied Mechanics and Materials Vol. 442 (2014) pp 27-31
[22] Farideh Salimyan Farda, Mohammad Reza Toroghinejada, , Fakhreddin Ashrafizadeha, Meysam Jafari, EBSD analysis of nano-structured copper processed by ECAP, Materials Science and Engineering A 528 (2011) 5348–5355.
[23] F. Al-Mufadi, F. Djavanroodi, “Effect of Equal Channel Angular Pressing Process on Impacting Property of Pure Copper”, International Journal of Chemical, Nuclear, Materials and Metallurgical Engineering Vol:8, No:1, 2014
[24] ASTM G31-72. In: Annual Book of Standards 1994, vol. 03-02.ASTM, 1994:102-108.
[25] F. Djavanroodi, M. Ebrahimi, B. Rajabifar, S. Akramizadeh. Fatigue design factors for ECAPed materials. Materials Science and Engineering A 528 (2010) 745–750
[26] Markus Liebhard and Alan Levy. The effect of erodent particle characteristics erosion of metals, Wear, 151 (1991) 381-390 [27] Yutaka Kameyamaa, Jun Komotorib, Effect of micro ploughing