A USER INTERFACE FOR BLOCK BASED
FEATURE EXTRACTION OF DIGITAL
IMAGES
P. Prathusha
1S. Jyothi
21 Professor, Dept. of Computer Science, Sri Padmavati Mahila University, Kurnool, AP, India. 2 Professor & IEEE Senior Member Dept. of Computer Science, Sri Padmavati Mahila University
Tirupati-517502, AP, India
Abstract : Recognition and classification of d i g i t a l i ma g e s involves a few steps like Image acquisition, Image Pre-processing, Image Enhancement, Feature Extraction, Feature Subset selection and lastly classification. Our research aims at the identification of crab and lobster species which involves all these steps. Feature extraction is a crucial step in identification of marine fauna. The results of classification are accurate and precise only if Feature extraction step is performed correctly. In this paper a novel method is modeled for feature extraction which divides the image into blocks and extracts the features of the blocks. Each block is treated as an independent entity and features are tabulated which are later used for classification. The novelty of Integrated approach lies in integrating block division, GLCM and texture features.
IndexTerms - GLCM, Texture properties, feature extraction, classification and Recognition.
I. INTRODUCTION
Commercial Marine Food Industry is one of the fastest and largest growing Industries in India. As coastal areas exist throughout the south part of the country, it is ever growing and demanding industry in India. The Marine food is supplied throughout the world from coastal areas of India. But automation of packaging the marine food is not yet completely implemented. We have developed a method to classify the marine fauna. The steps involved to classify marine fauna are Image acquisition, Pre- processing, Image Enhancement, Image Segmentation, feature Extraction, feature subset selection and Image Classification. Pre-Processing involves the removal of Noise from Images. This paper introduces a novel method for feature extraction using block based division of the images and integrating texture and Gray Level Co-occurrence Matrix features. The method proves to be efficient in classifying marine species or any digital images
II. LITERATUREREVIEW
Feature Extraction, Feature selection [1] [13] and its applications are introduced in [2][3]. Texture features are discussed in many research papers such as [3][4][5]. Texture features are discussed first in [6][8][11]. Gray level Co-Occurrence Matrix
GLCM is discussed in [7][12]. K Manikantan et.al [14] proposed a novel method Block-Based Discrete Cosine Transform (BBDCT) for feature extraction where in each 8X8 DCT block is of adequate size to collect the information within that block without any compromise. 2D-DCT is applied to the blocks of 8x8 to result in 64 coefficients. The 64 coefficients thus obtained per block are arranged in a matrix of size 8X8 in raster scan order. The first coefficient in this matrix is known as the DC component, representing the average intensity of an image, while the rest are the AC coefficients corresponding to high frequency components of the image. Classification accuracy is achieved using this method. This paper [15] proposed a Content Based Image Retrieval System using Overlap technique based on Fusion of Gabor Filter’s Response and Modified Modified Block Truncation Coding MBTC of an image. The superiority of the system is because of the Gabor feature gives good response to texture of the image and Modified BTC give good response to color content of image. This paper [3] says that feature relevance alone is inefficient but feature redundancy analysis also necessary for efficient feature extraction. A new framework was introduced that decouples relevance analysis and redundancy analysis. This paper [16] developed a correlation-based method for relevance and redundancy analysis. The approximation method for relevance and redundancy analysis is realized by an algorithm, named FCBF (Fast Correlation-Based Filter). A new image feature extraction method based on the statistical analysis in the wavelet domain was developed for content-based image retrieval (CBIR)[17] . A two component Gaussian mixture model was developed to describe the statistical characteristics of images in the wavelet domain. The model parameters are
i=0
i=0
III. PROPOSEDMETHOD
Block Based Feature Extraction using glcm texture properties
Dividing the image into blocks and extracting features has good advantages. It suits to the morphological structure of the image for our application.
We have proposed a novel block based Texture and GLCM Integrated Algorithm (BBTGI)
Load the Image in the User Interface designed for feature Extraction
Resize the image size to 256 X 256
Convert the Image in HSV Image
Divide the image into blocks(here 9 blocks)
Treat each block as an independent entity and save to image database
We get various parts of the marine fauna like legs, body, etc.
Extract features of each block using the texture features and GLCM features.
Features can be tabulated in to the database
Input Test Image and compare the features of the test image with the features of the images in the database
Similarity measures are used for comparision. Then apply classification algorithm to classify the image.
The texture properties retrieved are
A.Texture Features :
Mean:
The mean takes the average level of intensity of the image or texture.
µ=1/N ∑G−1 i p(i) (1)
Standard deviation:
σ = sqrt(1/N ∑G−1(i − μ)2 p(i) (2)
Variance: The variance describes the variation of intensity around the mean
σ2 = 1/N ∑G−1(i − μ)2 p(i) (3)
i=0
Skewness: Skewness is zero if the histogram is symmetrical about the mean, and is otherwise either positive or negative .Thus μ1 is an indication of symmetry.
μ1 = σ−3 ∑G−1(iμ)3p(i) (4)
i=0
GLCM – Gray Level Co-occurrence Matrix:
GLCM is a second order statistics used for texture analysis. The texture is described by a matrix of a pair of gray level probabilities [12]. The probability of co-occurrence for gray levels m and n for two pixels with a defined spatial relationship in an image is calculated in terms of distance d and angle ѳ [12]. A GLCM matrix Pd(i,j) is defined by specifying the displacement
vector d = (dx,dy) and counting all the pairs of pixels separated by d which has gray levels i and j. The GLCM is defined as nij is
the number of co-occurrence of pixel values (i,j) lying at a distance d and angle ѳ in the image.
Pd(i,j) = nij (5)
Energy, Contrast, Correlation, Homogenity , Auto correlation , Dissimilarity and Inertia are extracted. Some of them are defined below.
Contrast: It is also known to be variance and inertia. It will measure the local variations in GLCM matrix, gray level co-occurrence matrix. The return value is a measure of intensity contrast for a pixel and its neighbouring pixel in the entire image. It has a value of zero for constant image.
Contrast = (6)
Correlation: It will Measure the joint probability occurrence of the specified pixel pairs.
Correlation = (7)
Energy: Provides the sum of squared elements in the GLCM. Also known as uniformity or the angular second moment.
Energy = (8)
Homogeneity: Measures the closeness of the distribution of elements in the GLCM to the GLCM diagonal.
Homogeneity = (9)
Entropy: The entropy is a measure of histogram uniformity.
Entropy = (10)
.
IV. RESULTSANDDISCUSSION
The Experimental results are shown in the Figure 1,2,3,4 &5,6,7,&8. Figure 1 shows the GUI Interface prepared in matlab. The specialty of this Interface is it can be used for any Image processing application for feature extraction.
Figure.1. User Interface for feature extraction
Figure.2. Division of blocks of a crab Image
Figure.3. Properties of block1
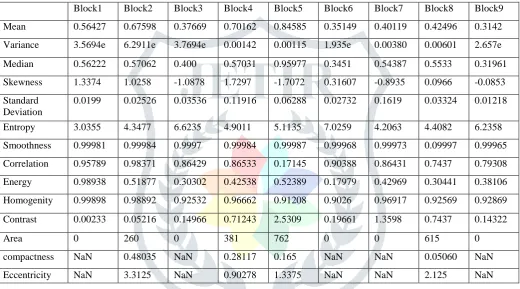
Figure 4. Properties of block1 to block 9
Block1 Block2 Block3 Block4 Block5 Block6 Block7 Block8 Block9
Mean 0.56427 0.67598 0.37669 0.70162 0.84585 0.35149 0.40119 0.42496 0.3142
Variance 3.5694e 6.2911e 3.7694e 0.00142 0.00115 1.935e 0.00380 0.00601 2.657e
Median 0.56222 0.57062 0.400 0.57031 0.95977 0.3451 0.54387 0.5533 0.31961
Skewness 1.3374 1.0258 -1.0878 1.7297 -1.7072 0.31607 -0.8935 0.0966 -0.0853
Standard Deviation
0.0199 0.02526 0.03536 0.11916 0.06288 0.02732 0.1619 0.03324 0.01218
Entropy 3.0355 4.3477 6.6235 4.9011 5.1135 7.0259 4.2063 4.4082 6.2358
Smoothness 0.99981 0.99984 0.9997 0.99984 0.99987 0.99968 0.99973 0.09997 0.99965
Correlation 0.95789 0.98371 0.86429 0.86533 0.17145 0.90388 0.86431 0.7437 0.79308
Energy 0.98938 0.51877 0.30302 0.42538 0.52389 0.17979 0.42969 0.30441 0.38106
Homogenity 0.99898 0.98892 0.92532 0.96662 0.91208 0.9026 0.96917 0.92569 0.92869
Contrast 0.00233 0.05216 0.14966 0.71243 2.5309 0.19661 1.3598 0.7437 0.14322
Area 0 260 0 381 762 0 0 615 0
compactness NaN 0.48035 NaN 0.28117 0.165 NaN NaN 0.05060 NaN
Eccentricity NaN 3.3125 NaN 0.90278 1.3375 NaN NaN 2.125 NaN
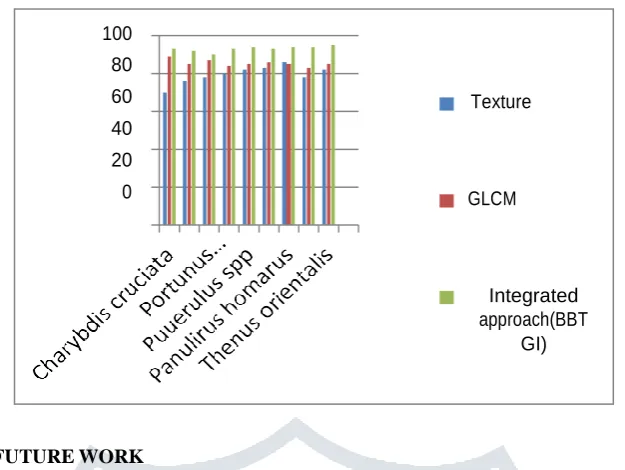
Figure 5 shows the classification accuracy using SVM classifier and Naïve Bayes classification. It shows the texture alone, GLCM alone and Integrated block based approach. The final conclusive statements can be clearly drawn from Figure.8. The graph in figure8 shows how texture alone and GLCM alone have less recognition rate. The Graph clearly shows the recognition rate is higher for Integrated approach of using Texture, GLCM and division of blocks investigated for marine species.
Texture GLCM Integrated block based approach
SVM classifier 80 % 88 % 95%
Naïve Bayes classification 85% 87 % 96%
100
80 60
40
20
0
Texture
GLCM
Integrated approach(BBT
GI)
Figure. 6. . Graph showing the recognition rate of each species using 3 approaches
V. CONCLUSIONANDFUTUREWORK
We have investigated on various marine fauna . The results clearly prove that Texture properties alone have less recognition rate. Similarly GLCM alone cannot distinguish the marine species. The Integrated block based approach proposed in this paper give good classification accuracy for SVM Classifier and Navie Bayes Classifier
REFERENCE
[1] Vipin Kumar and Sonajharia Minz Feature Selection: A literature Review Smart Computing Review, vol. 4, no. 3, June 2014.
[2] Guyon and Elisseeff. An introduction to variable and feature selection. Journal of Machine Learning Research, 2003.
[3] Isabelle Guyon, Steve Gunn, Masoud Nikravesh and Lofti A Zadeh . Feature extraction :foundations and applications, volume 207, Springer, 2008.
[4] Anuradha.K, Dr. K. Sankaranarayanan Statistical feature Extraction to classify oral cancers Volume 4, No. 2, February 2013 Journal of Global Research in Computer Science RESEARCH PAPER Available Online at
www.jgrcs.info
[5] K. Shanmugam R. M. Haralick and I. H. Dinstein, “Textural features for image classification” IEEE Transactions on Systems, Man and Cybernetics 3 (1973), 610 – 621
[6] www.igi-lobal.com/chapter/review-texture-feature- extraction description
[7] M.Harsha vardhan et.al International Journal of Advanced Research in Electronics and Communication Engineering (IJARECE) Volume 3, Issue 1, January 2014 GLCM Architechture for Image Extraction
[8] Mihran Tuceryan and Anil K. Jain Texture Analysis The Handbook of Pattern Recognition and Computer Vision (2nd Edition), by C. H. Chen, L. F. Pau, P. S. P. Wang (eds.), pp. 207-248, World Scientific Publishing Co., 1998.
[9] K.Jyothi “ Multi modal face recognition using block based curvelet features” International Journal of Computer Graphics and Animation (IJCGA) vol 4. No.2. April 2014.
[10] Moujahid et.al “Feature Extraction using block based Local Binary pattern for face recognition. “ Electronic Imaging, Intelligent Robots and Computer vision XXXIII: Algorithms and Techniques.PP.1-6(6).
[11] SushilaShidnal A texture feature extraction of crop field images using GLCM approach International Journal of Science Engineering Technology,IJSEAT, Issue 12 Volume 2 , ISSN 2321-6905 December-2014.
[12] https://in.mathworks.com/help/images/gray-level-co-occurrence-matrix-glcm.html
[13] Muhammad Arif Mohamad and Dewi Nasien “ A Review on Feature Extraction and Feature Selection for Handwritten Character Recognition International Journal of Advanced Computer Science and Applications, Vol. 6, No. 2, 2015 www.ijacsa.thesai.org
[14] K Manikantan et.al “Face Recognition using Block-Based DCT Feature Extraction “.Journal of Advanced
Computer Science and Technology, (2012Pages 266-283 @ Science Publishing
Corporation,www.sciencepubco.com/index.php/JACST.
[15] International Journal of Computer Applications (0975– 8887) Volume 28– No.7, August 2011 Sinora Banker [16] Ghosalkar et.al. “ Feature Extraction using Overlap Blocks for Content based Image Retrieval.
[17] Yu, Lei, and Huan Liu. "Efficient feature selection via analysis of relevance and redundancy." Journal of machine learning research 5.Oct (2004): 1205-1224.
[18] Yuan, Hua, Xiao-Ping Zhang, and Ling Guan. "A statistical approach for image feature extraction in the wavelet domain." CCECE 2003-Canadian Conference on Electrical and Computer Engineering. Toward a Caring and Humane Technology (Cat. No. 03CH37436). Vol. 2. IEEE, 2003.