Max-1: Algorithm for Constructing Tree Topology for
heterogeneous networks for Peer-To-Peer Live Video
Streaming
Ammar Waysi AlTuhafi
Cihan University/Sulaimaniya [email protected]Abstract— Peer-to-peer (p2p) systems is a good and cheep
alternative for traditional server-client system to providing video streaming for huge number of users; the topology is the one of most important part of these systems. Tree topology is widely used to be the backbone of p2p live video systems in networks’ research or in local networks, mostly in this topology every peer (except leafs) has same number of children peers. This study proposed an innovative algorithm to determine the maximum capacity of children peers based on the farther peer bandwidth and make Max-1 topology applicable in heterogeneous global networks, Max-1 shows 12% better performance than ideal tree topology (guided by human).
Index Term— peer-to-peer; p2p; tree topology; video streaming; IPTV;
I. INTRODUCTION
A peer-to-peer (p2p) network is a network built over the physical network. Hence, the p2p network uses physical network routing and forwarding functions. In a p2p network, peers cooperate to provide services to each other; thus, peers are simultaneously clients and servers. This is the main difference of this system from a server-based system, wherein centralized servers provide services to clients [1, 2].
P2p networks are usually built in the application layer. Peers in the p2p network are connected via logical links, and the link between two peers may take several hops in the physical network. These links between peers construct the path of the payload direction in the p2p network called the p2p network topology [3].
A p2p network is formed by choosing a subset of physical network nodes. The connection between these subset nodes are peer links. The links between peers have different methods and procedures of selection. This has an impact on p2p network quality and performance. These links comprise the so-called p2p network topology. Choosing a connection link between peers in the p2p network is usually done using information obtained from the physical network. This is used to construct the p2p network topology. P2p network topology can be divided into two main types: unstructured and structured topologies [4].
In unstructured topology peers can join and leave with usually some determinants like sending request to joining and
leaving and selecting its neighbors, as an unstructured p2p network does not require information on the physical network [5] the most popular type of unstructured topology is mesh topology. An unstructured p2p network is based on a random graph to choose the connection for each peer; the most common topology in unstructured p2p network is the mesh topology [6]. The structured topology is tightly controlled, and there is no randomization in peers’ arrangement. Each peer is organized into a structured graph and each peer registers with serves, providing information that is required by the server, the most famous and useable type of structured topology is tree topology, tree topology is the best example of structured topology [7, 8].
II. TREEO TOPLOGY
Tree topology is a structured topology wherein peers participating in live video streaming session form a tree structure at the application layer, with the video source server acting as the root of this tree. Every peer in this tree becomes a part of a certain level. In tree topology, each peer receives the video from its parent peer at one level above and forwards the received video to its children peers at one level below [9]. Figure 1 shows the tree topology.
some algorithms exist for constructing this type of topology, putting every peer in the suitable level, and choosing the parent and children. All these algorithms attempt to decrease the levels of the tree by increasing the number of peers per each level [10]. The reason behind the reduction of the tree levels is to reduce the number of hops taken by the chunks, and thus reduce video delay, especially at lower levels [11].
There few techniques have been proposed to solve peer joining and leaving issue; in peer joining there are the following techniques:
All peers in the network have constant maximum number of children; every joining peer try to connect to peer has children less than the maximum number of children.
The joining peer try to connect with peer has the most similar bandwidth [12].
Fig. 1. Tree topology
Tree topology is usually used for scientific applications or for small number of peers in limited geographical area when peers resources and assigning jobs to peers can be easy to estimated, otherwise, using tree topology in large scale of peers or with wide geographical area make discovering peers’ resources and dealing with peers joining and leaving issues unmanageable [13]. Therefore, some studies used fixed number of children peers for each parent peer in the network [14].
The majority of p2p systems existing nowadays used mesh topology such as PPLive [15], SopCast [16], PPStream [17], etc. This study proposed innovative algorithm for constructing tree topology for heterogeneous networks, and make this type of topology applicable in large scale.
III. MEHTODOLOGY
There are two main parts of the network, video source server and peers. To constructing the proposed topology few steps has been taken for each part of this network and they are.
Initialize the network and server.
Calculate peers’ maximum capacity to provide video streaming to other peers based on video bitrate. Allocate the joined peer in a suitable position within
the network.
Establish connection between joined peer, preferably father peer and children peers.
Sort network peers; the fastest peers are allocated at level 1 and the second fastest peers at level 2 and so on, until the slowest peers are allocated at the bottom level on the tree topology.
A. Peer-To-Peer Network Server and Initialization
p2p network initialization is also called p2p network bootstrapping. In this step we consider the video source server the only peer at the first level of the tree (level 0); the server represents the root of the network tree, whereas the server does not like other peers in this network because it only sends the video payload without receiving it. The other task of the server is to manage the whole network and its structure and
save all information of peers’ resources; this information will be saved in distributed hash table (DHT) in the server itself.
B. Connections of Joined Peers
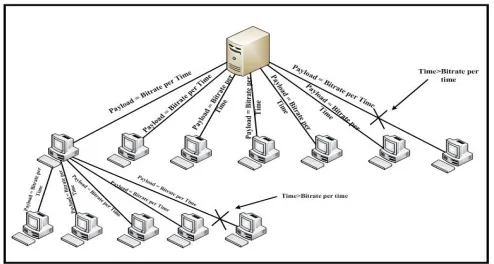
After initializing the video source server, peers will try to join the network. The proposed topology depends on locating every peer to a suitable place in the network so as to use the maximum bandwidth of the peer. Every peer in the proposed methodology tries to connect with a peer who has the highest bandwidth and has enough space in remaining upload bandwidth to deliver video streaming to another child. The father peer can accept any number of children peers in as much as a father peer can send the same packet with “T” period of playing video to all its children within T time, where T is a constant period of time. In other words, if we take a T=1 second, with 300Kbps video bitrate of video live streaming, then the packet sends from father peer to its children equal 300Kb (or 37.5 KB) for each child peer in one second.
The procedure to find maximum capacity of children peers for each father peer is achieved by sending the packet with a size equal to video bitrate per second; if the packet delivered for all children peers within one second time, another peer will join the father peer and become another child. Adding new children will continue until the time of servicing children by sending video chunk is longer than one second, then the connection between last child and father will be disconnected; the figure 2 illustrates this procedure.
Fig. 2. Connection of the joining peers
In figure 2 we assume that the server at level 0 has six peer capacity as children at level 1; this server can provide six peers with a video bitrate at level 1. Actually, these peers have been added one by one, and after adding each peer, there is a checking operation to test father ability peer every time and every peer at level 1. Checking here refers to bandwidth checking which is done by calculating the remaining bandwidth after each addition. We use the round time tripe (RTT) method to do this checking; the packet size we use in RTT is equal to video bitrate per second.
with bitrate size within one second, another peer can be added, otherwise the last peer added will be disconnected and will connect with another father. The remaining peers represent the maximum capacity of father peer, and the numbers of children peer will have no changes.
C. Rearranging Peer Positions
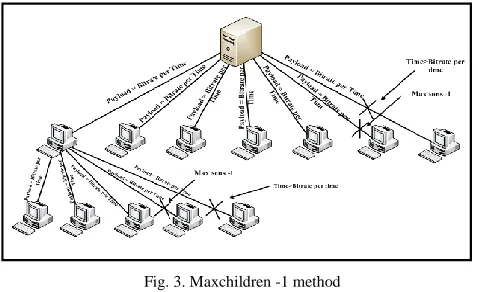
After calculating the maximum children peers’ capacity for each peer on the p2p network, there will be a disconnection between the father and its lowest bandwidth son, and then the number of children for each peer will be less by one than its maximum capacity (Maxchildren-1). The purpose behind keeping the number of children for each peer less than a maximum is to use the remaining bandwidth for rearranging the peers' position in the network without affecting the delivery of the video chunks to its children peers. Figure 2 shows the procedure of calculating the maximum number of children; the final number of children will be less than one peer. Figure 3 shows the final number of the children peers.
Fig. 3. Maxchildren -1 method
The purpose of rearranging the peers on the network is to make the highest bandwidth peers (super peers) at level 1, where they will be the children of the video source server at level 0 and the second highest at level 2 and becomes the children of peers at level 1, etc. This arrangement of the peers is based on their bandwidth which has a big effect on reducing the delay of the video to the minimum, whereas the delay is the most important issue in video live streaming and the most important parameter to evaluate the performance on the p2p video live systems.
The peers rearranging operation looks like integer number sorting; these numbers represent the RTT between each two peers; peers sorting will start when every peer tries to join the network. During network bootstrap, the first group of peers connects direct to the video source server constructing level 1 of the network. When more peers join the network there are often some peers in the network faster than some or all peers at level 1; the delay in video chunk delivery at upper levels cause a delay in the entire network, while the delay at lower levels cause a delay at only these levels; therefore, placing fastest peers at the top level near the video source server will improve the whole network performance and reduce video delivery delay to the minimum.
The purpose of rearranging the peers on the network is to make the highest bandwidth peers (super peers) at level 1, where they will be the children of the video source server at level 0 and the second highest at level 2 and becomes the children of peers at level 1, etc. This arrangement of the peers is based on their bandwidth which has a big effect on reducing the delay of the video to the minimum, whereas the delay is the most important issue in video live streaming and the most important parameter to evaluate the performance on the p2p video live systems.
In this study, the peers rearranging operation looks like integer number sorting; these numbers represent the RTT between each two peers; peers sorting will start when every peer tries to join the network. During network bootstrap, the first group of peers connects direct to the video source server constructing level 1 of the network. When more peers join the network there are often some peers in the network faster than some or all peers at level 1; the delay in video chunk delivery at upper levels cause a delay in the entire network, while the delay at lower levels cause a delay at only these levels; therefore, placing fastest peers at the top level near the video source server will improve the whole network performance and reduce video delivery delay to the minimum. The flowchart in figure 3.4 explains the procedure we follow to sort peers on the network which can be summarized in the following steps:
When a group of peers becomes children to a father peer, a father peer will save information about each one of its children peers; this information is about the bandwidth between each child with its father and if these children peers are the maximum capacity of the father peer or not.
When a new peer joins the network, this peer will apply RTT method between itself and video source server afterwards and continue doing RTT with every peer at all levels one by one from the upper level to the lower level. The purpose of applying RTT between the joined peer and other peers is to search for a suitable place for the joined peer, which can improve the performance of the whole network; if the joined peer during its search finds a suitable position, then searching will be stopped and the joined peer will be connected with the peer who gives better RTT- the joined peer will be child of the other peer (father peer). Applying RTT between new joined peer and all the peers in the network will happen only with the first hundred of the network peers; thereafter, a well known artificial intelligence algorithm called “greedy algorithm” will be applied to reduce the time needed to find the suitable position [18, 19].
and disconnect it. Later, the peer with the lowest bandwidth will be the new joined peer and start search operation for new suitable operation.
The disconnecting peer will not really disconnect from its father peer until it finds its new suitable position and connects with another father; this method allows peers to change their positions in the network with continuous video streaming.
Calculating the maximum number of children for each peer will be achieved by the same method as explained in section 2.2 and the maximum number of children for each peer is Maxchildren-1.
If the disconnected peer has children peers, these peers will be children peers of the new joined peer to make video streaming continuous.
Based on the above, we can understand why we need to reduce the children peer number to maximum minus one (Maxchildren-1); there are four benefits to this number of peers:
To save space of the changeable peer bandwidth; the bandwidth of any peer is not stable, although most of these changes are not so big, there is some probability that some peers have large changes in its bandwidth; this peer bandwidth will be reduced significantly and the bandwidth reductions will affect the video delivery time and produce needs for more than T time to deliver video streaming to all children peers.
To use the space of the remaining bandwidth to avoid local bottleneck problems during applying RTT from the joined peer in peers rearranging operation.
To allow the peer who should disconnect (when father peer exceeds maximum children peer) to apply RTT and find new suitable position in the network but still receive video streaming from father peer at the same time
IV. IMPLEMENTATION AND RESULTS
A. Testing Environment
The implementation environment contained from one hundred computers, and one server as a video source in the NAv6 network. Each computer (peer), has different bandwidth than others; using “Net Limiter” software to control to the bandwidth and produce peers with high diversity in bandwidth [20]. There are two different video types has been used in the experiments, these video types have different bitrate, the video bitrates has been used in implementation are: 250Kbps, 400Kbps.
The same environment of the implementation has applied for pure tree topology; to compare the results. The tree topology that has been used in this study is ideal tree topology whereas each father peer has maximum number of children peers (guided by human to get best results), this type of tree topology is ideal and most of tree topology based on constant number of children peers, this ideal tree topology has been used in this study because this type of tree topology gives the
best results of broadcasting vide which. Therefore, this type of tree topology gives this study more challenge. Two parameters have been considered, the delay of video chucks and the number of chunks hops for each peer.
The numbers of video chunk hops calculated by the following equation:
Whereas NoPLk means the number of peers in the level k and n represent the number of network level.
The average of the delay of video chunks for each peer can be calculated according to the following equation:
Average delay chunks for peeri =
Where n represent the number of video chunks.
As mentioned before the testing environment contained from one video server and 100 peers, by using Netlimiter software, the bandwidth of server and peers has been managed to construct three networks; slow, medium, and fast network. The upload bandwidths of the peers are bigger than zero and less than 40% of server uploads bandwidth.
0 < Peer upload band width < 0.4*server bandwidth
The bandwidth of peers divided to eight categories each level contained of number of peers as shown in Table 1. Whereas, peers in category 1 are slowest peers with bandwidth less than the video bitrate and peers in category 8 are fastest peers with bandwidth between 35-40% of the video server. The bandwidth of the peers in the network has been chosen randomly between these two values, this categories has been derived from.
TABLEI
THE NUMBER OF PEERS IN EACH LEVEL IN THE TESTINGNETWORK
Category Number of Peers
1 5
2 10
3 15
4 20
5 20
6 15
7 10
8 5
The first network (slow network), has video server with upload bandwidth 4Mbps, whereas the values of bandwidth between 1760Kbps and 136kbps.
The second network (medium network), has video server with upload bandwidth 6Mbps, whereas the values of bandwidth between 2400Kbps and 200Kbps.
Finally third network (fast network) has video server with upload bandwidth 8MB, whereas the values of bandwidth between 3200Kbps and 400Kbps.
Each network has been tested with 250 and 400 Kbps video bitrate. In each experiment the peers joining sequence has been chosen randomly.
B. Experiments Results
The experiments result has been gained by each network tested by the two types of video bitrate and evaluate according bandwidth usage, number of video chunks hops, and video chunk delay.
1) Network 1 with 250KbpsVideo Bitrate Streaming: The first scenario of experiments is using video streaming with 250Kbps of video bitrate in network 1. Number of hops in any p2p network is always based on the levels; therefore reduce the number of the levels in any topology leads to reduce the number of cunks’ hops, which has major effect in network performance. Figure 4 shows number of levels of Max-1 and tree topologies in this scenario.
Fig. 4. Number of levels and their number of peers in network 1 with 250Kbps video streaming
The Max-1 topology shows better performance in term of topology levels by reducing number of peers in level 3 to 25% comparing to tree topology.
The number of hops for one chunk can be calculated by equation 1, as shown in table 2, moreover, the number of hops for all chunks during providing video time equal the number of hops for one chunk multiply by the number of video chunks during video providing time as shown in table 2.
TABLEII.
NUMBER OF CHUNK HOPS IN NETWORK 1 WITH 250KBPS VIDEO STREAMING
The Max-1 topology shows 13.7% better performance than tree topology in term of number of hops, this good performance belongs to Maxchildren – 1 method. Table 5.2 shows the chunk hops for chunks during video providing time has same increasing ration comparing to Max-1 topology and tree topology, because both of the topologies used same size of video chunk.
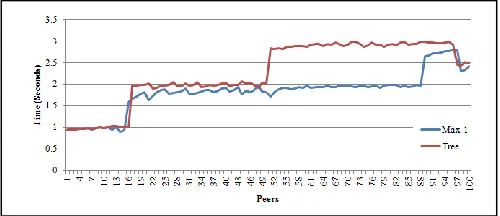
The other factor of the topology evaluation, is to evaluate the performance of the Max-1 topology is chunk delay time, figure 5 shows the average delay time of chunks delivery in each peer in the network for Max-1 and tree topology for 1000 second of video streaming.
Fig. 5. Chunks delay average in network 1 with 250Kbps video streaming
In this experiment Max-1 topology shows that has about 19% over all better performance comparing to regular tree topology performance. The delay average in Max-1 topology has better performance than tree topology because the number of peers in level 3 in Max-1 topology less than tree topology, which leads to reduce the delay time as normal results of reducing number of the chunks hops in level 3.
2) Network 2 with 250KbpsVideo Bitrate Streaming: The second scenario of experiments is using video streaming with 250Kbps of video bitrate in network. The number of levels of the Max-1 and tree topologies in this scenario shows in figure 6.
Fig. 6. Number of levels and their number of peers in network 2 with 250Kbps video streaming
In this scenario, both Max-1 and tree topology has two levels, this similarity of number of levels happened because the tree topology has good performance when peers in the network has high bandwidth comparing to video bitrate. The
Max-1 Tree
One chunk All chunks One chunk All chunks
results of number of hops of video chunks shown in table 3, these results has been calculated by equation 1, table 3 also shows the number of hops for all chunks during providing video time.
TABLEIII
NUMBER OF CHUNK HOPS IN NETWORK 2 WITH 250KBPS VIDEO STREAMING
The high bandwidth for the peers in the network comparing to video bitrate is perfect conditions for tree topology, this conditions leads tree topology to has only 0.56% better performance than Max-1 topology in term of number of chunks hops, because using Maxchildren – 1 method reduce one peer in level 1 and added this peer to level 2.
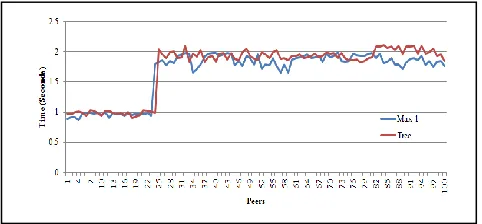
Fig. 7. Chunks delay average in network 2 with 250Kbps video streaming
In this scenario Max-1 topology performance become more similar to tree, because the difference become bigger between video bitrate and peers. Max-1 topology has 3.77% overall better performance comparing to tree topology in term of average chucks delay time.
3) Network 3 with 250KbpsVideo Bitrate Streaming: The third scenario of experiments is using video streaming with 250Kbps of video bitrate in network 3, this network considered as network with peers with high bandwidth. Figure 8 shows number of levels for both topologies.
Fig. 8. Number of levels and their number of peers in network 3 with 250Kbps video streaming
Similar to previous scenario Max-1 and tree topology both of them have two levels only and Max-1 topology have one
peer less than tree topology in level 1 and one peer more in level 2, Max-1 topology acts like a tree topology because the big difference between peers bandwidth and video bitrate, based to these number of level of the both topologies, table 4 shows the number of hops for this scenario.
In this scenario shows tree topology has 0.59% better performance than Max-1 topology, because using Maxchildren – 1 method as mentioned before. Figure 9 shows chunks delay for this scenario.
TABLEIV
NUMBER OF CHUNK HOPS IN NETWORK 3 WITH 250KBPS VIDEO STREAMING
Fig. 9. Chunks delay average in network 3 with 250Kbps video streaming Figure 9 shows the result of chunks delay of the Max-1 topology comparing with regular tree topology, as mentioned before, the value of delay here for each peer represent the average delay for all video chunks for this peer through 1000 seconds. As scenario two, chunks delay in Max-1 topology become similar to tree topology with 3% overall better performance for Max-1 topology, tree topology has best performance with peers have high bandwidth, Max-1 topology works as organized tree topology because the effecting of the small size of the video bitrate comparing the most of peers’ bandwidth.
4) Network 1 with 400KbpsVideo Bitrate Streaming: In this scenario a new video bitrate comparing to the previous three scenarios has been used, this bitrate is 400Kbps; in this scenario network 1 has been used to broadcast the video streaming. Figure 10 shows number of levels in Max-1 and tree topologies.
Fig. 10. Number of levels and their number of peers in network 1 with 400Kbps video streaming
Max-1 Tree
One chunk All chunks One chunk All chunks
177 177000 176 176000
Max-1 Tree
One chunk All chunks One chunk All chunks
In this scenario Max-1 topology has three levels, while tree topology contained from four levels; applying Max-1 topology in slow network with bigger video bitrate shows the high performance of this topology and increase the differences between Max-1 topology and tree topology. The number of chunks hops shows in table V.
TABLEV
NUMBER OF CHUNK HOPS IN NETWORK 1 WITH 400KBPS VIDEO STREAMING
Max-1 topology shows high performance in term of reduce number of hops of video chunks, the usage of high bandwidth peers and located it in first level reduce number of levels and number of video chunk hops as well, Max-1 topology has 20.78% overall better performance comparing to tree topology. For chunk delay diagram, figure 11 shows it for Max-1 and tree topologies.
Fig. 11. Chunks delay average in network 1 with 400Kbps video
In this scenario Max-1 topology has 24.17% overall better performance comparing to tree topology, this difference of the performance happened because Max-1 topology has three levels only while tree topology has four levels, which leads to more chunk hops and more delay as well.
5) Network 2 with 400KbpsVideo Bitrate Streaming:The second scenario for 400Kbps, is using this video bitrate streaming in network 2, figure 12 shows the number of levels in both of topologies in this scenario.
Fig. 12. Number of levels and their number of peers in network 2 with 400Kbps video streaming
In this scenario Max-1 topology and tree topology has three levels, although Max-1 and tree topology has same number of levels, Max-1 topology has less number of peers in level three, which cause to reduce number of chunks hops as shown in table 6.
TABLEVI.NUMBER OF CHUNK HOPS IN NETWORK 2 WITH 400KBPS VIDEO STREAMING
From the previous table, Max-1 topology has 8.08% better performance than tree topology. In this scenario, although both Max-1 and tree topology has same number of levels, Max-1 topology has more peers in level 2 and less peers in level three than tree topology, therefore Max-1 topology has less number of chunks hops in this scenario. In term of chunks delay figure 13 shows chunks delay in the both topologies as following.
Fig. 13. Chunks delay average in network 2 with 400Kbps video streaming
In this scenario Max-1 topology has 10% overall better performance comparing to tree, Max-1 topology has better performance over tree topology because Max-1 topology has less number of peers in level 3 than tree topology, which leads to reduce number of chunks hops and reduce chunk time delay as well.
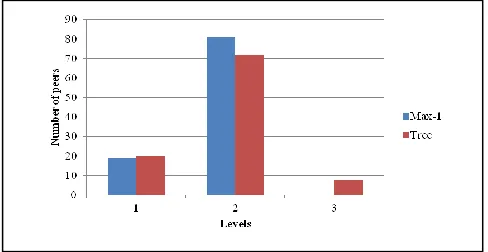
6) Network 3 with 400KbpsVideo Bitrate Streaming: The sixth scenario is using 400Kbps video bitrate with the fast network, the number of levels in both topologies can be shown in figure 14.
Fig. 14. Number of levels and their number of peers in network 3 with 400Kbps video streaming
Max-1 Tree
One chunk All chunks One chunk All chunks
216 216000 235 235000
Max-1 Tree
One chunk All chunks One chunk All chunks
Max-1 topology shows good performance in term of number of levels; Max-1 topology needs two levels to providing video streaming to all peers in the network, tree topology needs to three levels to broadcasting the video in the network, according to the levels table 7 shows number of chunks hops for both topologies.
TABLEVII
NUMBER OF CHUNK HOPS IN NETWORK 3 WITH 400KBPS VIDEO STREAMING
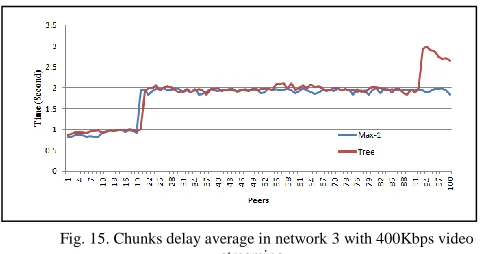
Max-1 topology shows 3.72% overall better performance than tree topology performance in term of chunks hops, although Max-1 topology has one level less than tree topology, Max-1 topology has only 3.72% better performance because there are only eight peers in level 3 in tree topology. Chunks delay average in this scenario shown in figure 15 as following for the three topologies.
Fig. 15. Chunks delay average in network 3 with 400Kbps video streaming
In this scenario Max-1 topology has 5.5% overall better performance comparing to tree topology; the small difference between Max-1 topology and tree topology belongs to there are only eight peers in level three of tree topology, and these types of fast network are very suitable for tree topology.
V. CONCLUSIONS
This research proposes innovative method to construct tree topology for p2p video live streaming called Max-1, the method based on two main factors; peers upload bandwidth and video bitrate, Max-1 topology shows flexibility and applicability in real world with heterogeneous networks, Max-1 topology has been tested in three types of networks with two types of video bitrates, and the results compared with ideal tree topology (guided by human to get best results); Max-1 topology shows 12% better performance than ideal tree topologyMAX-1 algorithm makes tree topology applicable for heterogeneous networks in any type and size of networks to video broadcasting, instead regular tree topology which was limited for local networks and academic use only.
REFERENCES
[1] Z. Dong, et al., "Study on topology design for large scale service overlay networks," in Wireless Communications, Networking and
Mobile Computing, 2009. WiCom'09. 5th International Conference on Wireless communications, networking and mobile computing, 2009, pp. 1-4.
[2] L. Yunhao, et al., "Location-aware topology matching in P2P systems," in INFOCOM 2004. Twenty-third AnnualJoint Conference of the IEEE Computer and Communications Societies, 2004, pp. 2220-2230 vol.4.
[3] A. W. AlTuhafi, "A Review on Peer-to-Peer Live Video Streaming Topology," International Journal of Computer Applications, vol. 68, 2013.
[4] Z. Li and P. Mohapaira, "The impact of topology on overlay routing service," in INFOCOM 2004. Twenty-third AnnualJoint Conference of the IEEE Computer and Communications Societies, 2004, p. 418.
[5] P. Hyojin, et al., "A Survey on Peer-to-Peer Overlay Network Schemes," in Advanced Communication Technology, 2008. ICACT 2008. 10th International Conference on Advanced Communication Technology (ICACT), 2008, pp. 986-988.
[6] D. Doval and D. O'Mahony, "Overlay networks: A scalable alternative for P2P," Internet Computing, IEEE, vol. 7, pp. 79-82, 2003.
[7] L. Eng Keong, et al., "A survey and comparison of peer-to-peer overlay network schemes," Communications Surveys & Tutorials, IEEE, vol. 7, pp. 72-93, 2005.
[8] A. T. Gai and L. Viennot, "Broose: a practical distributed hashtable based on the de-Bruijn topology," in Peer-to-Peer Computing, 2004. Proceedings. Proceedings. Fourth International Conference on Peer-to-Peer Computing, pp. 167-174, 2004, pp. 167-174.
[9] B. Hudzia, et al., "Treep: A tree based p2p network architecture," in In Cluster Computing, 2005. IEEE International (pp. 1-15). IEEE., 2005, pp. 1-15.
[10] Z. LianQing and L. Jun, "A Hybrid Clustering Model for Hierarchical Overlay Topology," in Natural Computation, 2009. ICNC'09., 2009, pp. 111-114.
[11] M. Amad, et al., "GPM: A generic and scalable P2P model that optimizes tree depth for multicast communications," International Journal of Communication Systems, 2008.
[12] H. Deshpande, et al., "Streaming live media over a peer-to-peer network," Technical Report, 2001.
[13] D. Castellà, et al., "A computing resource discovery mechanism over a p2p tree topology," in High Performance Computing for Computational Science–VECPAR 2010, ed: Springer, 2011, pp. 366-379.
[14] D. A. Tran, et al., "Zigzag: An efficient peer-to-peer scheme for media streaming," in In INFOCOM 2003. Twenty-Second Annual Joint Conference of the IEEE Computer and Communications. IEEE Societies (Vol. 2, pp. 1283-1292). IEEE., 2003, pp. 1283-1292.
[15] S. Spoto, et al., "Analysis of PPLive through active and passive measurements," in Parallel & Distributed Processing, 2009. IPDPS 2009. IEEE International Symposium on Parallel & Distributed Processing, 2009, pp. 1-7.
[16] I. Bermudez, et al., "Passive characterization of SopCast usage in residential isps," in Peer-to-Peer Computing (P2P), 2011 IEEE International Conference on Peer-to-Peer Computing, 2011, pp. 1-9.
[17] J. Jia, et al., "Characterizing PPStream across internet," in Network and Parallel Computing Workshops, 2007. NPC Workshops. IFIP International Conference on Network and Parallel Computing Workshops, 2007, pp. 413-418.
[18] K. A. Berman and J. L. Paul, Algorithms: sequential, parallel, and distributed: Thomson, 2005.
[19] J. Kleinberg and E. Tardos, Algorithm design: Pearson Education India, 2006.
[20] Netlimiter. (2012). NetLimiter - Ultimate Bandwidth Shaper. Available: http://www.netlimiter.com.
Max-1 Tree
One chunk All chunks One chunk All chunks