Abstract—Sorting and Classification of mango, there are different colors, weights, sizes, shapes and densities. Currently, classification based on the above features is being carried out mainly by manuals due to farmers' awareness of low accuracy, high costs, health effects and high costs, costly economically inferior. This study was conducted on three main commercial mango species of Vietnam to find out the method of classification of mango with the best quality and accuracy. World studies of mango classification according to color, size, volume and almost done in the laboratory but not yet applied in practice. The quality assessment of mango fruit has not been resolved. Application of image processing technology, computer vision combined with artificial intelligence in the problem of mango classification or poor quality. The goal of the study is to create a system that can classify mangoes in terms of color, volume, size, shape and fruit density. The classification system using image processing incorporates artificial intelligence including the use of CCD cameras, C language programming, computer vision and artificial neural networks. The system uses the captured mango image, processing the split layer to determine the mass, volume and defect on the mango fruit surface. Especially, determine the density of mangoes related to its maturity and sweetness and determine the percentage of mango defects to determine the quality of mangoes for export and domestic or recycled mangoes.
This article is about the development of an automatic mango classification system to control and evaluate mango quality before packaging and exporting to the market. It is in the research, design and fabrication of mango classification model and the completion of an automatic mango classification system using machine vision combining artificial intelligence.
Index Terms—The classification of mango, sorting of mangoes, image processing technology, artificial intelligence; computer vision, artificial neural networks.
I. INTRODUCTION
The process of grading mango in Vietnam and the world is being carried out mainly by the direct labor of farmers. In the process of surveying and accessing some agricultural classification systems, the mango classification system on the market is not available in Vietnam. So achieving low productivity, increasing costs. Surveying some of the currently used automatic or semi-automatic agricultural classification systems can be designed and made into a
Nguyen Duc Thong is with Dong Thap University, Vietnam (e-mail: [email protected]).
Nguyen Truong Thinh is with Ho Chi Minh City University of Technology and Education, Vietnam (e-mail: [email protected]).
Huynh Thanh Cong is with Bach Khoa Ho Chi Minh City University (e-mail: [email protected]).
mango classification system. Research and application of high-tech machinery in the process of producing agricultural products on the one hand reduce human labor, reduce costs, and otherwise meet high standards of food safety and hygiene in Processing in fastidious markets requires high quality.
Mango is a very sensitive agricultural product and can easily appear brown spots after being crushed during post-harvest handling, transportation and marketing. Testing of the fruit of this fruit used today cannot detect lesions at an early stage of adulthood and so far no automated tools are able to detect; studying the approaches and techniques to assess the quality of mango fruit, checking the surface of mango fruit with deep, wilting, spongy, deformed mangoes, ripening on mango fruit; application of image processing technology, computer vision combined with artificial intelligence in the problem of classifying mango fruit with or without quality.
Currently mangoes are classified by color, volume, size and shape. The quality of the mango fruit is only predicted by the eye of the classification and has not been studied for application. Case studies of mango classification such as Machine vision-based maturity prediction system for harvested mango classification [1] proposed a machine-based system to classify mangoes by predicting levels maturity to replace manual classification system. Prediction of ripeness was made from video signals collected by a CCD camera placed above the mango conveyor belt. The recursive feature removal technique combined with the vector-based support (SVM) classifier is used to identify the most relevant features of the original 27 selected features. Finally, optimal aggregation of the number of reduced features is obtained and used to classify mangoes into four different types according to maturity level; Tomas U. Ganiron Jr developed a size-based mango classification system using image analysis techniques [2]. This empirical study aims to develop an efficient algorithm to detect and classify mangoes. Using the obtained image, the features of the mango are extracted and used to determine the mango layer. The characteristics of the extracted mango are perimeter, area, roundness and defect rate; The mango classification system uses machine vision and Neural network [3] as a system that can classify ripe or unripe mangoes. The method used to carry out this study was split into several steps: object identification, algorithm development, implementation and evaluation. This system is implemented in C, Computer Vision and ANN (artificial neural networks) so that the system can detect the color of the ripe or unripe mangoes; The research team in Malaysia [4] proposed and implemented fuzzy logic algorithms and algorithms using digital image processing, predefined
Mango Sorting Mechanical System Uses Machine Vision
and Artificial Intelligence
Nguyen Duc Thong, Nguyen Truong Thinh, and Huynh Thanh Cong
content analysis and statistical analysis to determine real estate export of local mangoes in Perlis - Malaysia. This study is to design and develop an efficient algorithm to detect and classify mangoes at 80% accuracy compared to human classification. All studies are mostly done in laboratories, with certain results in the exploitation of specific classification features, with a high classification result in color, volume and size. However, the quality of the mango has not been assessed, but it has been put into practical applications. The studies [5]-[12] mentioned the application of image processing and artificial neural networks with different treatments for fruits, vegetables, fruits and other foods and for certain results in research assist.
The study, design and manufacture of mango classification system to control and evaluate the quality of mango fruit (according to GAP standards) before being packaged and exported to the market: mangoes are harvested at the right level. ripening, size, shape, eliminating fruits withered, deep, deformed. More specifically, "the application of computer vision and image processing technology combined with artificial intelligence to identify patterns and evaluate the quality of mango fruits" in order to enhance automation in agricultural production in our country.
II.METHODS AND TECHNIQUES USED TO STUDY Mango is a tropical fruit tree, ripe mango is yellow or green attractive, sweet and sour, delicious smell. Ripe mangoes are eaten fresh, canned, juice, jam, ice cream, dried for domestic consumption or export. More important is the ripeness and density of mangoes because this is a decisive factor to the ability of mango products to be consumed and this is a complex and difficult classification problem for mango today. Mango is a tropical fruit tree, ripe mango is yellow or green attractive, sweet and sour, delicious smell. Ripe mangoes are eaten fresh, canned, juice, jam, ice cream, dried for domestic consumption or export.
Apart from the characteristic color, weight, size, shape and bruises damaged to determine mango quality, the most important factor to determine mango quality is the proportion of mangoes. The proportion of mangoes is also understood as the maturity or age of mangoes, it is related to the date of harvest of mangoes. According to international standards, currently the proportion of mangoes ranging from 1.0 to 1.1 is the best quality mango. And currently this factor has not been studied because it is difficult to handle mangoes to determine the density, so this study will be mentioned to solve this problem.
The shooting process involves capturing a color image (RGB) and performing a depth measurement (D), which is combined in different ways to form other colors on a pixel, the intensity of Each color can vary from 0 to 255 and produce 16,777,216 different colors. Image sensors combined with depth sensors are located close to each other, allowing merging maps, producing 3D images. RGB-D image information is stored. The study was conducted through the following steps:
1) Identify research issues from the actual situation, survey how to classify mangoes at home and abroad. An
overview of domestic and foreign studies, understanding the existing mango classification systems as well as a survey of the design and design of mango classification system.
2) Learn the local mango assessment and classification criteria. Develop classification methods, arrange classification stages accordingly based on actual surveys. Conduct an analysis of appropriate options, less error-prone methods and best results. Design classification model to meet the required objectives set. 3) Build algorithms, calculation methods so that the error is
the lowest and the efficiency is the highest. Begin implementation of local design, manufacturing, empirical evaluation and testing.
III.VISION MACHINE FOR SORTING MANGOES The mango classification system will handle features such as color, volume, size, shape, defects and especially the density of mangoes. When determining mango volume with Loadcell sensor, mangoes will be taken with 2 cameras in the shooting chamber with the appropriate light intensity from the light bulb. The shooting angles of the mango are random so that the mango fruit image is completely visible. The design of the mango conveyor belt must match the camera's shooting angles because otherwise the image will not take the mango position and process the image to classify the bruises as inaccurate. When conducting experiments, the first task is to design a mango classification model that includes components and operational structures based on the theory and principles of operation of each section and the combination of the distribution system. species. The operation system is integrated to handle each stage and combination of stages to handle color, volume, size, shape, density and percentage of defects (Fig 1). The system to be built must include:
1) System with shooting chamber to process color images, find shape defects and calculate mango volume. 2) Loadcell system to calculate the weight of each mango. 3) The system has a wiper mechanism that eliminates
unsatisfactory fruits, size, shape.
4) The system has a classification mechanism used to classify quality of mangoes into trade items.
Fig. 1.Laboratory testbed.
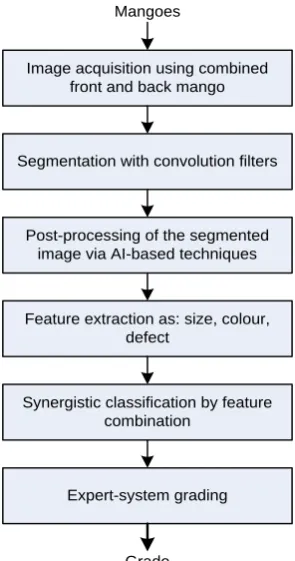
Finally, the mangoes of each classification are packaged and transferred to customers (Fig. 2).
Mangoes
Image acquisition using combined front and back mango
Segmentation with convolution filters
Post-processing of the segmented image via AI-based techniques
Feature extraction as: size, colour, defect
Synergistic classification by feature combination
Expert-system grading
Grade
Fig. 2. Mango sorting process and developed system for mango grading.
A. Inspection Process
The inspection routine developed is illustrated in Fig. 2. First, two images of front and back surfaces are acquired using two cameras. Second, check areas of the mango are found using segmentation modules, each specialised in detecting a different type of feature. Third, post processing is performed to remove false objects and combine areas that represents the same feature. Fourth, both object features and window features are extracted from each located area. Fifth, the features are passed to the neural networks and the outputs of these networks are then combined using the feature combination strategy to assign an overall class to each region. Finally, the mango is graded, using a set of rules, based on the feature type of each located region. An example of a grading table is shown in Table I. The table shows for each grade, the number, type and size of defects
that are permissible.
TABLEI:THE MANGO IS GRADED FOR EACH GRADE, THE NUMBER,TYPE AND SIZE OF DEFECTS THAT ARE PERMISSIBLE
Size
code Standard range
Permission range
(< 10 % each/package) Error
A From 200 to 350 From 180 to 425 112,5
B From 351 to 550 From 251 to 650 150
C From 551 to 800 From 426 to 925 187,5
This table can be easily converted into a rule-based expert system. For better results, fuzzy rules can be employed to emulate expert human graders more closely. The segmentation method adopted is based on standard image-processing functions and consists of three stages. Before segmentation, two images of the two surfaces being inspected is acquired using the image from above and beneath the mango. These images contain some features caused by classifications.
The mangoes are rarely perfect spheres, most mangoes are either long (D<L). A simple way to account for variation in mango shape is to use the ratio (R)of length to diameter: R=L/D. Corrected mango volume will, therefore, have the following equation [5]:
(
1)
P s s
V =V +V KR−
(1) where VP is the corrected mango volume, and K is a shape
factor that varies with fruit type. After development and rearrangement of Eq. 1, the following equation is obtained:
2
1.1 6
P
V = D L
(2)With D and L in cm and VPin cm3.
All of the shape features apart from area are invariant to size, since they are measured from profile images normalised to unit area. Since none of the shape features shows any significant correlation with volume (as opposed to K), and since the effects of projection are small, any set of features from a profile image of a corresponding mango can be easily mapped to a new set of features corresponding to the same piece.
IV. EXPERIMENTS AND DISCUSSIONS
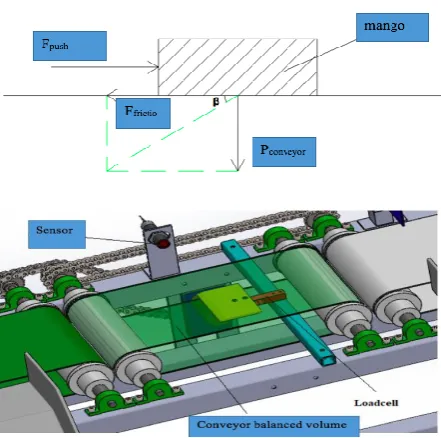
The mechanism for removing left-handed left unsatisfactory: Mango after passing through the image processing area to the wiper, here is attached an infrared sensor to detect objects. After receiving the PLC control signal to return the sensor activation, the sensor detects that the mango will return the signal back to the PLC so that the PLC controls the wiper (cylinder) mechanism to dismiss the does not meet the criteria of the conveyor (into the container located in front of the cylinder) (Fig. 3).
Based on the average mass of Chu and Cat Hoa Loc mango and in the experimental process, we see the largest volume that mango fruit can reach is: 𝑚𝑚𝑎𝑥= 750𝑔, so we have:
To choose:
Fig. 3. Diagram of force distribution in the rupture unit
For al l; K; F; a fixed we always have the dependence of m on x according to the following graph.
Fig. 4. Graph of the relationship between m and x-axis and Code matlab
The result is taken into Excel to calculate, we see the relationship between the two original mass quantities and the weight on the conveyor have linear relationship with the first equation (Fig 4): “y = a. x + b”
In which: y is the volume of mango fruit to be calculated
x is the weight of the weight when weighing the conveyor a, b is the coefficient coefficients a and b are determined by SLOPE functions (find coefficient a), INTERCEPT (find coefficient b). Order to determine:
a = SLOPE (y values, x values) = 1.060952497 b = INTERCEPT (y values, x values) = 63.01837755 The equation to look for:
y = 1,060952497. x + 63,01837755 (3) From the newly found equation, we build the block in the PLC to calculate the exact volume. We have wrong results (Table II).
TABLEII:THE ERROR TABLE BETWEEN THE WEIGHT OF MANGOES
CALCULATED BY THE EQUATION AND THE ACTUAL VOLUME
Order
number Actual volume weight (gam)
Volume calculated by
equation (gam) Error (%)
1 410.4543 412.6726 -2.21827
2 469.9725 469.1009 0.8716
3 323.1496 321.4804 1.6692
4 551.0186 550.2169 0.8017
5 442.9044 441.2227 1.6817
6 432.1404 432.4907 -0.3507
7 451.4862 453.1468 -1.6604
8 399.6903 398.9014 0.7889
9 393.7589 395.3746 -1.6153
10 469.9725 469.9407 0.0318
For convenience, the results of the volume estimation methods developed in this study are repeated here. This includes error and associated confidence statistics for each of the volume estimation methods. Table I gives the results of linear volume estimation methods (Table II).
For the lever you can push the mango out of the conveyor
But we ignore the friction between the mango and the conveyor belt because the friction force is negligible (too small) so:
We have the pneumatic pressure of common air compressors: p = 6 bar = 6.1183kgf / cm2
The response of mango fruit is F = 7.5 N = 0.75 kg
Select cylinder diameter is: dxylanh = 5 mm
The cylinder stroke length is 200 mm (conveyor width r = 180 mm) to ensure the cylinder is able to completely remove the mango from the conveyor.
Due to the use of cylinders, it is necessary to re-calibrate the supply of air to create enough force to push the mango but does not cause surface damage to the mango. At the
𝐹𝑝𝑢𝑠ℎ> 𝑃𝑚𝑎𝑛𝑔𝑜+ 𝐹𝑓𝑟𝑖𝑐𝑡𝑖𝑜𝑛. 𝑡𝑔𝛽.
𝐹𝑝𝑢𝑠ℎ> 𝑃𝑚𝑎𝑛𝑔𝑜↔ 𝐹𝑝𝑢𝑠ℎ> 7,5 (𝑁)
Cylinder diameter: 𝑑𝑥𝑦𝑙𝑎𝑛ℎ= 𝐹.4
𝑝.𝜋=
0, .4
6,1183.𝜋=
same time, the output speed of the cylinder must not exceed the conveyor speed to avoid the mango being knocked off the conveyor.
Need to use 1 cylinder in this structure.
The conveyor section calculates the volume: Mango meets the standard of color shape will follow the conveyor to go through the processing area. Here, under 1 conveyor, 1 Loadcell is attached to the weight of mango fruit (directly connected to the PLC). The result is then returned to the next processing PLC.
Volume of mango using Camera – RGB:
Find size via Camera: Photos obtained from cameras are RGB color images we need to convert to gray images to manipulate more easily. In the model using additional shooting chamber to increase the ability to receive images and separate fonts more easily.
First we know that in most mangoes there will be a certain color threshold. So we will adjust the threshold and begin to turn gray image so that the resulting image has background and mango are 2 separate color values. Here the topic threshold is set at 135, the threshold of mango ranges from 140-255. When we have the pixel size and also the size of the pixel, we just need to multiply it, we get the real size of the mango (Fig 5). Calculating mango volume: We rely on the dependent equation found in the method and the actual size found. Replace the equation to calculate the corresponding volume.
The result of mango volume is obtained by calculating statistical method by size using RGB Camera: Above Loadcell is arranged with an infrared sensor to detect objects. When the mango fruit goes to the sensor to return the signal to Visual, at the same time, the bottom Loadcell also weighs the value of the mango at 10ms.
Fig. 5. Results obtained after determining mango size.
From the newly found equation, we build the block in the PLC to calculate the exact volume. We have wrong results: Average error of acceptable errors: Reasonable equation.
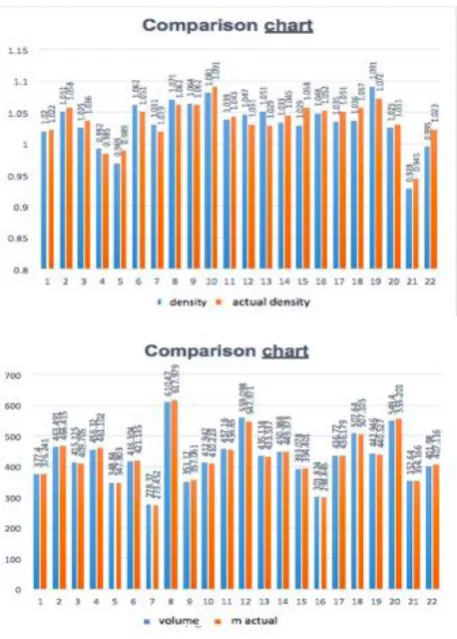
In particular, when determining the mass, volume and density of computation compared to the original elements of mango and comparison chart, we get quite stable and acceptable results Table II and Fig. 6 (units of dimension of mango are mm, volume is ml).
Fig. 6. Chart of relationship between actual weight and conveyor weight.
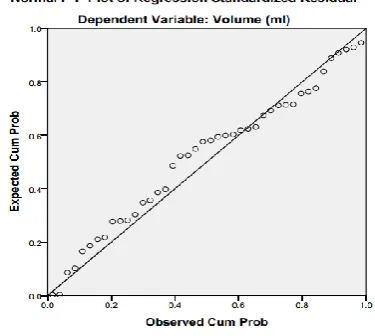
From Fig. 7, we have Mean close to 0, the standard deviation is 0.963 close to 1, so it can be said that the remainder distribution is approximately standard. Therefore, it can be concluded that the normal distribution of the remainder is not violated.
Fig. 7. Chart comparison between volume, density calculations than the real factors.
First experiment on mangoes with actual results as follows:
Fig. 8. Convert RGB color image to gray image.
Image segmentation: Image binary is the process of converting gray images into binary images. Binary images are images where the values of pixels are represented only by two values: 0 (Black) and 255 (White) (Fig. 9).
Fig. 9. Convert gray image to binary.
Results of measuring the actual size of a sample mango and the corresponding number of pixels (Fig. 10):
Fig. 10. Calculate approximately the area of a pixel.
Length (L): 13.69 cm - 426 pixels Width (R): 8.51 cm - 281 pixels Height (H): 7.28 cm - 258 pixels
The above word calculates approximately the area of a pixel:
Determine the area of the mango image obtained from the binary image (borders), determine the length, width and height from this image. Applying formula (1), (2) and Dependency equation between size and volume (3), we deduce the corresponding mango volume.
Each type of fruit has its own unique profile, and for each, they will correspond to a certain profile. Mango has the same common profile, quite similar to Elipson. With this method, we use the length and width of each mango to calculate the corresponding volume (Fig. 11).
Fig. 11. Image analysis determines mango contour to calculate volume.
Here the input variable is the size of the mango and the output variable will be the corresponding mango volume (Table III). The result is:
TABLEIII:TABLE OF DEPENDENT EQUATION PARAMETERS (SNAPSHOT)
Dependent equation between size and volume:
Volume = 3.249 × length + 2.956 × width + 10.155 × height – 1000.959
Fig. 12. Normal P-P balance diagram.
And from Fig. 12, we see that the distribution points in the distribution of the remainder are concentrated into one diagonal, thus, assuming the normal distribution of the remainder is not violated.
V. CONCLUSION
This study described the method and terminology of several of tolls that are used for image processing and analysis in sorting and classification of mangoes based on Artificial Intelligence. The digital image processing is required firstly to preprocess the data of mango images into a format from which features can be extracted, and secondly to extract and measure these features.
The fluctuation of mango fruit quality in the market is huge. The best harvesting time for fruit quality depends on many factors including Cat Hoa Loc mango and Cat Chu mango in Vietnam for the best quality when having density from 1.00 -1.02. Fruits are classified by machine vision techniques and artificial intelligence is more uniform in quality than the left harvest by age and market.
The mango images used in this study for sorting and blemish detection are obtained using a CCD camera. Once shape have been extracted from the mango profile images and applied to artificial neural network that is used to combine shape features to form volume estimates for the corresponding mango. The testing method used on ANN and other function approximation methods are explained in this paper.
Eventually, the features are to be combined to form a volume estimate of fruit from whose image thay are
1369 4260 ×
851
2810= 0,09732 𝑚𝑚
extracted and measured.
In one of its simplest forms, function approximation is determination of a linear regression equation based on a set of data. This linear relationship is a model for between weight and volume, since one would expect that the volume of mango would be directly proportional to its weight, because mango density is usually almost constant within a same quality. A model must be formed from knowledge of understanding of source of the data. As it is known that mango density increased with the volume, then the quality is better and the mango is sweet (Based on regression equation of weight and volume). ANN can be seen as a form of regression equation which can model arbitrary continuous functions where an explicit model relating the functional form of the output to the inputs is known. The first stage in the computer processing of the digital images from camera is to form separate image files of mangoes. This is necessary since locating the mango within the large image would be very computationally expensive. From these resized images, the grey-scale images are formed from the sum of the red and green bands less twice the blue band. Next, the grey-scale images are threshold to form binary images. The threshold value is simply found based on experiments for each type of mango (with reference to several image histograms). The mango images are calibrated for size by using images of ellipse.
REFERENCES
[1] C. S. Nandi, B. Tudu, and C. Koley, “Computer vision-based mango fruit grading system,” in Proc. International Conference on Innovative Engineering Technologies, Bangkok, Thailand, 2014 [2] T. U. Ganiron, “Size properties of mangoes using image analysis,”
International Journal of Bio-science and Bio-technology, vol. 6, no. 2, 2014.
[3] E. H. Yossya, J. Pranataa, T. Wijayaa, H. Hermawana, and W. Budihartoa, “Mango fruit sortation system using neural network and computer vision,” in Proc. 2nd International Conference on Computer Science and Computational Intelligence, 2017.
[4] T. Rosli, B. Razak, M. B. Othman, M. N. B. A. Bakar, K. A. B. Ahmad, and A. R. Mansor, “Mango grading by using fuzzy image analysis,” in Proc. International Conference on Agricultural, Environment and Biological Sciences, 2012.
[5] M. Ngouajio, W. Kirk, and R. Goldy, “A simple model for rapid and nondestructive estimation of bell pepper fruit volume,” Hort Science, vol. 38, no. 4, pp. 509-511, 2003.
[6] M. S. Banot and P. M. Mahajan, “A fruit detecting and grading system based on image processing-review,” International Journal of Innovative Research In Electrical, Electronics, Instrumentation and Control Engineering, vol. 4, no. 1, 2016.
[7] K. A. Vakilian and J. Massah, “An apple grading system according to European fruit quality standards using Gabor filter and artificial neural networks,” Scientific Study & Research Chemistry & Chemical Engineering, Biotechnology, Food Industry, 2016.
[8] J. Gill, A. Girdhar, and T. Singh, “A hybrid intelligent system for fruit grading and sorting,” International Journal on Computer Science and Engineering.
[9] B. H. Zhang, W. Q. Huang, J. B. Li, C. J. Zhao, S. X. Fan, J. T. Wu, and C. L. Liu, “Principles, developments and applications of computer vision for external quality inspection of fruits and vegetables,” Food Research International, vol. 62, 2014.
[10] A. Alipasandi, H. Ghaffari, and S. Z. Alibeyglu, “Classification of three varieties of peach fruit using artificial neural network assisted with image processing techniques,” International Journal of Agronomy and Plant Production, vol. 4, no. 9, 2013.
[11] M. Rokunuzzaman and H. P. W. Jayasuriya, “Development of a low cost machine vision system for sorting of tomatoes,” Agric Eng Int: CIGR Journal, vol. 15, no. 1, pp. 173-180, 2013.
[12] Guttormsen et al., “A machine vision system for robust sorting of herring fractions,” Food and Bioprocess Technology, pp. 1893-1900, vol. 9, no. 11, 2016.
Nguyễn Đức Thông is a lecturer in physics pedagogy, Chemistry, biology_Dong Thap University. His main research areas are mechanical engineering. He is studying a doctorate in mechatronics engineering at Ho Chi Minh City University of Technology and Education.
Nguyễn Trường Thịnh is the dean of Faculty of Mechanical Engineering Creates Machines_Ho Chi Minh City University of Technology and Education.
He is an associate professor. His main research areas are mechatronics. The research projects in the fields of authors can be found on the search engines of the world science.