Page 397 www.ijiras.com | Email: [email protected]
Pattern Recognition In Language Model With Special Reference To
Children Stories
Ms. Menaka Sikdar
Ph.D Research scholar, Department of Statistics, Gauhati University, Guwahati, Assam, India
Ms. Pranita Sarma
Professor, Department of Statistics, Gauhati University, Guwahati, Assam, India
I. INTRODUCTION
Folklores and folktales have been an integral part of every culture since ages. Most of the folktales are the basic ingredients of Children stories that we are going to consider for our study. The maximum numbers of children stories are compiled from our classical folklores and folktales. These stories are transmitted from one generation to the next over time. Stories are expanded and reshaped with each retelling, depending upon customs, cultures, time and places. They are found to be similar with respect to the moral lessons with different flavors produced by different cultures and languages.
While narrating the stories, the narrators (authors) introduce great amount of randomness. As a consequence, the style of writings varies from language to language, culture to culture and also author to author. Writing style depends upon choice of words, grammar of the writing language, type of sentences and length of the sentences.
Human are good at pattern recognition. They are able to recognize the different faces, voices, footsteps, sounds of animals and birds, hand writings etc. Pattern recognition is the task of collecting raw data and taking an action based on the “category” of the pattern which has been crucial for our survival, and over the past tens of millions of years we have evolved highly sophisticated neural and cognitive systems for such tasks. In this piece of work we are trying to recognize the pattern of children literature written by different authors. To perform the pattern classification offered by different authors in different languages statistically, our first task is to quantify the available texts which are sometimes denoted as corpus. In this article, we consider the following parameters that will actually help us to recognize the pattern of the children stories - (i) total number of words contained in a story (ii) total number of sentences contained in a story (iii) mean number of words per sentence of a story (iv) range of the size of sentences of a story.
Abstract: This paper presents a study for three languages namely Assamese, Bengali and English. The main objective of this study is to pattern recognition of language model with special reference to children stories in order to find the distinction among all these languages. We consider only the children stories because they are found to be similar all over the world with different flavours produced by different cultures, languages and time. We have taken 30 Assamese stories from “Burhi Aai’r Xaadhu” (literary translated to Grandma’s tales), 27 Bengali stories from “Tuntunir Boi” (Book of the tailor-bird), 62 English stories from Grimm’s fairy tales and 16 English stories from Anderson’s fairy tales for collecting data. Detailed statistical analyses have been performed by quantifying the texts and presenting them graphically. Non-parametric approaches have been used to test the significant differences among the texts under consideration. It has been shown that there exits significant differences among the writing pattern of the children stories written by different authors. The Kolmogorov Goodness –of- Fit test, Kruskal-Wallis test, Squared Ranks Test are used for this purpose.
Page 398 www.ijiras.com | Email: [email protected]
After quantification of the text, our next attempt is to verify the significant differences between the parameters mentioned above using well defined statistical procedure. In languages, many questions occurred regarding the pattern of writing of various authors under different languages that are to be subjected to statistical inquiry for their proper verification. Under such circumstances standard statistical methods like non-parametric tests can be important tool in verifying and testing fundamental literary questions related to this piece of work.
II. LITERATURE REVIEW
Statistical analysis on language model is not new. Several authors have discussed Grammar based Statistical approaches towards language models. Marco Turchi and Nello Cristianini (2006) presented a discussion on statistical analysis of Language evaluation of written text. The authors have developed a “statistical signature (SLS)” of a language, analogous to the genetic signature proposed by Karlin (1997) in biology, and they showed its stability within languages and its discriminative power between languages. They have reconstructed a phylogenetic tree of Indo –European (IE) languages using the pair-wise distance matrix. The “statistical signature” is used to analyze a time-series of documents from four Roman languages, following their transition from Latin. In a similar paper by Agarwal et al (2014) present two studies, namely (i) Statistical Analysis for three languages i.e. Hindi, Punjabi and Nepali and (ii), Development of language models for three Indian languages i.e. Indian English, Punjabi and Nepali. The main objective of the above study is to find distinction among these languages and development of language models for their identification. The statistical analysis has been done to compute the information about entropy, perplexity, vocabulary growth rate etc.
A Class Based n-gram model of Natural Language has been studied by Peter et al (1992). This paper talks about the problem of predicting a word from previous words in a sample of text. The authors have studied n-gram (1-gram, 2-gram and 3-gram) models based on the classes of words by using 365,893,263 words of English text. Further N-gram models in statistical natural language processing have been studied by Sveta zinger (2006). Speech recognition model has been studied by Bahl. Jelinek and Marcer (1983) and machine translation by Brown et al. (1990). Automatic spelling correction was studied by Mays, Demerau and Mercer in 1990.
III. OBJECTIVES Of STUDY
The main objective of our study is to recognize patterns in children stories in different languages. Moreover our aim is to answer the research questions mentioned below:
Whether the distributions of the random variables (i),(ii),(iii) and (iv) (as mentioned in section I) have come from normal population.
Whether there exists significant difference among the distribution functions of the random variables (i),(ii),(iii) and (iv)
Whether there exists significant difference between the distribution functions of the random variables (i), (ii), (iii) and (iv)
IV. MATERIALS AND METHODS
Non parametric techniques are used for analysis of language pattern under consideration. The concept of Empirical distribution function is used for studying the probabilistic structure of the distributions of random variables viz (i) total number of words, (ii) total number of sentences, (iii) mean number of words per sentence and (iv) range of the size of sentences of different stories under different languages namely Assamese, Bengali, English1 (Grimm’s’ Fairy tales) and English2 (Andersen’s Fairy tales). In the second stage Non-parametric test (Kolmogorov Goodness –of- Fit test) is performed to test the normality of the distributions of random variables mentioned above. The third stage is devoted to Kruskal-Wallis Test and the Squared Ranks Test for more than two samples for comparing the means and variances of the random variables (i), (ii), (iii) and (iv) respectively.
V. SOME IMPORTANT CHARACTERISTICS FOR RECOGNIZING THE PATTERN OF CHILDREN
STORIES
A. SOME DEFINITIONS
A word is a basic element in every language with proper combination of letters arranged in such a manner that they should represent either objects or ideas.
let wij (k,l) be the jth word in the ith sentence of kth story under lth language i=1,2,…..m j=1,2….n k=1,2…r and l=1,2,…,q .
Here w(kl)=∑ i∑j wij (k,l) is the total number of words in kth story described under lth language.
wi(kl)= ∑j wij (k,l) is the total number of words in ith sentence of the kth story described under lth language. Hence w(kl)= ∑i wi (k,l)
A sentence is a function of words which makes complete sense. Placing of words at different positions of the sentence, use of proper part of speeches, use of phrases common to a culture, place and language present the writing style of a story which adds a flavor to the story.
Skl is the total number sentences in the kth story under lth language.
(k=1,2,…,r and l=1,2,…,q) is the mean number of words per sentence of the kth story under lth language .
Range of the size of sentences in the kth story under lth language is the difference between the maximum and minimum size of sentences of that particular story.
Page 399 www.ijiras.com | Email: [email protected]
Therefore, Rkl=Max wi(kl)-Min wi(kl), i=1,2,…,m ,k=1,2,…,r and l=1,2,…,q represents range of the size of sentences of kth story under lth language.
B. EMPIRICAL DISTRIBUTION FUNCTION
The true distribution of a random variable is almost never known. Sometimes we make some reasonable guess to form the distribution function and use it as an approximation of the true distribution function. One way of making a good guess is by observing several values of the random variable and constructing a graph of F(x) that may be used as an estimate of the entire unknown population distribution function of the random variable. F(x) is known as empirical distribution function and it turns out to be step function.
In case of the distribution of total number of words contained in different stories under lth language, our data consists of a random sample w(1l),w(2l),…,w(rl) of size r.
The empirical distribution function , Fw(x)=(number of w(kl) ,where k=1,2,…,r,l=1,2,3,4
Fw(x) have been plotted using Rlanguage as follows
0 500 1000 1500 2000 2500 3000
0 .0 0 .2 0 .4 0 .6 0 .8 1 .0 ecdf(w) x F n (x)
0 500 1000 1500
0 .0 0 .2 0 .4 0 .6 0 .8 1 .0 ecdf(w) x F n (x)
Figure 1 Figure 2
0 1000 2000 3000 4000
0 .0 0 .2 0 .4 0 .6 0 .8 1 .0 ecdf(w) x F n (x)
0 1000 2000 3000 4000 5000
0 .0 0 .2 0 .4 0 .6 0 .8 1 .0 ecdf(w) x F n (x)
Figure 3 Figure 4
[The empirical distribution functions of the total number of words of different stories under Assamese, Bengali, English1 and English2 are represented in Figure 1,2,3and 4respectively]
For the distribution of total number sentences contained in different stories under lth language, our data consists of a random sample S1l, S2l,…,Srl of size r.
The empirical distribution function, Fs(x) can be obtained as mentioned above.
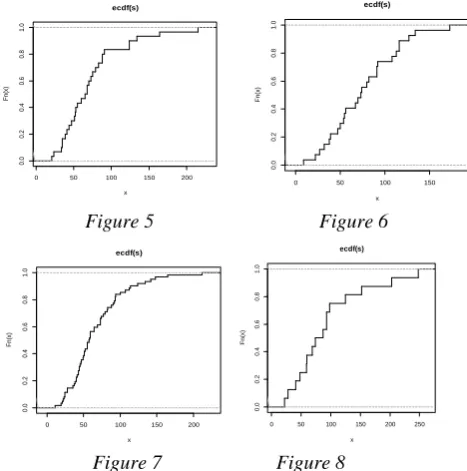
Fs(x) have been plotted using R language as follows
0 50 100 150
0 .0 0 .2 0 .4 0 .6 0 .8 1 .0 ecdf(s) x F n (x)
Figure 5 Figure 6
0 50 100 150 200
0 .0 0 .2 0 .4 0 .6 0 .8 1 .0 ecdf(s) x F n (x)
0 50 100 150 200 250
0 .0 0 .2 0 .4 0 .6 0 .8 1 .0 ecdf(s) x F n (x)
Figure 7 Figure 8
[The empirical distribution functions of the total number of sentences of different stories under Assamese, Bengali, English1 and English2 are represented in Figure 5, 6, 7 and 8 respectively]
For the distribution of mean number of words per sentence of different stories under lth language, our data consists of the random sample
w
1l,
w
2l,...,
w
rl of size r.The empirical distribution function can be obtained as mentioned above.
have been plotted using R language as follows
8 10 12 14 16
0 .0 0 .2 0 .4 0 .6 0 .8 1 .0 ecdf(m) x F n (x)
6 7 8 9 10 11 12
0 .0 0 .2 0 .4 0 .6 0 .8 1 .0 ecdf(m) x F n (x)
Figure 9 Figure 10
10 20 30 40
0 .0 0 .2 0 .4 0 .6 0 .8 1 .0 ecdf(m) x F n (x)
15 20 25 30
0 .0 0 .2 0 .4 0 .6 0 .8 1 .0 ecdf(m) x F n (x)
Figure 11 Figure 12
[The empirical distribution functions of mean number words per sentence of different stories under Assamese, Bengali, English1 and English2 are represented in Figure 9, 10, 11 and12 respectively]
Now, for the distribution of range of the size of sentences of different stories under lth language, our data consists of the random sample R1l, R2l ,…,Rrl of size r.
0 50 100 150 200
Page 400 www.ijiras.com | Email: [email protected]
The empirical distribution function can be obtained as mentioned above.
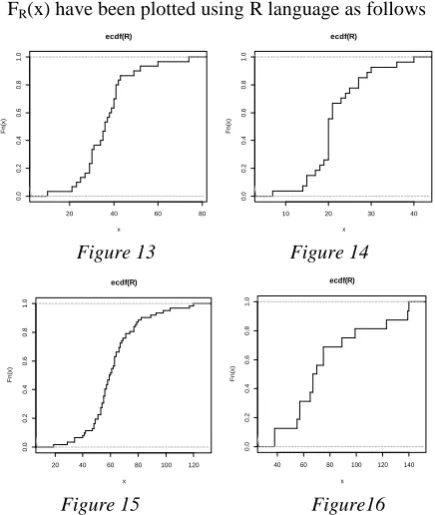
FR(x) have been plotted using R language as follows
20 40 60 80
0
.0
0
.2
0
.4
0
.6
0
.8
1
.0
ecdf(R)
x
F
n
(x)
10 20 30 40
0
.0
0
.2
0
.4
0
.6
0
.8
1
.0
ecdf(R)
x
F
n
(x)
Figure 13 Figure 14
20 40 60 80 100 120
0
.0
0
.2
0
.4
0
.6
0
.8
1
.0
ecdf(R)
x
F
n
(x)
40 60 80 100 120 140
0
.0
0
.2
0
.4
0
.6
0
.8
1
.0
ecdf(R)
x
F
n
(x)
Figure 15 Figure16
[The empirical distribution functions of range of the size of sentences of different stories under Assamese, Bengali, English1 and English2 are represented in Figure 14, 15, 16 and 17 respectively]
VI. SOME IMPORTANT NON-PARAMETRIC TESTS USED FOR ANALYZING STATISTICAL SIGNIFICANCE AMONG THE PATTERNS
A. THE KOLMOGOROV GOODNESS – OF - FIT TEST
FOR TESTING THE NORMALITY OF THE
DISTRIBUTIONS OF THE RANDOM VARIABLES UNDER STUDY
In section VB, we have obtained the empirical distribution functions of random variables under study which may be used to estimate the true distribution functions of the populations. Now we are interested to know whether the distributions of these random variables follow normal distribution. We have used the Kolmogorov Goodness –of- Fit test for normality to test these distributions.
Case 1: (For the distribution of total number of words) Our data consist of a random sample w(1l), w(2l),…,w(rl) of size r under lth language associated with some unknown distribution function , denoted by Q(wl).
ASSUMPTION
The sample is a random sample.
TEST STATISTIC
Let F(wl) be the empirical distribution function based on the random sample w(1l), w(2l),…,w(rl). The test statistics is defined separately for three different sets of hypotheses, A, B
and C. Let Q*(wl) be a completely specified hypothesized distribution function which is considered here as a normal probability distribution function.
(Two- Sided Test) Let the test statistic T be the greatest vertical distance between F(wl) and Q*(wl). Mathematically
T=
wl
sup
(One- Sided Test) The test statistic, T+=
wl
sup
[Q*(wl) -F(wl) ]
(One- Sided Test) we define the test statistic =
wl
sup
[F(wl) - Q*(wl)]
NULL DISTRIBUTION: when Q(wl) is continuous and the null hypothesis is true, the exact distribution function of T+ and T- is given by
Where [r (1-wl)] is the greatest integer less than or equal to r(1-wl). This distribution is the same for T+ and T-. The asymptotic (as n →∞) distribution function of
r
T+ andr
T- is given by
The approximate distribution function of T is
, because T is less than wl only when both T+ and T- are less than wl.
HYPOTHESES
A. (Two-sided Test) The null hypothesis is to be tested H0: Q(wl)=Q*(wl) for all wl from -∞ to +∞
H1: Q(wl)≠Q*(wl) for at least one value of wl B. (One-sided test) The null hypothesis is to be tested H0: Q(wl)≥Q
*
(wl) for all wl from -∞ to +∞ H1: Q(wl)<Q*(wl) for at least one value of wl C. (One-sided test) The null hypothesis is to be tested H0: Q(wl)≤Q*(wl) for all wl from -∞ to +∞
H1: S(wl)>S *
(wl) for at least one value of wl
Case2. (For the distribution of total number of sentences) Here our data consist of a random sample S1l, S2l,…,Srl of size r under lth language associated with some unknown distribution function denoted by Q(Sl).
Let F(Sl) be the empirical distribution function based on the random sample S1l, S2l,…,Srl . Let Q*(Sl) be a completely specified hypothesized distribution function which is considered here as a normal probability distribution function. The procedure described in case1 is applied to test the following hypotheses
A. (Two-sided Test) The null hypothesis is to be tested H0: Q(Sl)= Q
*
(Sl) for all Sl from -∞ to +∞ H1: Q(Sl)≠ Q*(Sl) for at least one value of Sl
B. (One-sided test) The null hypothesis is to be tested H0: Q(Sl)≥ Q*(Sl) for all Sl from -∞ to +∞
H1: Q(Sl) <Q *
(Sl) for at least one value of Sl
Page 401 www.ijiras.com | Email: [email protected]
H0: Q(Sl)≤ Q*(Sl) for all Sl from -∞ to +∞ H1: Q(Sl) >Q
*
(Sl) for at least one value of Sl
Case3. (For the distribution of mean number words per sentence)
Our data consist of a random sample
w
1l,
w
2l,...,
w
rlof size r under lth language associated with some unknown distribution function denoted by Q( ).Let F( ) be the empirical distribution function based on the random sample
w
1l,
w
2l,...,
w
rl. Let Q*( ) be a completely specified hypothesized distribution function which is considered here as a normal probability distribution function. The procedure described in case1 is applied to test the following hypothesesA. (Two-sided Test) The null hypothesis is to be tested H0: Q )= Q*( ) for all from -∞ to +∞
H1: Q( ) ≠ Q*( ) for at least one value of
B. (One-sided test) The null hypothesis is to be tested H0: Q( ) ≥ Q*( ) for all from -∞ to +∞ H1: Q( ) <Q*( ) for at least one value of
C. (One-sided test) The null hypothesis is to be tested H0: Q( )≤ Q*( ) for all from -∞ to +∞
H1: Q( ) >Q*( ) for at least one value of
Case 4 (For the distribution of range of the size of sentences)
Here our data consist of a random sample R1l , R2l ,…,Rrl of size r under lth language associated with some unknown distribution function denoted by Q(Rl).
Let F(Rl) be the empirical distribution function based on the random sample R1l , R2l ,…,Rrl. Let Q*(Rl) be a completely specified hypothesized distribution function which is considered here as a normal probability distribution function. The procedure described in case1 is applied to test the following hypotheses
A. (Two-sided Test) The null hypothesis is to be tested H0: Q(Rl)= Q*(Rl) for all Rl from -∞ to +∞
H1: Q(Rl)≠ Q*(Rl) for at least one value of Rl
B. (One-sided test) The null hypothesis is to be tested H0: Q(Rl)≥ Q*(Rl) for all Rl from -∞ to +∞
H1: Q(Rl) <Q*(Rl) for at least one value of Rl
C. (One-sided test) The null hypothesis is to be tested H0: Q(Rl)≤ Q*(Rl) for all Rl from -∞ to +∞
H1: Q(Rl) >Q*(Rl) for at least one value of Rl
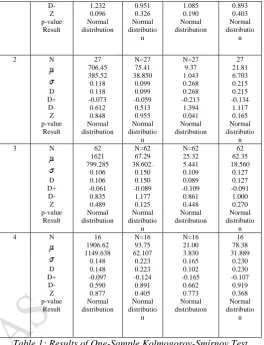
NUMERICAL RESULT: Results are obtained by using SPSS soft-ware and are given in Table1
[Assume that test is based on the characteristics→ Language=L, it takes values 1,2,3 and 4 for Assamese, Bengali, English1 and English2 respectively. sample size=r , Mean= , standard deviation = , Most extreme absolute difference=D, Positive difference=D+, Negative difference=D-, K.S test statistic=Z, wl=total number of words, Sl =Total number of sentences, = mean number words per sentence, Rl = range of the size of sentences.]
L Characteris tics Numerical Data (wl) Numerical Data Sl Numerical Data ( ) Numerical Data Rl 1 r D D+ 30 963.03 608.906 0.225 0.225 -.126 30 73.33 42.924 0.174 0.174 -0.113 30 13.07 1.799 0.198 0.135 -0.198 30 36.60 11.961 0.163 0.163 -0.096 D-Z p-value Result 1.232 0.096 Normal distribution 0.951 0.326 Normal distributio n 1.085 0.190 Normal distribution 0.893 0.403 Normal distributio n 2 N D D+ D-Z p-value Result 27 706.45 385.52 0.118 0.118 -0.073 0.612 0.848 Normal distribution N=27 75.41 38.850 0.099 0.099 -0.059 0.513 0.955 Normal distributio n N=27 9.37 1.043 0.268 0.268 -0.213 1.394 0.041 Normal distribution 27 21.81 6.703 0.215 0.215 -0.134 1.117 0.165 Normal distributio n 3 N D D+ D-Z p-value Result 62 1621 799.285 0.106 0.106 -0.061 0.835 0.489 Normal distribution N=62 67.29 38.602. 0.150 0.150 -0.089 1.177 0.125 Normal distributio n N=62 25.32 5.441 0.109 0.089 -0.109 0.861 0.448 Normal distribution 62 62.35 18.560 0.127 0.127 -0.091 1.000 0.270 Normal distributio n 4 N D D+ D-Z p-value Result 16 1906.62 1149.638 0.148 0.148 -0.097 0.590 0.877 Normal distribution N=16 93.75 62.107 0.223 0.223 -0.124 0.891 0.405 Normal distributio n N=16 21.00 3.830 0.165 0.102 -0.165 0.662 0.773 Normal distribution 16 78.38 31.889 0.230 0.230 -0.107 0.919 0.368 Normal distributio n
Table 1: Results of One-Sample Kolmogorov-Smirnov Test Conclusion : From the above table ,it has been noticed that the p-values of the test statistics for the distributions of total number of words ,total number of sentences and range of the size of sentences of different stories under different languages are greater than 0.05.Therefore we may accept our null hypotheses at 5% level of significance and may conclude that the distributions of these random variables under different languages namely Assamese, Bengali, English1 and English2 are normally distributed.
Again we have noticed that the p-values of the test statistics for the distributions of mean number words per sentence of different stories under Assamese, English1and english2 are greater than 0.05 Therefore we may accept our null hypotheses at 5% level of significance (except for Bengali stories). However the p-value of the test statistic under Bengali stories is 0.041which is greater than 0.01. Therefore we may accept the null hypothesis at 1% level of significance and may conclude that the distributions of mean number of words per sentences of different stories under different languages are normally distributed.
B. THE KRUSKAL-WALLIS TEST FOR COMPARING THE DISTRIBUTIONS OF RANDOM VARIABLES OBTAINED FROM DIFFERENT STORIES UNDER DIFFERENT LANGUAGES
Page 402 www.ijiras.com | Email: [email protected]
and variances. If two or more samples are governed by the same distribution, it seems natural to compare these distributions with respect to some characteristics that governs their probabilistic structures. Now we need to verify whether these distributions under study differ significantly corresponds to their means when all the languages are considered together. In this case we have to analyze 4 independent samples for making inference by using the kruskal-Wallis test.
Case 1: (For the distributions of total number of words of different stories under 4 different languages)
Here our data consist of 4 random samples of different sizes. Let r1, r2, r3 and r4 are the sample sizes (number of stories) of Assamese, Bengali, English1 and English2 respectively. The data may be arranged as below
Sample1 (Assamese)
Sample2 (Bengali)
Sample3 (English1)
Sample4 (English2)
w(11) w(12) w(13) w(14)
w(21) w(22) w(23) w(24)
… … … …
w(r11) w(r22) w(r33) w(r44)
Let r be the total number of observations (stories). (1) We assign rank 1 to the smallest of the totality of r observations, rank 2 to the second smallest, and so on to the largest of all r observations, which receives rank r. Let ρ[w(kl)] be the rank assigned to w(kl) .Let ρl be the sum of ranks assigned to the lth sample.
l=1, 2, 3, 4 (2) If the several observations are equal to each other, we assign the average rank to each of the tied observations.
ASSUMPTIONS
All samples are random samples from their respective populations.
In addition to independence within each sample, there is mutual independent among the various samples.
The measurement scale is at least ordinal.
Either the k population distribution functions are identical, or else some of the populations tend to yield larger values than other populations do.
TEST STATISTIC
The test statistics T is defined as
(3)
Where (4)
If there are no ties c2 simplifies to r (r+1)/12 and test statistics reduces to
(5)
NULL DISTRIBUTION
The exact distribution of T is too cumbersome to work with. Therefore the chi-square distribution with 4-1=3 degrees of freedom is used as an approximation to the null distribution of T.
HYPOTHESES
: All of the four population distribution functions of total number of words of different stories under different languages are identical.
: The four populations of total number of words of different stories under different languages differ significantly corresponding to their means.
MULTIPLE COMPARISONS
When the null hypothesis is rejected, we may use the following procedure to determine which pairs of populations tend to differ. The populations say l and k seem to be different if the following inequality is satisfied:
(6)
Where s be the number of random samples, and are the rank sums of the two samples, is the
quantile of the t distribution with r-s degrees of freedom, c2 comes from equation (4) and T comes from equation (3) or (5).
Case 2: (For the distributions of total number of sentences of different stories under 4 different languages)
Here we have analyzed 4 samples of different sizes. Let r1, r2, r3 and r4 are the sample sizes (number of stories) of Assamese, Bengali, English1 and English2 respectively. Our data may be arranged as below
Sample1 (Assamese)
Sample2 (Bengali)
Sample3 (English1)
Sample4 (English2)
… … … …
The procedure described in case1 is applied to test the following hypotheses.
HYPOTHESES
: All of the four population distribution functions of total number of sentences of different stories under different languages are identical.
: The four populations of total number of sentences of different stories under different languages differ significantly corresponding to their means.
Case 3: (For the distributions of mean number of words per sentence of different stories under the different languages)
Here our data may be arranged as below
Sample1 (Assamese)
Sample2 (Bengali)
Sample3 (English1)
Sample4 (English2)
… … … …
Page 403 www.ijiras.com | Email: [email protected]
HYPOTHESES
: All of the four population distribution functions of mean number of words per sentence of different stories under different languages are identical.
: The four populations of mean number of words per sentence of different stories under different languages differ significantly corresponding to their means.
Case 4: (For the distributions of range of the size of sentences of different stories under different languages)
Here our data may be arranged as below Sample1 (Assamese) Sample2 (Bengali) Sample3 (English1) Sample4 (English2) … … … …
The procedure described in case1 is applied to test the following hypotheses
HYPOTHESES
: All of the four population distribution functions of range of the size of sentences of different stories under different languages are identical.
: The four populations of range of the size of
sentences of different stories under different languages differ significantly corresponding to their means.
NUMERICAL RESULT: Results of the above analyses are obtained by using SPSS soft-ware and are given in Table2
Numerical Data language Sample size Mean rank Test statistic (Chi-square) d.f p-value Result Total number of words Assamese Bengali English1 English 2 30 27 62 16 50.28 35.69 85.13 89.38
41.250 3 0.000
is rejected Total number of sentences Assamese Bengali English1 English 2 30 27 62 16 67.35 72.67 62.73 81.78
3.507 3 0.320
is accepted Mean number of words per sentence Assamese Bengali English1 English 2 30 27 62 16 42.65 16.56 99.60 79.91
101.549 3 0.000
is rejected Range of
the size of sentences Assamese Bengali English1 English 2 30 27 62 16 47.17 18.31 90.35 104.31
86.146 3 0.000
is rejected
Table2: Results of Kruskal-Wallis Test
Conclusion: From the above table ,it has been noticed that the p-values of the test statistics of the distributions of total number of words, mean number of words per sentence and range of the size of sentences in different stories under the 4 different languages are less than 0.05.Therefore we may reject our null hypotheses namely H01 ,H03,H04 at 5% level of significance and may conclude that the distributions of total number of words, , mean number of words per sentence and range of the size of sentences of different stories under 4 different languages do not have identical means i.e. they are all significantly different corresponding to their means. On the other hand, the p-value of the test statistic for the distributions of total number of sentences of different stories
under the 4 different languages is greater than 0.05.Therefore we may accept our null hypothesis H02 at 5% level of significance and may conclude that the distributions of total number of sentences of different stories under the different languages may have identical mean i.e. they are not significantly different.
However when such a null hypothesis is rejected , it is a normal practice to perform multiple comparison procedure to determine which pairs of population tend to differ. Here we can ignore few ties and use the simpler form
= 1530
Calculations for multiple comparisons are given in Table3.
[l takes value 1,2,3,4 for Assamese, Bengali ,English1 and English2 stories respectively]
Numerical Data languages Results Total number of words
1 and 2 1and 3 1 and 4 2 and 3 2 and 4 3 and 4
14.59 34.85 39.10 49.44 53.69 4.25 17.11268 14.34698 19.97015 14.87443 20.35239 18.089 Not significantly different significantly different significantly different significantly different Significantly different Not significantly different Mean number of words per sentence
1 and 2 1and 3 1 and 4 2 and 3 2 and 4 3 and 4
26.09 56.95 37.26 83.04 63.35 19.69 10.1222 8.486285 11.81241 8.798273 12.0385 10.6997 significantly different significantly different significantly different significantly different Significantly different significantly different Range of
the size of sentences
1 and 2 1and 3 1 and 4 2 and 3 2 and 4 3 and 4
28.86 43.18 57.14 72.04 86 13.96 12.29193 10.30535 14.34444 10.68421 14.619 12.99322 significantly different significantly different significantly different significantly different Significantly different significantly different Table3: Results of Multiple Comparisons under
Kruskal-Wallis Test
Conclusion: Using multiple comparisons procedure we see that the distributions of total number of words of different stories under Assamese and Bengali languages are not significantly different. But they are significantly different from English1 and English2 stories. Again the distributions of total number of words of different stories under English1 and English2 are not significantly different.
Again it has been noticed that the distributions of mean number of words per sentence and range of the size of sentences of different stories under 4 different languages are pair wise significantly different.
C. SENSITIVITY OF KRUSKAL - WALLIS TEST
Page 404 www.ijiras.com | Email: [email protected]
Both the test statistics under the above mentioned tests have identical asymptotic Chi-squared distribution with same degrees of freedom. However we may get a rough idea of the power of the Kruskal- Wallis test compared with the Median test by comparing the value of the test statistics in both the tests.
We have obtained the values of the test statistics under the Median test for different distributions under study by using SPSS software.
The values of the test statistics under both the tests for different distributions are given in Table4.
Distribution The value of the test statistics
Result
Kruskal- Wallis test
Median test Total number
of words
41.250 32.385 The null
hypothesis is rejected Total number
of sentences
3.507 4.375 The null
hypothesis is accepted Mean number
of words per sentences
101.549 98.304 The null hypothesis is
rejected range of the
size of sentences
86.146 78.487 The null
hypothesis is rejected Table4: Comparison between Kruskal- Wallis Test and
Median Test
From the above table, it has been noticed that, when the null hypotheses are rejected, the values of the test statistics computed in the Kruskal- Wallis test is larger than the values computed in the Median test, but when the null hypothesis is accepted, the value of the test statistics computed in the Kruskal- Wallis test attains smaller value than the Median test which indicates the sensitivity of the Kruskal- Wallis test to the sample differences for this particular case.
C. THE SQUARED RANKS TEST AMONG THE
DISTRIBUTIONS OF RANDOM VARIABLES UNDER
In section VI B, we are comparing the means of the distributions of random variables under 4 different languages by using the Kruskal-Wallis test. Now we are very much interested to compare these distributions in terms of their variances. Here we have used the squared rank test for more than two samples to compare the variances of these distributions under four different languages.
Case 1: (For the distributions of total number of words contained in different stories under four different languages)
Here our data consist of 4 independent samples which are given in case 1 under section VI B.
For this analysis, we subtract the population mean from each observation (or its sample mean when population mean is unknown) and convert these differences to absolute differences. Then we rank the combined absolute differences from smallest to largest, assigning average ranks in case of ties. Then we compute the sum of squares of the ranks of each sample (language).
ASSUMPTIONS
All samples are random samples from their respective populations.
In addition to independence within each sample, there is mutual independence among the various samples.
The measurement scale is at least interval.
TEST STATISTIC
The test statistics is .Where rl= number of observations in lth sample. r=
Let, = the sum of the squared ranks in the lth sample, l=1, 2, 3, 4.
and and let
represents the sum resulting after raising each rank to the fourth power .
If there is no ties, D2 = r(r+1)(2r+1)(8r+11)/180 and =(r+1)(2r+1)/6
NULL DISTRIBUTION
The null distribution of T is approximately the chi- squared distribution with 4-1=3 degrees of freedom.
HYPOTHESES
: All of the four populations of total number of words contained in different stories under different languages are identical, except for possibly different means.
: The four populations of total number of words contained in different stories under different languages do not have identical variance.
MULTIPLE COMPARISONS
When the null hypothesis is rejected, we may use the following procedure to determine which pairs of populations tend to differ. The populations say l and k seem to be different if the following inequality is satisfied:
Where s be the number of random samples, and are the sums of the squared ranks in the lth and kth samples respectively, is the[ ] quantile of the t distribution with r-s degrees of freedom.
Case 2: (For the distributions of total number of sentences of different stories under 4 different languages)
Here we have analyzed 4 samples of different sizes which are given in case 2 under section VI B.The procedure described in case 1is applied to test the following hypotheses.
HYPOTHESES
Page 405 www.ijiras.com | Email: [email protected]
: The four populations of total number of sentences contained in different stories under different languages do not have identical variance.
Case 3: (For the distribution of mean number of words per sentence of different stories under the different languages)
Here we have analyzed 4 samples of different sizes which are given in case 3 under section VI B. The procedure described in case 1 is applied to test the following hypotheses.
HYPOTHESES
: All of the four populations of mean number of words per sentence of different stories under different languages are identical, except for possibly different means.
: The four populations of mean number of words per sentence of different stories under different languages do not have identical variance.
Case 4: (For the distributions of range of the size of sentences of different stories under different languages)
Here our data consist of 4 independent samples which are given in case 4 under section VI B. The procedure described in case 1 is applied to test the following hypotheses.
HYPOTHESES
: All of the four populations range of the size of sentences of different stories under different languages are identical, except for possibly different means.
: The four populations of range of the size of sentences of different stories under different languages do not have identical variance.
Numerical Result: Results of the above analyses are given in Table 5.
Numerical Data
Language Sample size (rl)
the sum of the squared ranks, Test statistic (Chi-square) d.f Results Total number of words Assamese Bengali English1 English2 30 27 62 16 132596.5 76559 470681.5 149422 22.48 3 is rejected Total number of sentences Assamese Bengali English1 English2 30 27 62 16 173606 173789 346459.5 135392.5 3.69 3 is accepted Mean number of words per sentence Assamese Bengali English1 English2 30 27 62 16 102979.5 44994 552510.5 128324.5 42.8895 3 is rejected range of the
size of sentences Assamese Bengali English1 English2 30 27 62 16 142910.5 73591 433716 178971 27.3329 3 is rejected Table 5: Results of the Squared Rank Test
Conclusion: The critical value of
(23),0.95 is 7.815. From Table 5, it has been noticed that calculated values of the test statistics under the distributions of total number of words, mean number of words per sentence and range of the size of sentences in different stories under the 4 different languages are greater than 7.815. Therefore we may reject our null hypotheses namely , and at 5% level of significance and may conclude that the distributions of total number of words, mean number of words per sentence and range of the size of sentences of different stories under 4 different languages do not have identical variance i.e. they are significantly different corresponds to their variance.However, the calculated value of the test statistic under the distribution of total number of sentences contained in different stories under the 4 different languages is less than 7.815. Therefore we may accept our null hypothesis namely at 5% level of significance and may conclude that the four populations of total number of sentences contained in different stories under different languages have identical variances i.e. they are not significantly different corresponds to their variances.
However when such a null hypothesis is rejected, it is a normal practice to perform Multiple Comparisons Procedure to determine which pairs of populations tend to differ.
Calculation for multiple comparisons are given in Table 6
Numerical Data languages Results Total number of words
1 and 2 1and 3 1 and 4 2 and 3 2 and 4 3 and 4
1584.365 3171.75 4918.99 4756.12 6503.36 1747.24 2634.431 2208.662 3074.328 2289.861 3133.172 2784.732 Not significantly different significantly different significantly different significantly different Significantly different Not significantly different Mean number of words per sentence
1 and 2 1and 3 1 and 4 2 and 3 2 and 4 3 and 4
1766.2056 5478.8097 4587.6313 7245.0152 6353.8368 891.1784 2380.825 1996.043 2778.374 2069.425 2831.554 2516.656 Not significantly different significantly different significantly different significantly different Significantly different Not significantly different range of
the size of sentences
1 and 2 1and 3 1 and 4 2 and 3 2 and 4 3 and 4
2038.0907 2231.736 6422.0042 4269.8268 8460.0949 4190.2681 2576.516 2160.107 3006.742 2239.521 3064.293 2723.512 Not significantly different significantly different significantly different significantly different Significantly different significantly different
Table 6: Results of Multiple Comparisons under Kruskal-Wallis Test
Conclusion: Using multiple comparisons procedure we see that the distributions of total number of words, mean number of words per sentence and range of the size of sentences of different stories under Assamese and Bengali languages are not significantly different with respect to their variances. But they are significantly different from English1 and English2 stories.
Page 406 www.ijiras.com | Email: [email protected]
respect to their variances. But the distributions of range of the size of sentences under English1 and English2 stories are significantly different.
VII.DISCUSSION
Many different methods are used to solve problems of statistical processing of natural language. Some of those methods come under probability, some use statistics, and others use mathematics and so on. Various problems arise due to words used that have multiple meaning and with sentences that are too long. Usually long sentences can be interpreted in several different ways. Methods for clarifying sentences usually use corpus and Markov models which we are going to consider for our future work. It has been observed that all the modern Indian languages originated from Sanskrit whereas English originated from Latin. Probably because of this reason it was found that stories under Assamese and Bengali languages are not significantly different in some cases (means and variances of the distribution of total number of words and total number sentences and variances of the distributions of mean number of words per sentence and range of the size of sentences) and same is the case for English1and English 2 respectively.
REFERENCES
[1] Duda Richard O., Hart Peter E. Stork David G.(2000), Pattern Classification (2nd ed.), John Willey and Sons Inc. [2] Conover W.J. (2006), Practical Nonparametric Statistics
(3rd ed.), John Willey and Sons Inc.
[3] Mukhopadhyay Parimal (2000), Mathematical Statistics (2nd ed.),Books and Allied (P) Ltd
[4] Gun A.M., Gupta M.K., Dasgupta B. (2005) ,An Outline of Statistical Theory, vol 2 (3rd edition), The World Press Private Limited.
[5] Turchi M., Cristianini N. “A Statistical Analysis of Language Evolution” In proceeding of Evolution of Language Sixth International Conference Rome, 12-15 April 2006
[6] Agrawal Shyam S., Mandal Abhimanue, Bansal Shweta, Mahajan Minakshi, “Statistical Analysis of Multilingual Text Corpus and Development of Language Models” In proceeding of the Ninth International Conference on language Resources and Evaluation (LREC) Iceland , 26-31 May, 2014.
[7] Peter F. Brown, Vincent J. Della Pietra, Peter V. de Souza, Jennifer C. Lai, Robert L. Mercer: “Class-Based n-gram Models of Natural Language”. Computational Linguistics 18(4): 467-479 (1992)
[8] Zinger Sveta, “Statistical Natural Language Processing: N-Gram models”, Seminar in Methodology and [9] Statistics, Rijksuniversiteit Groningen, 15th March, 2006. [10][9] Shannon, C. E. (1951). “Prediction and entropy of
printed English”. Bell Systems Technical Journal (30), 50-64.
[11]Bharthi Akshar, Sangal Rajeev and Bendre Sushma M, “Some Observations Regarding Corpora of Indian Languages” Proceedings of KBCS-98, 17-19 Dec 1998, Mumbai.
[12]Bansal Shweta, Mahajan Minakshi, Agrawa S.S. l, “Determination of Linguistic Differences and Statistical Analysis of Large Corpora of Indian Languages” OCOCOSDA, Nov. 2013, Gurgaon, India.
[13]www.wikipedia.org
[14]Bahl L.R., Jelinek F., Mercer R.L. (1983) “A Maximum Likelihood Approach to Continuous Speech
[15]Recognition” IEEE Transactions on Pattern Analysis and Machine Intelligence, PAMI-5(2), 179-190.