Surveillance of WSSV and MBV in
Penaeus
monodon
and SPF
Litopenaeus vannamei
brood
stock from hatcheries in Tamil Nadu and
Andhra Pradesh, Southeast coast of India
N.Manickavel
Marine Virology Laboratory, Centre of Advanced Study in Marine Biology
Faculty of Marine Sciences, Annamalai University, Parangipettai 608 502, Tamil Nadu, India
M.A.Badhul Haq
Marine Virology Laboratory, Centre of Advanced Study in Marine Biology
Faculty of Marine Sciences, Annamalai University, Parangipettai 608 502, Tamil Nadu, India
Maedeh Baharlooeian
Department of fisheries and marine environment, Faculty of marine science and technology Hormozgan University, Bandarabbas, Iran
Esraa Ahamed Mohamed Manie
Departmentof Biotechnology, Faculty of Science, Cairo University, Egypt.
S.Vaitheeswari
Marine Virology Laboratory, Centre of Advanced Study in Marine Biology
Faculty of Marine Sciences, Annamalai University, Parangipettai 608 502, Tamil Nadu, India
R.Bakyaraj
Marine Virology Laboratory, Centre of Advanced Study in Marine Biology Faculty of Marine Sciences, Annamalai University, Parangipettai 608 502, Tamil Nadu, India
similar like WSSV prevalence studies. The surveillance of MBV in the months of October 2011 to September 2012 showed a range of level of infection from 0.95% to 4.76%. For the month wise study of MBV in all 7 hatcheries of Tamil Nadu it was presented in maximum level of infections on November 2011, minimum level of infections in July 2012 and medium level of infections was found in the month of April 2012. Similarly, the same periods in Andhra Pradesh also were recorded in the level of infection range was in 0.95% to 4.76% respectively. For the month wise the maximum level of MBV prevalence was observed in the of November 2011, minimum level of infections were recorded in August 2012 and medium level of infections was noticed in the month of April 2012. In the period of October 2012 to September 2013 the MBV prevalence in the selected 7 hatcheries of Tamil Nadu were shows in the range 0.80% and 2.82%. In addition that, the month wise prevalence study was showed in maximum level of infections were recorded in September 2013, minimum level of infection in March 2013 and medium level of infection was found in May 2013 respectively. For the period of October 2012 to September 2013 the MBV surveillance in Andhra Pradesh was noticed in between 0.80% to 2.50%. The month wise surveillance level was observed in maximum level of MBV infection in November 2012, low level infection in June 2013 and the medium level of infection was noticed in the month of March 2013.
Keywords: Surveillance, WSSV, MBV, Penaeus monodon, Litopenaeus vannamei, infection,
I. INTRODUCTION
Disease has had a major impact on the shrimp farming industry. Since 1981, a succession of new viral pathogens has emerged in Asia and Latin America, causing mass mortalities and threatening the economic sustainability of the industry [1]. Shrimp aquaculture is an industry that has experienced a vigorous and worldwide economic growth. The gradual increase of such activity is most prominent in tropical and subtropical countries. Aquatic animals have been displaced from their natural environment, cultured in high density, exposed to environmental stress, provided artificial or unnatural feeds, and a prolific global trade has developed in both live aquatic animals and their products. At the same time, over-exploitation of fisheries and anthropogenic stress on aquatic ecosystems has placed pressure on wild fish populations. The consequence has been the emergence and spread of an increasing array of new diseases [2]. The main constraint of shrimp culture has always been prevalence of diseases, especially being caused by viral agents. The shrimp culture industry is now facing a crisis of diseases all over the world. So far more than 20 dreadful viral species have been identified from diseased shrimps in various parts of the world [3]. A series of recent studies has shown that viruses have the ability to manipulate the life histories and evolution of their hosts in remarkable ways, challenging our understanding of the almost invisible world of viruses [4].
Viral diseases are among the limiting factors in the accomplishment of saleable shrimp hatchery on a worldwide level. At present, there are more than 20 viruses that affect penaeid shrimps, and these infect both cultured and wild stock [5]. The White Spot Syndrome Virus (WSSV) is one of the widespread and devastating viruses that has affected the shrimp culture industry. However, there are other viruses, which are considered less virulent but can cause significant reduction in the profitability of the culture operations. An example of this is the Penaeus monodon-type baculovirus (MBV), which is implicated in the stunted growth of the shrimp [6]. Shrimp is the largest single seafood commodity by value, accounting for 17% of all the internationally traded fishery products. Approximately 75% of production is from aquaculture which is now almost entirely dominated by two species – the black tiger shrimp (Penaeus monodon) and the white Pacific shrimp (Litopenaeus vannamei) that represents the two most important invertebrate food animals [7].
place was one of the key elements for securing L.vannamei success in Asia. Another major factor was the lower cost of production: about ½ when compared with P.monodon [9].
Indian shrimp farming has been evolved as a leading shrimp culture industry in the international scenario, using locally available crustacean species such as Fenneropenaeus indicus and P.monodon growing in both in salt and brackish waters. However, in the year 2002, an exotic brood (L.vannamei) stock was brought to India by BMR Industries with permission from Government of India. And subsequently two companies were given permission for feasibility studies like the performance and suitability of this exotic species for Indian environment. In the year 2009, the exotic species (L.vannamei) has been accepted for commercial culture in India. And subsequently, permission has been accorded for establishment of hatcheries for this exotic species with a strict biosecurity measures. As the farmers are already suffering with severe economic losses due to prevalence of many diseases with native species, farmers also showing interest in culture of exotic species, as so far there was no specific pathogen free brood stock are available for culture of aquatic organisms, particularly in aquaculture practices.
II. MATERIALS AND METHODS Origin of WSSV and MBV samples
Fig.1. Study area (Tamil Nadu)
Fig.2. Study area (Andhra Pradesh)
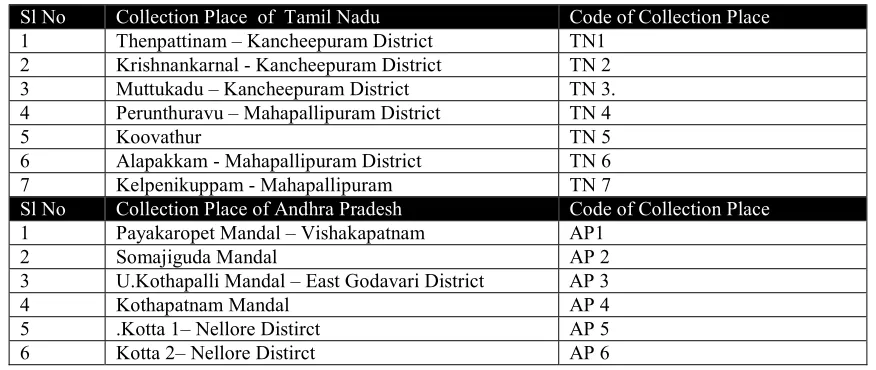
Table - 1 WSSV and MBV collection spot from Tamil Nadu and Andhra Pradesh and Codes for the sample collection spots.
Sl No Collection Place of Tamil Nadu Code of Collection Place
1 Thenpattinam – Kancheepuram District TN1
2 Krishnankarnal - Kancheepuram District TN 2 3 Muttukadu – Kancheepuram District TN 3. 4 Perunthuravu – Mahapallipuram District TN 4
5 Koovathur TN 5
6 Alapakkam - Mahapallipuram District TN 6
7 Kelpenikuppam - Mahapallipuram TN 7
Sl No Collection Place of Andhra Pradesh Code of Collection Place
1 Payakaropet Mandal – Vishakapatnam AP1
2 Somajiguda Mandal AP 2
3 U.Kothapalli Mandal – East Godavari District AP 3
4 Kothapatnam Mandal AP 4
5 .Kotta 1– Nellore Distirct AP 5
7 Idukurpet Mandal - Nellore Dist AP 7
8 Kodur 1 - Nellore Distirct AP 8
9 Kodur 2 - Nellore Distirct AP 9
10 T.P.Gudur Mandal 1 - Nellore Dt AP 10
11 T.P.Gudur Mandal 2 - Nellore Dt AP 11
Sample collection methodology
In the month of totally 1592 shrimps were collected from October 2011 to September 2012 by day wise and from Andhra Pradesh it is about 1592 were collected for those same periods. During the next month of October 2012 to September 2013, 1402 were collected from Andhra Pradesh. Regarding the samples collected from Tamil Nadu hatcheries totally 1060 shrimps were collected for October 2011 to September 2012 by day wise and for the period of October 2012 to September 2013 is about 1142 samples were totally collected for surveillance analysis by [11, 12].
For each and every day collected from those hatcheries the samples were analyzed by the clinical signs as described by the samples were first check for clinical sign as described by Lightner (1996) and followed by Marine Virology Laboratory manual [13, 14]. For the surveillance study in infection of WSSV and MBV data and was maintained in a tabular column format. The calculations of prevalence of WSSV and MBV were made separately in separate tables for each year.
The calculations are made in the following format. Percentage viral infection in Tamil Nadu =
No: of samples collected from Tamil Nadu
No: of samples infected in Tamil Nadu X 100
The percentage of the infections was validated for each month wise for the period of October 2012 to September 2014. The Histograms are made for the surveillance of WSSV and MBV infections [15].
III. RESULT
Table - 2 Surveillance data of WSSV form Tamil Nadu and Andhra Pradesh for the period of October 2011 to September 2012. Months Total collected in both area collected in Tamil Nadu (nos) collected in Andhra Pradesh (nos) WSSV infected in Tamil Nadu (nos) WSSV infected in Andhra Pradesh (nos) Total infected nos of WSSV WSSV infected in Tamil Nadu (%) WSSV infected in Andhra Pradesh (%) Total WSSV Prevalence (%)
Octber’11 198 86 112 12 18 30 13.95 16.07 15.15
November’11 103 42 61 5 9 30 11.9 14.75 29.12
December’11 73 31 42 4 6 24 12.9 14.28 32.87
January’12 258 106 152 12 14 26 11.32 9.21 10.07
Febryaury’12 256 90 166 8 12 20 8.88 7.22 7.81
March’12 248 96 152 10 11 21 10.41 7.23 8.4
April’12 257 101 156 8 9 17 7.92 5.76 6.61
May’12 254 100 154 8 7 15 8 4.48 5.9
June’12 253 102 151 9 8 17 8.82 5.29 6.71
July’12 238 99 139 9 9 18 9.09 6.47 7.56
August’12 247 102 145 9 10 19 8.82 6.75 7.69
September’12 267 105 162 11 14 25 10.47 8.64 9.36
For the infection of WSSV for the period of October 2011 to September 2012 the month in Tamil Nadu is 9.80% and in Andhra Pradesh it is about 11.30%. The total infection of WSSV in Tamil Nadu and Andhra Pradesh for the period of October 2011 to September 2012 is about 8.15% (Table. 2).
The MBV infection for the period of October 2012 to September 2013 in Tamil Nadu is 10.76% and in Andhra Pradesh it is about 12.19%. The total infection of MBV in Tamil Nadu and Andhra Pradesh for the period of October 2011 to September 2012 is about 11.62% (Fig. 3&4).
Fig.4. Surveillance of WSSV in Andhra Pradesh hatcheries for the period of October 2011 to September 2012.
Fig.7. Status of WSSV Surveillance in Tamil Nadu and Andhra Pradesh coastal waters during different months.
Fig.8. Status of MBV surveillance in Tamil Nadu and Andhra Pradesh coastal waters during different months
Table - 3 Surveillance data of WSSV form Tamil Nadu and Andhra Pradesh for the period of October 2012 to September 2013. Months Total collected in both area collected in Tamil Nadu (nos) collected in in Andhra Pradesh (nos) WSSV infected in Tamil Nadu (nos) WSSV infected in Andhra Pradesh (nos) Total infected nos of WSSV WSSV infected in Tamil Nadu (%) WSSV infected in Andhra Pradesh (%) Total WSSV Prevalence (%)
Octber’12 161 71 90 3 11 14 4.23 12.22 8.7
November’12 111 40 71 2 7 9 5 9.86 8.11
December’12 81 40 41 3 5 8 7.5 12.2 9.88
January’13 251 121 130 5 10 15 4.13 7.69 5.98
Febryaury’13 250 125 125 7 9 16 5.6 7.2 6.4
March’13 241 100 141 6 11 17 6 7.8 7.05
April’13 250 120 130 3 8 11 2.5 6.15 4.4
May’13 242 90 152 3 5 8 3.33 3.29 3.31
June’13 251 111 140 7 6 13 6.31 4.29 5.18
July’13 218 108 110 7 8 15 6.48 7.27 6.88
August’13 231 101 130 8 7 15 7.92 5.38 6.49
September’13 257 115 142 9 11 20 7.83 7.75 7.78
In the case of the period of the next year from October 2012 to September 2013 in Tamil Nadu the infection of WSSV is 17.96% and in Andhra Pradesh it is about 13.17%. The total infection of WSSV including Tamil Nadu and Andhra Pradesh for Tamil Nadu and Andhra Pradesh is about 14.97% (Table. 3).
Table - 4 Surveillance data of MBV form Tamil Nadu and Andhra Pradesh for the period of October 2012 to September 2013. Months Total collected in both area collected in Tamil Nadu (nos) collected in in Andhra Pradesh (nos) MBV infected in Tamil Nadu (nos) MBV infected in Andhra Pradesh (nos) Total infected nos of MBV MBV infected in Tamil Nadu (%) MBV infected in Andhra Pradesh (%) Total MBV Prevalence (%)
Octber’11 198 86 112 10 12 22 11.62 10.71 11.11
November’11 103 42 61 6 7 13 14.28 11.47 12.62
December’11 73 31 42 4 6 10 12.9 14.28 13.69
January’12 258 106 152 9 11 20 8.49 7.23 7.75
Febryaury’12 256 90 166 7 10 17 7.77 6.02 6.64
March’12 248 96 152 8 13 21 8.33 8.55 8.46
April’12 257 101 156 10 12 22 9.91 7.69 8.56
May’12 254 100 154 7 10 17 7 6.49 6.69
June’12 253 102 151 9 9 18 8.82 5.96 7.11
July’12 238 99 139 5 10 15 5.05 7.75 6.3
August’12 247 102 145 8 8 16 7.84 5.51 6.47
September’12 267 105 162 10 11 21 9.5 6.79 7.85
For MBV in the same period of October 2012 to September 2013 infection in Tamil Nadu is of 17.53% and in Andhra Pradesh it is 16.06%. Total infection of MBV for the period of October 2012 to September 2013 in both Tamil Nadu and Andhra Pradesh is of 16.40% (Fig. 9& 10; Table.4) .
Table -5 Surveillance data of MBV form Tamil Nadu and Andhra Pradesh for the period of October 2012 to September 2013. Months Total collected in both area collected in Tamil Nadu (nos) collected in in Andhra Pradesh (nos) MBV infected in Tamil Nadu (nos) MBV infected in Andhra Pradesh (nos) Total infected nos of MBV MBV infected in Tamil Nadu (%) MBV infected in Andhra Pradesh (%) Total MBV Prevalence (%)
Octber’12 161 71 90 5 9 14 7.04 10 8.7
November’12 111 40 71 3 6 9 7.5 8.45 8.11
December’12 81 40 41 3 3 6 7.5 7.32 7.41
January’13 251 121 130 6 8 14 4.96 6.15 5.58
Febryaury’13 250 125 125 5 8 13 4 6.4 5.2
March’13 241 100 141 3 10 13 3 7.09 5.39
April’13 250 120 130 6 9 15 5 6.92 6
May’13 242 90 152 5 7 12 5.56 4.61 4.96
June’13 251 111 140 5 5 10 4.5 3.57 3.98
July’13 218 108 110 5 6 14 4.63 5.45 6.42
August’13 231 101 130 7 5 12 6.93 3.85 5.19
September’13 257 115 142 9 7 16 7.83 4.93 6.23
month of 2012 had the highest level of infection. The low level infection was seen in April month of 2013 in Tamil Nadu and in May 2013 Andhra Pradesh shows the lowest infection level (Fig. 11-13; Table.5).
For the period of October 2012 to September 2013 regarding MBV infection in Tamil Nadu high level prevalence was identified at the month of September 2013 and the low level prevalence was recorded in March 2013. Regarding the MBV surveillance for the same period in Andhra Pradesh the high level infection was held on October month and low level infection was on June 2013 (Fig.14).
IV. DISCUSSION
White spot disease is one of the most important shrimp diseases in the world. It is affect most of the commercially cultured shrimp species [17, 18]. The clinical signs of this disease include white spots in the carapace and six abdominal segments, the hepatopancreas was swollen and yellow, the intestine and abdomen was empty and the body colour of infected shrimp become reddish. The gathering of affected shrimp around the edge of the pond throughout the day and during three to ten days 70 to 90 percents of shrimp died [19].
The prevalence study of WSSV and MBV were selected in 7 hatcheries of Tamil Nadu and 11 hatcheries from Andhra Pradesh for the period of two years from October 2011 to September 2012 and October 2012 to September 2013. In present study, the prevalence of WSSV for October 2011 to September 2012 for Tamil Nadu in individual hatcheries it has been shown to range from 3.49% to 0.94% and Andhra Pradesh is ranges from 0.94% to 3.23%. While the study data for month wise in all the 7 hatcheries of Tamil Nadu it shows mostly higher level of infection in October 2011 in the hatcheries, the low level infections was in the month of April 2012 and the medium level infection was recorded in March 2012. For the prevalence of WSSV in Andhra Pradesh the infection range was between 0.94% to 2.33% respectively. While calculating month wise it shows maximum level of infection on the similar month of October 2011, the low level of infection was found on May 2012 and medium level of infection was observed in February 2012 and September 2012 for the 11 hatcheries. Regarding the WSSV prevalence studies for the period of October 2012 to September 2013 the infection ranges is between 0.83% to 2.61% in Tamil Nadu and for the month wise infection level, maximum level of prevalence of WSSV were recorded in the month of August 2013, low level of infection was recorded in April 2013 and medium level infection was found in November 2012. Mean while in Andhra Pradesh for the same period the prevalence of WSSV is between 0.82% to 2.84% and for the prevalence of month wise readings shows in higher level of infection found in November 2012, lower level of infection was found on the June 2013 and the medium level of infections were found on March month of 2013.
In the histogram representation of our prevalence data for the period of WSSV prevalence in Tamil Nadu show high level infection in December 2012, August and September months in 2013, but in Andhra Pradesh October and December month of 2012 had the highest level of infection. The low level infection was seen in April month of 2013 in Tamil Nadu and in May 2013 Andhra Pradesh shows the lowest infection level. For the period of October 2012 to September 2013 regarding MBV infection in Tamil Nadu high level prevalence was identified at the month of September 2013 and the low level prevalence was recorded in March 2013. Regarding the MBV prevalence for the same period in Andhra Pradesh the high level infection was held on October month and low level infection was on June 2013. The histogram of WSSV prevalence for the period of October 2011 to September 2012 in Tamil Nadu was identified for high level infection of WSSV in the October month and low level infection was appeared in April 2012. In the case of Andhra Pradesh for the period of October 2011 to September 2012 the high level infection was detected in October 2011 as like WSSV and low level infection of MBV was viewed in May 2012. The histogram statement of MBV prevalence for the months of October 2011 to September 2011 in Tamil Nadu it shows there high level infection in November 2011 and low level infection in July 2012. For the prevalence of MBV in Andhra Pradesh for the month of October 2011 to September 2011 the lowest level of infection was recorded in February 2012 and the highest level of infection was identified in December 2011.
The samples collected from Andhra Pradesh hatcheries for the period of October 2011 to September 2012 under the view of area histogram peaks show their highest peak of infection of WSSV on AP 5 of September 2012. Regarding the prevalence of WSSV from October 2012 to September 2013 from Tamil Nadu Hatcheries show there high level in TN 6 of September 2013 while viewing under Area Histogram peaks. As per the prevalence of WSSV infection for the month of October 2012 to September 2013 in Andhra Pradesh the high level infection was shown in AP 8 for the month of September 2013. For the period of October 2011 to September 2012 the prevalence of MBV in Tamil Nadu shows high level infection on the April 2012 month that was visualized in the area histogram. The MBV infection for the month of October 2011 to September 2012 in Andhra Pradesh shows there high level infections on March 2012 in AP 6 which can be viewed in Area Histogram. The MBV prevalence for the period of October 2012 to September 2013 in Tamil Nadu Hatcheries there is no peculiar high level infections through out there months there only 1 or 2 infected shrimps are identified on every hatchery. Related to the prevalence of MBV for the period of October 2012 to September 2013 had normal infections of about 1 or 2 infected shrimps were identified for each month in every hatcheries of Andhra Pradesh. MBV has been reported to occur in cultured populations of P.monodon in Taiwan, the Philippines and Tahiti [25, 26].
0.80% to 2.50% and for the month wise prevalence level it vary in maximum level of infection in the month of November 2012, low level infection was observed in June 2013 and medium level of infection was found in the month of March 2013. This aspire of broostock viral disease surveillance program is a great awareness for shrimp farmers, particularly in hatchery sectors.
ACKNOWLEDGMENTS
The authors are thankful to the supports from University Grants Commission research project No: F. No: 41- 4/2012 (SR) and SERB Sanction order No. SR /FT / LS-125/2011, Govt of India for providing funds and authority of Annamalai University for providing facility for this work.
REFERENCES
[1] Walker, P., and R. Subasinghe 1999. DNA-based Molecular Diagnostic Techniques. Report and Proceedings of the Expert Workshop on DNA-based Molecular Diagnostic Techniques: Research Needs for Standardization and Validation of the Detection of Aquatic Animal Pathogens and Diseases, Bangkok, Thailand, 7-9 February, FAO, Rome, Italy. 93 p.
[2] Peter, B., Daniel Wegmann and Laurent Excoffier, 2010. Distinguishing between population bottleneck and population subdivision by a Bayesian model choice procedure, Molecular Ecology, 19:4648-4660.
[3] Lightner, D. V., and R. M. Redman, 1998. Shrimp Diseases and Current Diagnostic Methods. Aquaculture 164 201-220.
[4] Badhul Haq, M. A. and K. Kathiresan, 2010. Marine Viral Diversity. Paper published in the ‘UNU-INWEH-UNESCO International
Training course on Coastal Biodiversity in Mangroves Ecosytems’ organized by CAS in Marine Biology, Faculty of Marine Biology,
Annamalai University, Parangipettai, October 1 – 15, 268-282.
[5] Hernandez-Rodriguez, A., C.Alceste-Oliviero, R. Sánchez, D. Jory, L. Vidal, L.F. Constain-Franco, 2001. Aquaculture development trends in Latin America and the Caribbean. In: R.P.Subasinghe, P. Bueno, M.J. Phillips, C.Hough, S.E. McGladdery, and J.R.Arthur, eds.,2000. Aquaculture in the Third Millennium. Technical Proceedings of the Conference on Aquaculture in the Third Millennium, Bangkok, Thailand, 20–25 February pp. 317–340. NACA, Bangkok and FAO, Rome.
[6] Flegel, T. W., V.Thamavit, T. Pasharawipas, and V. Alday-Sanz, 1999. Statistical correlation between severity of hepatopancreatic parvovirus infection and stunting of farmed black tiger shrimp Penaeus monodon. Aquaculture, 174(3), 197-206.
[7] FAO, 2010. FishStat fishery statistical collections: aquaculture production (1950–2008; released March 2010). Rome, Italy: Food and Agriculture Organization of the United Nations. (Available at http: //www. fao. org/fishery/statistics/software/fishstat/en).
[8] FAO., 2008. State of World Fisheries and Aquaculture (SOFIA), Food and Agricultural Organisation of the United Nations, Rome [9] Anonyms., 2010. Annual Report, Coastal Aquaculture Authority, 23: 170-180pp.
[10] Badhul Haq, M. A., 1996. Studies on the Shrimp farms affected by white spot disease along the vellar estuary, M. Sc dissertation
thesis, CAS in Marine Biology Annamalai University, India, 66 pp.
[11] Badhul Haq, M. A, N. Kavitha, R. Vignesh and R. Shalini, 2012a. Identification and sequence based detection of WSSV infecting
SPF Litopeneaus vannamei (Boone, 1931) in captivity. International Journal of Pharma and Bio Sciences, 3 (1): B 547-559.
[12] Badhul Haq, M. A., P. Kavitha, A. Sajith Ahamed, R. Shalini and M. Srinivasan, 2013. Characterization and propensity of white spot syndrome virus extracted from imported specific pathogen free (SPF) pacific Litopenaeus vannamei brooders progeny by performing SF9 cell line culture. African Journal of microbiology research, 5159- 5165.
[13] Badhul Haq, M. A., 2014. Marine viruses and diagnosis methods. Training manual on marine fish parasites and diseases MHRD Govt of India, New delhi, ISBN: 97881-925094-1-9. 70-79.
[14] Badhul Haq, M. A., M. Nirosh Banu, M. Srinivasan and K. Kathiresan, 2014. Identification of marine viruses associated with SPF
Litopenaeus vannamei an overview. Symposium on recent trends in shrimps farming (RTSF-2014) frontiers of Marine Sciences.
35-38.
[15] Badhul Haq M. A, V. Prabhuraj, R. Vignesh, V. Sedhuraman, M. Srinivasan and S. T. Balasubramaniyan, 2012. Occurrence of white spot syndrome virus in shrimp culturing waters and its brunt in specific pathogen free Litopenaeus vannamei with particular allusion to molecular verdicts. Asian Pacific Journal of Tropical Disease, 1-6.
[16] Sedhuraman, 2015. Molecular epidemiology of WSSV and MBV in Penaeus monodon (Fabriciusin, 1798) and SPF Litopenaeus
vannamei (Boone, 1931)broodstock, Ph.D thesis, CAS in Marine Biology, Faculty of Marine Sciences, Annamalai University, 1 –
296 pp.
[17] Inouye, K., S. Miwa, N. Oseko, H. Nakano, T. Kimura, K. Momoyama, and M. Hiraoka, 1994. Mass mortalities of cultured kuruma shrimp Penaeus japonicus in Japan in 1993: electron microscopic evidence of the causitive virus. Fish Pathology, 29, 149-158. [18] Spann, K. M., and R. J. G. Lester, 1996. Baculovirus of Metapenaeus bennettae from the moret ton Bay region of Australia. Dls
Aquat. org, 27: 53-58
[19] Wang, C. H., C. F. Lo, J. H. Leu, C. M. Chou, and 6 others, 1995. Purification and genomic analysis of baculovirus associated with white spot syndrome (WSS) of Penaeus monodon. Dis Aquat Org, 23: 239–242
[20] Lightner, D. V., 1996. Epizootiology, distribution and the impact on international trade of two penaeid shrimp viruses in the Americas. Revue Scientifique et Technique, 15: 579-601.
[21] Chou, H. Y., C. Y. Huang, C. H. Wang, H. C. Chiang, and C. F. Lo, 1995. Pathogenicity of a baculovirus infection causing White spot syndrome in cultured penaeid shrimp in Taiwan. Dis Aquat Org, 23, 165-173.
[25] Lightner, D. V. . T. A. Bell, R. M. Redman, L. L. Mohney, J. M. Natividad, A. Rukyani, and A. Poernomo, 1992. A review of some major Diseases of economic significance in penaeid prawns/shrimps of the Americas and Indopacific. In: M. Shariff, R. P. Subasinghe, and J. R. Arthur, (Eds) Diseases in Asian aquaculture. Fish Health Section. Asian Fisheries Society, Manila, pp 57-80. [26] Lightner, D. V., R. M. Redman, and T. A. Bell, 1983. Observations on the geographic distribution, pathogenesis and morphology of