R E S E A R C H
Open Access
TRIQ: a new method to evaluate triclusters
David Gutiérrez-Avilés
1*, Raúl Giráldez
1, Francisco Javier Gil-Cumbreras
1and Cristina Rubio-Escudero
2*Correspondence:[email protected]
1School of Engineering, Pablo de
Olavide University, Seville, Spain Full list of author information is available at the end of the article
Abstract
Background: Triclustering has shown to be a valuable tool for the analysis of
microarray data since its appearance as an improvement of classical clustering and biclustering techniques. The standard for validation of triclustering is based on three different measures: correlation, graphic similarity of the patterns and functional annotations for the genes extracted from the Gene Ontology project (GO).
Results: We proposeTRIQ, a single evaluation measure that combines the three
measures previously described: correlation, graphic validation and functional annotation, providing a single value as result of the validation of a tricluster solution and therefore simplifying the steps inherent to research of comparison and selection of solutions.TRIQhas been applied to three datasets already studied and evaluated with single measures based on correlation, graphic similarity and GO terms. Triclusters have been extracted from this three datasets using two different algorithms: TriGen and OPTricluster.
Conclusions: TRIQhas successfully provided the same results as a the three single
evaluation measures. Furthermore, we have appliedTRIQto results from another algorithm,OPTRicluster, and we have shown how TRIQ has been a valid tool to compare results from different algorithms in a quantitative straightforward manner. Therefore, it appears as a valid measure to represent and summarize the quality of tricluster solutions. It is also feasible for evaluation of non biological triclusters, due to the parametrization of each component ofTRIQ.
Keywords: Triclustering, Quality measure, Genetic algorithms, Biological quality,
Graphical quality, Correlation
Background
Analysis of data structured in 3D manner is becoming an essential task in fields such as biomedical research, for instance in experiments studying gene expression data tak-ing time into account. There is a lot of interest in this type of longitudinal experiments because they allow an in-depth analysis of molecular processes in which the time evolu-tion is important, for example, cell cycles, development at the molecular level or evoluevolu-tion of diseases [1]. Therefore, the use of specific tools for data analysis in which genes are evaluated under certain conditions considering the time factor becomes necessary. In this sense, triclustering [2] appears as a valuable tool since it allows for the assessment of genes under a subset of the conditions of the experiment and under a subset of time points.
The evaluation of solutions obtained by triclustering algorithms is challenging by the fact that there is no ground truth to describe triclusters present in real 3D data. In
literature, the standard measures to evaluate tricluster solutions are based on three areas as can be seen in the triclustering publications [3–7]. First, correlation measures such as Pearson [8] or Spearman [9]. Second, graphic validation of the patterns extracted based on the graphic representation, i.e., how similar the genes from a tricluster are based on the graphic representation of the genes across conditions and time points. Third, func-tional annotations extracted from the Gene Ontology project (GO) [10] for the genes in the tricluster.
However, we consider that providing a single evaluation measure capable of combin-ing the information from the three aforementioned sources of validation is a neccesary
task. Therefore, in this work we proposeTRIQ, a validation measure which combines
the three previously proposed validation mechanisms (correlation, graphic validation and functional annotation of the genes).
The application of clustering and biclustering techniques to gene expression data has been broadly studied in the literature [11,12]. Although triclustering is the result from the natural evolution of the clustering and biclustering techniques, is still a very recent concept. However, nowadays, these techniques are arousing a great interest from the scientific community, which has caused a notable increase of the num-ber of researches focused on finding new triclustering approaches. This section is to provide a general overview of triclustering published in literature. We particu-larly focus on the validation methods applied to assess the quality of the triclusters obtained.
In 2005, Zhao and Zaki [3] introduced the triCluster algorithm to extract patterns in 3D gene expression data. They presented a measure to assess triclusters’s qual-ity based on the symmetry property. They validated their triclusters based on their graphical representation and Gene Ontology (GO) results. g-triCluster, an extended and generalized version of Zhao and Zaki’s proposal, was published one year later [4]. The authors claimed that the symmetry property is not suitable for all patterns
present in biological data and proposed the Spearman rank correlation [9] as a more
appropriate tricluster evaluation measure. They also showed validation results based on GO.
An evolutionary computation proposal was made in [13]. The fitness function defined is a multi-objective measure which tries to optimize three conflicting objectives: clus-ters size, homogeneity and gene-dimension variance of the 3D cluster. The tricluster
quality validation was based on GO. LagMiner was introduced in [6] to find
time-lagged 3D clusters, what allows to find regulatory relationships among genes. It is based on a novel 3D cluster model called S2D3 Cluster. They evaluated their
triclus-ters on homogeneity, regulation, minimum gene number, sample subspace size and time periods length. Their validation was based on graphical representation and GO results. Hu et al. presented an approach focusing on the concept of Low-Variance 3-Cluster [5], which obeys the constraint of a low-variance distribution of cell
val-ues. This proposal uses a different functional enrichment tool called CLEAN [14],
which uses GO as one of their components. The work in [7] was focused on
Tchagang et al. [15] proposed OPTricluster, a triclustering algorithm which obtains 3D short time series gene expression datasets by applying a statistical methodology. In this case, the authors carried out an in-depth biological validation based on GO, but they tested the robustness of OPTricluster to noise using the Adjusted Rand Index (ARI) [16], which also was used by aforementioned g-tricluster.
In 2013, two new and very interesting approaches were proposed. On the one hand, the
δ−TRIMAXalgorithm [17], which applies a variant of the MSR adapted to 3D datasets
and yields triclusters that have a MSR score below a thresholdδ. This algorithm has a
ver-sion based on evolutionary multi-objective optimization, namedEMOA−δ−TRIMAX
[18], which aims at optimizing the use of δ −TRIMAX by adding the capabilities of
evolutionary algorithms to retrieve overlapping triclusters. On the other hand, OAC-Triclustering was also proposed by Gnatyshak et al. in [19]. In the following years, the authors developed improvements and extensions of this algorithm [20–22].
More recent works have extended the capabilities of the tricluster algorithms by
com-bination of several approaches. Thereby, Liu et al. [23] mixed fuzzy clustering and
fuzzy biclustering algorithms in order to expands them to support 3D data and they
used theF-Measure and Entropy as criteria to evaluate the performance. Also, Kakati
et al. [24] combined parallel biclustering and distributed triclustering approaches to obtain improvements on the computational cost. In this work, the authors use a
qual-ity measure based on shifting and scaling patterns [25] to optimize the triclusters
obtained.
Most of the methods studied base the quality of the triclusters on the graphic represen-tation or on metrics aimed at measuring diverse characteristics of such represenrepresen-tation. From a biological point of view, the standard for validation of triclusters quality is based on GO functional annotations.
Methods
This section presents the TRIQ (TRIcluster Quality) validation measure [26], a novel method to evaluate the quality of triclusters extracted from gene expression datasets.
From an overall perspective,TRIQtakes into account the three principal components
of a tricluster, i.e. the genes, experimental conditions and time points, in order to measure its quality from three approaches: the level of biological notoriety of the cluster (biological quality), the graphic quality of the patterns of the genes in the tricluster (graphic quality), and the level of correlation of the genes in the tricluster by means of the Pearson [8]
and the Spearman [9] indexes. Therefore,TRIQis composed by a combination of four
indexes:BIOQ(BIOlogical Quality),GRQ(GRaphic Quality),PEQ(PEarson Quality) and
SPQ(SPearman Quality).
In Eq.1we defineTRIQas the weighted sum of each of the four aforementioned terms. Therefore, four associated weights must be defined: the weight forBIOQ, denoted asWbio;
the weight forGRQ, denoted asWgr; the weight forPEQ, denoted asWpe; and the weight
forSPQ, denoted asWsp.
TRIQ(TRI)= 1
Wbio+Wgr+Wpe+Wsp ∗
[Wbio∗BIOQ(TRI)
+Wgr∗GRQ(TRI)+Wpe∗PEQ(TRI)+Wsp∗SPQ(TRI)
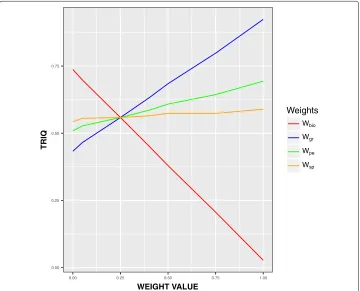
This is a general definition of TRIQ. In order to obtain a TRIQ index as balanced
as possible among the four quality indexesBIOQ, GRQ, PEQ, and SPQwe performed
an exhaustive testing procedure with well known datasets. Several combinations of
val-ues of BIOQ, GRQ, PEQ, and SPQ were tested, and in Fig. 1 we show the results
obtained.
We see that that the value ofTRIQis slightly directly dependent on the weights related to correlation,PEQ, andSPQ. This is due to the fact that these values rank in the [0-1] interval, being usually high, from 0.7 to 1. The value ofTRIQhas a higher level of
depen-dence to the graphical quality, GRQ, and reverse strong dependence to the biological
quality, BIOQ, due to the fact thatBIOQranks in low values, usually around 10−3 to 10−5. Based on this experiments, we have configured theTRIQmeasure with the weights showed in Eq.2in order to obtain a balanced value ofTRIQ.
Wbio=0.5, Wgr=0.4, Wpe=0.05,Wsp=0.05 (2)
Next, we describe in depth each of the terms involved in theTRIQmeasure.
Correlation measures: PEQ and SPQ
The correlation measures involved inTRIQare Pearson’sPEQ[8] and Spearman’sSPQ
[9] correlations. They have been chosen since they are the standard correlation measures and they are widely used in literature [4]. The correlation provides a numerical estimation of the dependence among the genes, conditions and times in the tricluster solutions.
0.00 0.25 0.50 0.75
0.00 0.25 0.50 0.75 1.00
WEIGHT VALUE
TRIQ
Weights
Wbio
Wgr
Wpe
Wsp
Given a triclusterTRI, we computePEQandSPQby the following mechanism. Given the subset of genes (see Eq.3a), conditions (see Eq.3b) and time stamps (see Eq.3c), we obtain a value of expression for each combination gene, condition and time. For instance, for a tricluster consisting of four genes, two conditions and three time points, we have twenty four expression values. We then compute the Pearson correlation for each pair of values, and computePEQas the average of the absolute values to avoid negative and positive correlations canceling each other (see Eq.4). Furthermore, for this measure we do not care if the correlation is positive or negative between values, we only want to know the level of correlation. TheSPQvalue is the equivalent using the Spearman correlation (see Eq.5).
TRIG = <g0,g1,. . .,gG> (3a)
TRIC = <c0,c1,. . .,cC> (3b)
TRIT = <t0,t1,. . .,tT > (3c)
PEQ(TRI)=
#exp
i=0,j=0Pearsoni=j
expi,expj
#pairs of exp (4)
SPQ(TRI)=
#exp
i=0,j=0Spearmani=j
expi,expj
#pairs of exp (5)
withexprepresenting the expressions in each triclusterTRI.
Graphical validation: GRQ
TheGRQmember of Eq.1measures the graphical quality of the tricluster. This
graph-ical quality of a tricluster is a quantitative representation of a qualitative measure: how homogeneous the members of the tricluster are. This method is widely used in literature for visual validation of the results by means of graphically representing the triclusters on their three components: genes, conditions and time points [3,6,7].
TheGRQindex is described in Eq.6. This measure is defined based on the normaliza-tion of the angle value given byMSL. The Multi SLope (MSL) evaluation function was defined in [27] and, given a triclusterTRI, provides a numerical value of the similarity among the angles of the slopes formed by each profile shaped by the genes, conditions, and times of the tricluster.
GRQ(TRI)=1−MSL(TRI)
2π (6)
TheMSLmeasure considers the three graphical views of a tricluster, also defined in [27]:TRIgct,TRIgtc, andTRItgc. These three terms are generally defined asTRIxop, with
the expression levels of the tricluster represented in the Y axis,xrepresents the triclus-ter component in the X axis (genes or time points),orepresents the lines plotted in the graph (genes, conditions or time lines) andpthe type of facets or panels represented (time points or conditions). We can observe an example of theTRItgcview of a tricluster with
the genesg1,g4,g7andg10, the experimental conditionsc2,c5andc8and the time points t0,t2,t11in Fig.2and see how each line or gene forms a set of angles (two for this
par-ticular example) defined by each time point in the X axis for every panel or experimental
condition. Thus,MSLmeasures the differences among the angles formed by every series
traced on each of the three graphic representations taking into accountTRIgct,TRIgtc,
Fig. 2Representation of how theMSLmeasure is calculated. This figure shows three graphics containing four lines each one with a representation of their slopes
therefore, according toGRQ formulation in Eq.6, a tricluster is graphically better the smaller the value ofMSL.
Biological validation: BIOQ
TheBIOQmember of Eq.1measures the biological quality of the tricluster. Specifically,
BIOQuses the genes (TRIG) of the input tricluster TRI to compute this index. As you
can see in Eq. 7, the biological quality of a tricluster TRI is defined as the biological significance,SIGbio, of the set of genesTRIGdivided by theSmaxvalue.
BIOQ(TRI)= SIGbio(TRIG)
Smax
(7)
TheSIGbio andSmaxelements of theBIOQindex have been designed in order to
rep-resent, by means of a quantitative score, the value of the Gene Ontology analysis of the genes that compose the measured tricluster.
The Gene Ontology Project (GO) [10] is a major bioinformatics initiative with the aim of standardizing the representation of gene and gene product attributes across species and databases, besides identifying the annotated terms, performs the statistical analysis for the over-representation of those terms, also providing a statistical significancep-value. However, it is also important to take into account how deep in the ontology the terms are annotated, with the deeper terms being more specific than the superficial ones [28]. The
SIGbioandSmaxelements are calculated based on the GO analysis that identifies, for a set
of genes in a tricluster, the terms listed in each of the three available ontologies: biological processes, cellular components, and molecular functions. This GO analysis is performed with the software Ontologizer [29].
The computation ofSIGbioconsists on counting how many terms of the annotated genes
of the tricluster in the GO analysis are in a particular intervals ofp-value. Table1 repre-sents the ah-hoc designed system of intervals ofp-value and scoring system. The intervals and the scoring system are defined in Eq.8where for a given level,Interlis defined by a
weight valuewlfor the level, and by the lower and upper bounds (infl andsupl,
respec-tively), being an open-closedp-values interval (Eq.8a). The set of existingLV consists of all levels withInflsmaller or equal to a minimump-value,th. For each interval of each
levelInterl, the weight valuewl is defined in Eq.8c;Inflis defined in Eq.8d, andsuplis
Table 1Biological significance intervals
Level (l) Weight (wl) Interval (interl)
41 401 (0.0E-00,1.0E-40]
40 391 (1.0E-40,1.0E-39]
39 381 (1.0E-39,1.0E-38]
38 371 (1.0E-38,1.0E-37]
37 361 (1.0E-37,1.0E-36]
36 351 (1.0E-36,1.0E-35]
35 341 (1.0E-35,1.0E-34]
34 331 (1.0E-34,1.0E-33]
33 321 (1.0E-33,1.0E-32]
32 311 (1.0E-32,1.0E-31]
31 301 (1.0E-31,1.0E-30]
30 291 (1.0E-30,1.0E-29]
29 281 (1.0E-29,1.0E-28]
28 271 (1.0E-28,1.0E-27]
27 261 (1.0E-27,1.0E-26]
26 251 (1.0E-26,1.0E-25]
25 241 (1.0E-25,1.0E-24]
24 231 (1.0E-24,1.0E-23]
23 221 (1.0E-23,1.0E-22]
22 211 (1.0E-22,1.0E-21]
21 201 (1.0E-21,1.0E-20]
20 191 (1.0E-20,1.0E-19]
19 181 (1.0E-19,1.0E-18]
18 171 (1.0E-18,1.0E-17]
17 161 (1.0E-17,1.0E-16]
16 151 (1.0E-16,1.0E-15]
15 141 (1.0E-15,1.0E-14]
14 131 (1.0E-14,1.0E-13]
13 121 (1.0E-13,1.0E-12]
12 111 (1.0E-12,1.0E-11]
11 101 (1.0E-11,1.0E-10]
10 91 (1.0E-10,1.0E-09]
9 81 (1.0E-09,1.0E-08]
8 71 (1.0E-08,1.0E-07]
7 61 (1.0E-07,1.0E-06]
6 51 (1.0E-06,1.0E-05]
5 41 (1.0E-05,1.0E-04]
4 31 (1.0E-04,1.0E-03]
3 21 (1.0E-03,1.0E-02]
2 11 (1.0E-02,1.0E-01]
1 1 (1.0E-01,1.0E-00]
interl =
wl,
infl,supl
(8a)
LV = ∀l∈N:infl≤th (8b)
wl = [(l−1)∗d]+1 (8c)
infl = s
bl (8d)
supl =
s
This definition is made in order to establish a general interval system dependent on the parameters described above. For our purpose, we have settled these parameters as shown in Eq.9; this configuration produces the intervals of Table1, furthermore, it describes all the biological significance intervals for the configuration detailed in Eq.9. For each row, weight (wl) and range (interl) for each level (L) sorted in ascending order are shown.
Each interval provides a set ofp-values where their significance is directly related to the corresponding level, that is, ap-value is better the higher the level to which it belongs, and ap-value is better the closer to zero it is.
th = 1.0×10−40 (9a)
d = 10.0 (9b)
b = 10.0 (9c)
s = 1.0 (9d)
LV = {1,. . ., 41} (9e)
Taking into account each levelland each predefined intervalinterl, the biological
sig-nificance for the genes of the measured tricluster is defined in Eq.10aas the addition of all scores for each levellfrom theLV level set Eq.9e. The score functionSfor a levell
(Eq.10b) is defined by the multiplication of the concentration of terms for this levelC(l), defined in Eq.10cas the number of terms of the levelldivided by the total number of terms, by the weight of the level, and by the level plus a bonus functionfbonus, defined
in Eq.10das the sum of the level plus a bonus valueVbonus if the current level is the
maximum level ofLV or zero in any another case.
SIGbio(TRIG) =
l∈LV
S(l) (10a)
S(l) = C(l)∗wl∗l+fbonus(l) (10b)
C(l) = #terms(l)
#total terms (10c)
fbonus(l) = if (l equal to lmax) then l+Vbonus else0 (10d)
Again, this definition is made in order to establish a general system ofSIGbio. For our
purpose and as a result of an exhaustive testing, theVbonusparameter has been settled to 0; this fact producesSmaxas the maximum achievable score for the interval configuration
as you can see in Eq. (11), that has been used to theSIGbionormalization in Eq.7.
Smax=Cmax∗wl41∗l41
+fbonus(41)=(1∗401∗41)+(41+0)=16482 (11)
Results
In this section, we present howTRIQworks in an experimental environment. To reach
this goal, we have used the TriGen algorithm [2] and the OPTricluster algorithm [15] in order to analyze the datasets, find triclusters and measure them withTRIQ.
TriGenis based on an heuristic, genetic algorithm, and its performance greatly depends
on the fitness function used to find the triclusters. There are three fitness functions avail-able inTriGen: Mean Squared Residue 3D (MSR3D) [30], Least Squared Lines (LSL) [31]
expression levels having the same direction across the time point experiments in subsets of samples taking into consideration the sequential nature of the time-series.
The three datasets analyzed that involve genes and experimental conditions examined under certain time points are:
• Delu3D: The yeast cell cycle(Saccharomyces Cerevisiae) [32], in particular, the elutriation experiment.
• DGDS45103D: The GDS4510 dataset from an experiment with mice (Mus Musculus) [33].
• DGSD44723D: The GDS4472 dataset from an experiments with humans (Homo Sapiens) [34].
The first dataset is available at the Stanford University website. The last two datasets have been retrieved from Gene Expression Omnibus [35], a repository of high throughput gene expression data.
For each dataset, we have performed four algorithm executions:TriGenwithMSR3D
(hereonMSR3D),TriGenwithLSL(hereonLSL),TriGenwithMSLand (hereonMSL) and
OPTricluster(hereonOPT).
For each algorithm execution and dataset, we have yielded 10 triclusters and theTRIQ
measure has been used to evaluate their quality. We have found 10 triclusters for each execution in order to have a high number of solutions whereTRIQcan show its suitability. In the case ofMSR3D,LSL, andMSLexecutions the number of triclusters has been chosen
as one of theTriGenalgorithm parameters and forOPT executions, the tricluster have
been randomly selected from the wide collection of triclusters yielded.
Summarizing, we present three experimental batches (Yeast Elutriation Dataset,Mouse
GDS4510 Dataset and, Human GDS4472 Dataset) with four experiments each one:
MSR3D,LSL,MSLandOPT.
Yeast elutriation dataset
This batch corresponds to the yeast(Saccharomyces Cerevisiae)cell cycle problem [32]. The yeast cell cycle analysis project’s goal is to identify all genes whose mRNA levels are regulated by the cell cycle. The resources used are public and available in http://genome-www.stanford.edu/cellcycle/. There, we can find information relative to gene expression values obtained from different experiments using microarrays.
For our purpose, we have created a datasetDelu3Dfrom the elutriation experiment with 7744 genes, 13 experimental conditions, and 14 time points. Experimental conditions cor-respond to different statistical measures of the Cy3 and Cy5 channels while time points represent different moments of taking measures from 0 to 390 min.
Delu3Dhas been used as the input of theTriGenand theOPTtriclusteralgorithm in four experiments:MSR3D,LSL,MSLand,OPT.
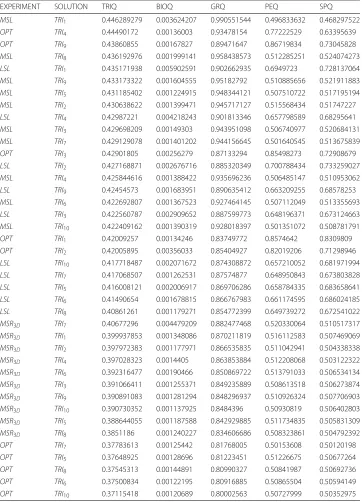
Elutriation MSR3Dexperiment
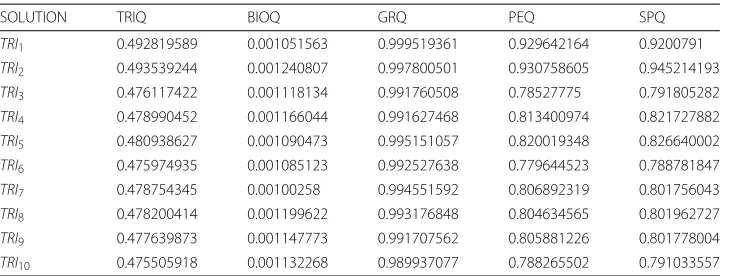
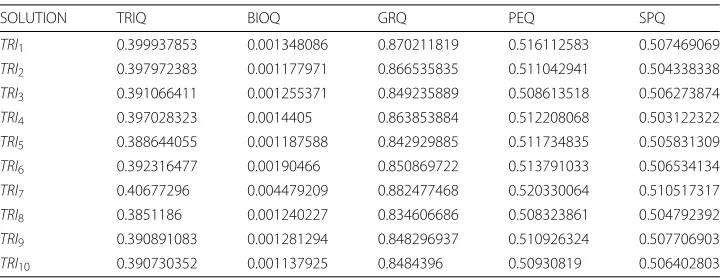
We can verify in Table2howTRI9has the best values ofBIOQ,PEQandSPQwhereas
TRI10 has the best value of GRQ. TheGRQ, PEQand SPQvalues are stabilized from
TRI2toTRI8untilTRI9−TRI10when these values reach the maximum. RegardingBIOQ
values, these vary around 0.0012. Furthermore,TRIQvalues are stable for all solutions exceptTRI9−TRI10due to the genetic algorithms nature. In conclusion,TRI9is the best
Table 2MSR3DElutriation solution table
SOLUTION TRIQ BIOQ GRQ PEQ SPQ
TRI1 0.289957861 0.001180518 0.627911696 0.400860192 0.363198285
TRI2 0.283154367 0.001118227 0.610190268 0.397890126 0.372492792
TRI3 0.292658244 0.001217404 0.632360796 0.39778358 0.384320901
TRI4 0.283891286 0.001085482 0.614807027 0.38713593 0.36137875
TRI5 0.282839356 0.001224203 0.613862367 0.379462124 0.354184014
TRI6 0.290639052 0.001129778 0.625267377 0.4293412 0.370003051
TRI7 0.259777538 0.001208157 0.553613841 0.382072259 0.372486191
TRI8 0.281909708 0.001215203 0.606726347 0.407953984 0.36427737
TRI9 0.453932884 0.001330144 0.896650615 0.986952953 0.905198358
TRI10 0.45152166 0.001148045 0.934659815 0.776480244 0.765193987
Elutriation LSL experiment
In Table3you can see howTRI3has the best value ofBIOQ,TRI2has the best value of GRQ, TRI6has the best value ofPEQ and,TRI1has the best value ofSPQ. In general,
theGRQ,PEQandSPQvalues vary around an average value fromTRI1untilTRI8. Then,
these values decrease inTRI9−TRI10solutions due to the fact that the algorithm reached
a local minimum in this two solutions; theBIOQvalues fluctuate around 0.0012 value
reaching a maximum inTRI3and a minimum in TRI4. The values of TRIQ reach the
maximum values at the first two solutions, then remain stable and finally fall in local minimum in the last two solutions. In conclusion,TRI1is the best solution since it has
the best value ofTRIQ.
Elutriation MSL experiment
We can observe in Table4howTRI2has the best value ofBIOQ,PEQandSPQwhereas
TRI1 has the best value of GRQ. The GRQ, PEQ and SPQ have a stable fluctuation
throughout the solutions whilst BIOQ varying around the central value 0.0011. The
TRIQvalues reach their maximum value atTRI2, the minimum atTRI3and the rest are
stabilized. In conclusion,TRI2is the best solution since it has the best value ofTRIQ.
Elutriation OPT experiment
We can verify in Table5 how all triclusters have the same value ofBIOQsince all tri-clusters grouped the same collection of genes. RegardingGRQindex, the triclusters have values between 0.70 and 0.86 with the exception ofTRI1,TRI9and,TRI8beingTRI4the
solution with betterGRQ. ThePEQandSPQindexes have fluctuating values beingTRI7
Table 3LSLElutriation solution table
SOLUTION TRIQ BIOQ GRQ PEQ SPQ
TRI1 0.444841672 0.001147115 0.925741144 0.737449684 0.741983455
TRI2 0.444050729 0.001217804 0.927628308 0.725178526 0.722631553
TRI3 0.434940552 0.001327826 0.912385527 0.697309668 0.689138899
TRI4 0.431591352 0.001071675 0.905144571 0.692097513 0.6878562
TRI5 0.433960732 0.001125858 0.913689264 0.683063155 0.675378795
TRI6 0.440497687 0.001192667 0.916680329 0.743684691 0.720899755
TRI7 0.437721769 0.001143537 0.916956452 0.702066665 0.705281726
TRI8 0.441054484 0.001233014 0.919127603 0.730818495 0.724920229
TRI9 0.41970611 0.001200657 0.894690897 0.629273489 0.595314967
Table 4MSLElutriation solution table
SOLUTION TRIQ BIOQ GRQ PEQ SPQ
TRI1 0.492819589 0.001051563 0.999519361 0.929642164 0.9200791
TRI2 0.493539244 0.001240807 0.997800501 0.930758605 0.945214193
TRI3 0.476117422 0.001118134 0.991760508 0.78527775 0.791805282
TRI4 0.478990452 0.001166044 0.991627468 0.813400974 0.821727882
TRI5 0.480938627 0.001090473 0.995151057 0.820019348 0.826640002
TRI6 0.475974935 0.001085123 0.992527638 0.779644523 0.788781847
TRI7 0.478754345 0.00100258 0.994551592 0.806892319 0.801756043
TRI8 0.478200414 0.001199622 0.993176848 0.804634565 0.801962727
TRI9 0.477639873 0.001147773 0.991707562 0.805881226 0.801778004
TRI10 0.475505918 0.001132268 0.989937077 0.788265502 0.791033557
the tricluster with the betterPEQandSPQ. In conclusion,TRI7is the best solution since
it has the best value ofTRIQ.
Elutriation summary
We can see in Fig. 3 how the solutions are distributed regarding BIOQ and GRQ
for each experiment. We observe that all points are concentrated in a BIOQinterval
of [ 0.000728, 0.0013] for each experiment meanwhile theMSLexperiment stands out
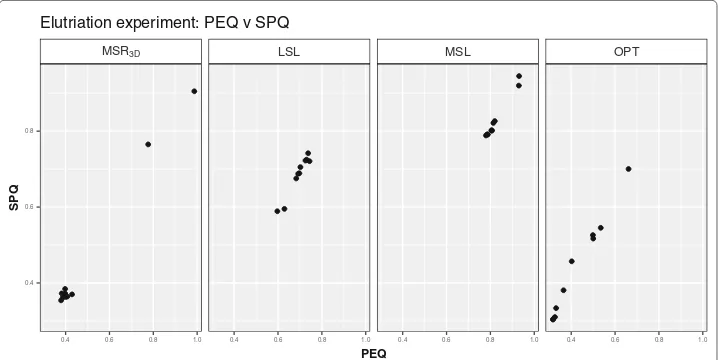
because all its solutions have aGRQnear to 1. Regarding thePEQ andSPQsolutions
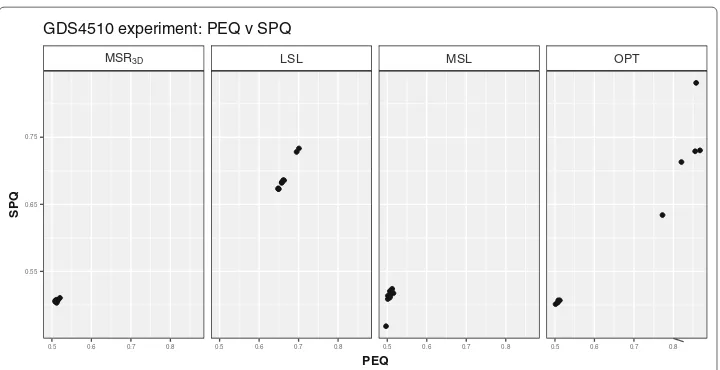
distribution, we can see in Fig. 4 how the majority of the solutions are concentrated
around the pointPEQ =0.325,SPQ= 0.325 in theMSR3Dexperiment, all solutions are
concentrated in [ 0.50, 0.75] interval forPEQandSPQin theLSLexperiment, all solu-tions are concentrated in [ 0.75, 1.00] interval forPEQandSPQin theMSLexperiment and, all solutions are concentrated in [ 0.30, 0.70] interval forPEQandSPQin theOPT
experiment.
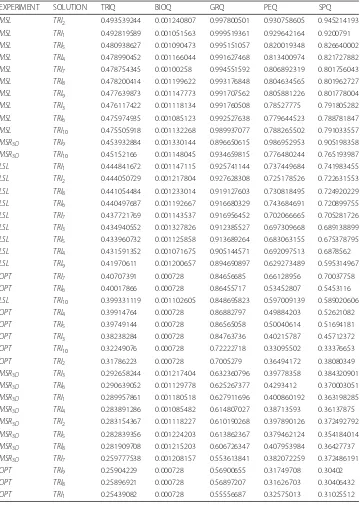
The global TRIQ-based ranking of solutions is showed in Table 6; we can see how
the solutions of theMSLexperiment are placed on the first positions followed by two
outstanding solutions of theMSR3Dexperiment, all solutions of theLSLexperiment, all
solutions of theOPTexperiment and, the remaining solutions of theMSR3Dexperiment.
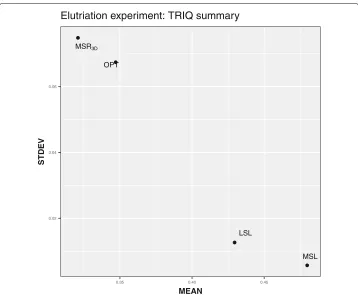
TheMSLexperiment has the best average values ofTRIQand the lowest standard devi-ation ofTRIQas seen in Table7. This fact is reflected in Fig.5wherein theMSLpoint is located on the bottom-right side of the graph which implies that theMSLexperiment has
Table 5OPTElutriation solution table
SOLUTION TRIQ BIOQ GRQ PEQ SPQ
TRI1 0.25439082 0.000728 0.55556687 0.32575013 0.31025512
TRI2 0.31786223 0.000728 0.7005279 0.36494172 0.38080349
TRI3 0.38238284 0.000728 0.84763736 0.40215787 0.45712372
TRI4 0.39914764 0.000728 0.86882797 0.49884203 0.52621082
TRI5 0.39749144 0.000728 0.86565058 0.50040614 0.51694181
TRI6 0.40017866 0.000728 0.86455717 0.53452807 0.5453116
TRI7 0.40707391 0.000728 0.84656685 0.66128956 0.70037758
TRI8 0.25896921 0.000728 0.56897207 0.31626703 0.30406432
TRI9 0.25904229 0.000728 0.56900655 0.31749708 0.30402
MSR3D LSL MSL OPT
0.0008 0.0010 0.0012 0.0008 0.0010 0.0012 0.0008 0.0010 0.0012 0.0008 0.0010 0.0012 0.6
0.7 0.8 0.9 1.0
BIOQ
GRQ
Elutriation experiment: BIOQ v GRQ
Fig. 3BIOQvsGRQdispersion graph for each Elutriation solution of each experiment
the highest values ofTRIQand a sparsely dispersed distribution, thus this is a high-quality experiment.
The most valuable solution of all experiments is the triclusterTRI2of theMSL
exper-iment. We can see in Fig.6its three graphic views showing that its high value ofGRQ
is reflected in the patterns depicted. Furthermore, in Table 8 we observe terms with
moderately low p-value as fermentation, vesicle fusion to plasma membrane and
exo-cytosis. Fermentation is a biological process that is part of the process called energy
derivation by oxidation of organic compounds and, in turn, belongs to the generation
of precursor metabolites and energyprocess andthe oxidation-reduction process;Vesicle
fusion to plasma membraneis a biological process that is part of theexocytosis proccess;
the first term is a process ofcellular component organizationwhereas the second is an
establishment of localization process.
MSR3D LSL MSL OPT
0.4 0.6 0.8 1.0 0.4 0.6 0.8 1.0 0.4 0.6 0.8 1.0 0.4 0.6 0.8 1.0
0.4 0.6 0.8
PEQ
SPQ
Elutriation experiment: PEQ v SPQ
Table 6Elutriation ranking table
EXPERIMENT SOLUTION TRIQ BIOQ GRQ PEQ SPQ
MSL TRI2 0.493539244 0.001240807 0.997800501 0.930758605 0.945214193
MSL TRI1 0.492819589 0.001051563 0.999519361 0.929642164 0.9200791
MSL TRI5 0.480938627 0.001090473 0.995151057 0.820019348 0.826640002
MSL TRI4 0.478990452 0.001166044 0.991627468 0.813400974 0.821727882
MSL TRI7 0.478754345 0.00100258 0.994551592 0.806892319 0.801756043
MSL TRI8 0.478200414 0.001199622 0.993176848 0.804634565 0.801962727
MSL TRI9 0.477639873 0.001147773 0.991707562 0.805881226 0.801778004
MSL TRI3 0.476117422 0.001118134 0.991760508 0.78527775 0.791805282
MSL TRI6 0.475974935 0.001085123 0.992527638 0.779644523 0.788781847
MSL TRI10 0.475505918 0.001132268 0.989937077 0.788265502 0.791033557
MSR3D TRI9 0.453932884 0.001330144 0.896650615 0.986952953 0.905198358
MSR3D TRI10 0.45152166 0.001148045 0.934659815 0.776480244 0.765193987
LSL TRI1 0.444841672 0.001147115 0.925741144 0.737449684 0.741983455
LSL TRI2 0.444050729 0.001217804 0.927628308 0.725178526 0.722631553
LSL TRI8 0.441054484 0.001233014 0.919127603 0.730818495 0.724920229
LSL TRI6 0.440497687 0.001192667 0.916680329 0.743684691 0.720899755
LSL TRI7 0.437721769 0.001143537 0.916956452 0.702066665 0.705281726
LSL TRI3 0.434940552 0.001327826 0.912385527 0.697309668 0.689138899
LSL TRI5 0.433960732 0.001125858 0.913689264 0.683063155 0.675378795
LSL TRI4 0.431591352 0.001071675 0.905144571 0.692097513 0.6878562
LSL TRI9 0.41970611 0.001200657 0.894690897 0.629273489 0.595314967
OPT TRI7 0.40707391 0.000728 0.84656685 0.66128956 0.70037758
OPT TRI6 0.40017866 0.000728 0.86455717 0.53452807 0.5453116
LSL TRI10 0.399331119 0.001102605 0.848695823 0.597009139 0.589020606
OPT TRI4 0.39914764 0.000728 0.86882797 0.49884203 0.52621082
OPT TRI5 0.39749144 0.000728 0.86565058 0.50040614 0.51694181
OPT TRI3 0.38238284 0.000728 0.84763736 0.40215787 0.45712372
OPT TRI10 0.32249076 0.000728 0.72222718 0.33095502 0.33376653
OPT TRI2 0.31786223 0.000728 0.7005279 0.36494172 0.38080349
MSR3D TRI3 0.292658244 0.001217404 0.632360796 0.39778358 0.384320901
MSR3D TRI6 0.290639052 0.001129778 0.625267377 0.4293412 0.370003051
MSR3D TRI1 0.289957861 0.001180518 0.627911696 0.400860192 0.363198285
MSR3D TRI4 0.283891286 0.001085482 0.614807027 0.38713593 0.36137875
MSR3D TRI2 0.283154367 0.001118227 0.610190268 0.397890126 0.372492792
MSR3D TRI5 0.282839356 0.001224203 0.613862367 0.379462124 0.354184014
MSR3D TRI8 0.281909708 0.001215203 0.606726347 0.407953984 0.36427737
MSR3D TRI7 0.259777538 0.001208157 0.553613841 0.382072259 0.372486191
OPT TRI9 0.25904229 0.000728 0.56900655 0.31749708 0.30402
OPT TRI8 0.25896921 0.000728 0.56897207 0.31626703 0.30406432
OPT TRI1 0.25439082 0.000728 0.55556687 0.32575013 0.31025512
Table 7Elutriation summary table
EXPERIMENT BEST SOLUTION BEST TRIQ MEAN STDEV
MSR3D TRI9 0.453932884 0.317028196 0.072095449
LSL TRI1 0.444841672 0.432769621 0.013833102
MSL TRI2 0.493539244 0.480848082 0.006701521
MSR3D LSL MSL OPT 0.02 0.04 0.06 5 4 . 0 0 4 . 0 5 3 . 0 MEAN STDEV
Elutriation experiment: TRIQ summary
Fig. 5MEANvsSTDEVdispersion graph for each Elutriation experiment
Mouse GDS4510 dataset
This batch corresponds to the mouse GDS4510 dataset. This dataset was obtained from GEO [35] with accession code GDS4510 and titlerd1 model of retinal degeneration: time
course[33]. In this experiment, the degeneration of retinal cells in different individuals of
home mouse(Mus musculus)is analyzed over 4 days just after birth, specifically on days 2, 4, 6 and 8.
Conditions for each Time
genes e xpression le v els 0 5000 10000 15000 20000
POLY A FUN21 YAR052C 0 min 0 5000 10000 15000 20000 330 min 0 5000 10000 15000 20000 390 min
Times for each Condition
genes e xpression le v els 0 5000 10000 15000 20000
POLY A FUN21 YAR052C CH1I 0 5000 10000 15000 20000 CH2I 0 5000 10000 15000 20000 CH2D 0 5000 10000 15000 20000 CH2IN 0 5000 10000 15000 20000 CH2DN
Genes for each Condition
times e xpression le v els 0 5000 10000 15000 20000 n i m 0 9 3 n i m 0 3 3 n i m 0 CH1I 0 5000 10000 15000 20000 CH2I 0 5000 10000 15000 20000 CH2D 0 5000 10000 15000 20000 CH2IN 0 5000 10000 15000 20000 CH2DN
Table 8TRI2GO table of theMSLElutriation experiment
TERM ID TERM P-VALUE
GO:0006113 Fermentation 7.39E-04
GO:0099500 Vesicle fusion to plasma membrane 0.001183063
GO:0006887 Exocytosis 0.001183063
GO:0140029 Exocytic process 0.001183063
GO:0045026 Plasma membrane fusion 0.00141327
GO:0000145 Exocyst 0.001794132
GO:0048193 Golgi vesicle transport 0.002271213
GO:0061025 Membrane fusion 0.002444417
GO:0051039 Positive regulation of transcription involved in meiotic cell cycle 0.002483587 GO:0051436 Negative regulation of ubiquitin-protein ligase activity involved in mitotic cell cycle 0.002483587
GO:0051439 Regulation of ubiquitin-protein ligase activity involved in mitotic cell cycle 0.002483587 GO:1904667 Negative regulation of ubiquitin protein ligase activity 0.002483587
GO:0032940 Secretion by cell 0.00251212
GO:0046903 Secretion 0.00251212
GO:0051049 Regulation of transport 0.002574368
GO:0061024 Membrane organization 0.002785422
GO:0051321 Meiotic cell cycle 0.003307558
GO:1903046 Meiotic cell cycle process 0.003307558
GO:0140013 Meiotic nuclear division 0.003307558
GO:0044275 Cellular carbohydrate catabolic process 0.004058262
For our purpose, we have created a dataset DGDS45103D composed of 22690 genes,
8 experimental conditions (one for each individual involved in the biological experiment) and 4 time points.
DGDS45103Dhas been used as the input of theTriGenand theOPTtriclusteralgorithm in four experiments:MSR3D,LSL,MSLand,OPT.
GDS4510 MSR3Dexperiment
We can verify in Table9howTRI7has the best value ofBIOQ,GRQ,PEQ,SPQ. TheGRQ,
PEQandSPQindexes vary uniformly among all the solutions.BIOQhas a peak ofTRI7
which has the maximum value. TheTRIQvalues oscillate between 0.385 and 0.4 with the
exception ofTRI7, therefore this is the best solution since it has the best value ofTRIQ.
GDS4510 LSL experiment
In Table10we can see howTRI1has the best value ofBIOQandGRQmeanwhileTRI2has
the best values ofPEQandSPQ. TheGRQ,PEQandSPQvalues vary uniformly around
Table 9MSR3DGDS4510 solution table
SOLUTION TRIQ BIOQ GRQ PEQ SPQ
TRI1 0.399937853 0.001348086 0.870211819 0.516112583 0.507469069
TRI2 0.397972383 0.001177971 0.866535835 0.511042941 0.504338338
TRI3 0.391066411 0.001255371 0.849235889 0.508613518 0.506273874
TRI4 0.397028323 0.0014405 0.863853884 0.512208068 0.503122322
TRI5 0.388644055 0.001187588 0.842929885 0.511734835 0.505831309
TRI6 0.392316477 0.00190466 0.850869722 0.513791033 0.506534134
TRI7 0.40677296 0.004479209 0.882477468 0.520330064 0.510517317
TRI8 0.3851186 0.001240227 0.834606686 0.508323861 0.504792392
TRI9 0.390891083 0.001281294 0.848296937 0.510926324 0.507706903
Table 10LSLGDS4510 solution table
SOLUTION TRIQ BIOQ GRQ PEQ SPQ
TRI1 0.435171938 0.005902591 0.902662935 0.6949723 0.728137064
TRI2 0.427168871 0.002676716 0.885320349 0.700788434 0.733259027
TRI3 0.422560787 0.002909652 0.887599773 0.648196371 0.673124663
TRI4 0.42987221 0.004218243 0.901813346 0.657798589 0.68295641
TRI5 0.416008121 0.002006917 0.869706286 0.658784335 0.683658641
TRI6 0.41490654 0.001678815 0.866767983 0.661174595 0.686024185
TRI7 0.417068507 0.001262531 0.87574877 0.648950843 0.673803828
TRI8 0.40861261 0.001179271 0.854772399 0.649739272 0.672541022
TRI9 0.42454573 0.001683951 0.890635412 0.663209255 0.68578253
TRI10 0.417718487 0.002071672 0.874308872 0.657210052 0.681971994
a central value among the triclusters whereasBIOQhas peak values inTRI1andTRI4.
TheTRIQvalues oscillates between 0.40 and 0.43 beingTRI1,TRI4andTRI9the most
outstanding solutions. We can conclude thatTRI1is the best solution since it has the best
value ofTRIQ.
GDS4510 MSL experiment
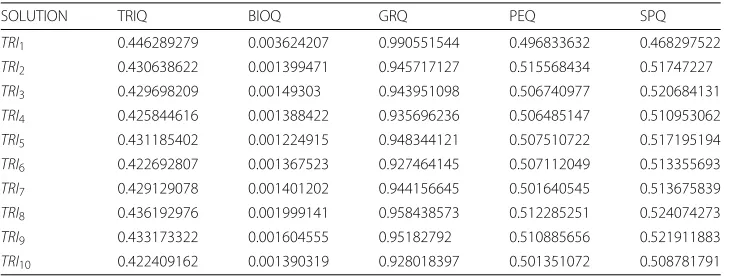
For this experiment, we can observe in Table11howTRI1has the best value ofBIOQ
andGRQmeanwhileTRI2has the best value ofPEQandTRI8has the best value ofSPQ.
ThePEQandSPQindexes of all solutions vary uniformly around 0.5 whereas all theGRQ
values are close to 0.9. TheBIOQvalues oscillate between 0.0012 and 0.0019 reaching
its higher value in theTRI1solution. TheTRIQ values are in the [ 0.42, 0.44] interval,
therefore we can conclude that they are good results for this experiment. The highest value ofTRIQis reached byTRI1, hence it is the best solution for this experiment.
GDS4510 OPT experiment
In Table12we can see howTRI2has the best value ofBIOQ,TRI4has the best value of
GRQand,TRI9andTRI1have the best value ofPEQandSPQrespectively. TheBIOQ
values vary among [ 0.0012, 0.0016] interval with the exception ofTRI2andTRI3whilst
theGRQvalues vary uniformly around the 0.80 value exceptingTRI4. ThePEQandSPQ
values oscillate among the [ 0.5, 0.8] interval.The highest value ofTRIQis reached byTRI4,
thus it is the best solution for this experiment.
Table 11MSLGDS4510 solution table
SOLUTION TRIQ BIOQ GRQ PEQ SPQ
TRI1 0.446289279 0.003624207 0.990551544 0.496833632 0.468297522
TRI2 0.430638622 0.001399471 0.945717127 0.515568434 0.51747227
TRI3 0.429698209 0.00149303 0.943951098 0.506740977 0.520684131
TRI4 0.425844616 0.001388422 0.935696236 0.506485147 0.510953062
TRI5 0.431185402 0.001224915 0.948344121 0.507510722 0.517195194
TRI6 0.422692807 0.001367523 0.927464145 0.507112049 0.513355693
TRI7 0.429129078 0.001401202 0.944156645 0.501640545 0.513675839
TRI8 0.436192976 0.001999141 0.958438573 0.512285251 0.524074273
TRI9 0.433173322 0.001604555 0.95182792 0.510885656 0.521911883
Table 12OPTGDS4510 solution table
SOLUTION TRIQ BIOQ GRQ PEQ SPQ
TRI1 0.42009257 0.00134246 0.83749772 0.8574642 0.8309809
TRI2 0.42005895 0.00356033 0.85404927 0.82019206 0.71298946
TRI3 0.42901805 0.00256279 0.87133294 0.85498273 0.72908679
TRI4 0.44490172 0.00136003 0.93478154 0.77222529 0.63395639
TRI5 0.37648925 0.00128696 0.81223451 0.51226675 0.50677264
TRI6 0.37500834 0.00122195 0.80916885 0.50865504 0.50594149
TRI7 0.37783613 0.00125442 0.81768005 0.50153608 0.50120198
TRI8 0.37545313 0.00144891 0.80990327 0.50841987 0.50692736
TRI9 0.43860855 0.00167827 0.89471647 0.86719834 0.73045828
TRI10 0.37115418 0.00120689 0.80002563 0.50727999 0.50352975
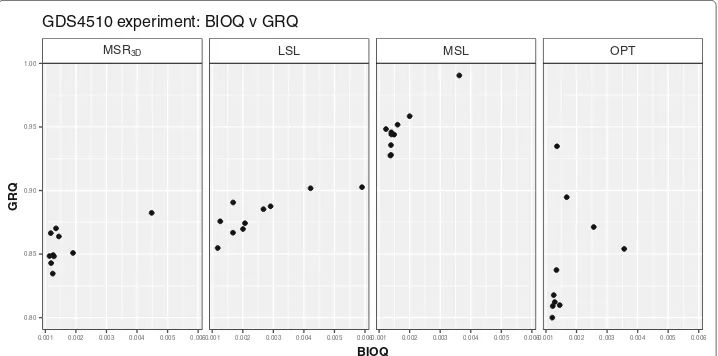
GDS4510 summary
We can see how the solutions are distributed regarding BIOQ and GRQ in Fig. 7;
we observe that all points of all experiments are concentrated in a BIOQ interval of
[ 0.0011, 0.0059]. Regarding the GRQvalues, the MSR3D andLSLexperiments have all
the solutions in the [ 0.83, 0.90] interval, theMSLexperiment has all the solutions in the [ 0.92, 0.99] interval and, theOPTexperiment has all the solutions in the [ 0.80, 0.95]
inter-val. Regarding thePEQ andSPQdistribution we can see in Fig.8 how the majority of
solutions are concentrated around the pointPEQ = 0.5,SPQ = 0.5 in theMSR3Dand
MSLexperiments, meanwhile the solutions ofLSLexperiment are concentrated in the
interval [ 0.625, 0.75] forPEQandSPQvalues and, theOPT experiment has his solutions dispersed in two groups: one group around thePEQ=0.5,SPQ=0.5 point and the other in an interval of [ 0.60, 0.83] for bothPEQandSPQvalues.
A globalTRIQ-based ranking of solutions is shown in Table13. TheMSL,LSLand a part ofOPT solutions are placed alternatively on the first positions and theMSR3Dand
the remaining ofOPTsolutions are in the last positions.
We can see in Table14how the GDS4510MSLexperiment has the best value of the
mean ofTRIQand the four experiments have low values of standard deviation having
theMSR3Dexperiment the lowest value but very close to theMSLone. This fact implies
MSR3D LSL MSL OPT
0.001 0.002 0.003 0.004 0.005 0.0060.001 0.002 0.003 0.004 0.005 0.0060.001 0.002 0.003 0.004 0.005 0.0060.001 0.002 0.003 0.004 0.005 0.006 0.80
0.85 0.90 0.95 1.00
BIOQ
GRQ
GDS4510 experiment: BIOQ v GRQ
MSR3D LSL MSL OPT
0.5 0.6 0.7 0.8 0.5 0.6 0.7 0.8 0.5 0.6 0.7 0.8 0.5 0.6 0.7 0.8
0.55 0.65 0.75
PEQ
SPQ
GDS4510 experiment: PEQ v SPQ
Fig. 8PEQvsSPQdispersion graph for each GDS4510 solution of each experiment
that the four experiments have a low sparse distribution and solutions with high quality.
We can see in Fig.9how theMSR3D,LSLand,MSLpoints are located on the bottom
side of the graph meanwhile the OPT point is located in a high level of the standard
deviation axis; on the other hand,LSLand,MSLpoints are located on the right side of the graph meanwhile theMSR3DandOPTpoints are located in a left level of the average
axis. Hence, in terms of standard deviation and average, we can conclude thatMSLis the best experiment.
The most valuable solution of all experiments is the triclusterTRI1of theMSL
exper-iment. We can see in Fig.10how this solution depicts very uniform patterns consistent
with the GRQ value. Also, we can see in Table15 that this solution has Gene
Ontol-ogy terms with lowp-value such as sensory perception of chemical stimulus, olfactory
receptor activityordetection of chemical stimulus involved in sensory perception of smell.
The term olfactory receptor activity is a molecular function that combining with an
odorant and transmitting the signal from one side of the membrane to the other to ini-tiate a change in cell activity in response to detection of smell; this function is part of the biological process detection of chemical stimulus involved in sensory perception
of smell that is the series of events involved in the perception of smell in which an
olfactory chemical stimulus is received and converted into a molecular signal. Finally, that process is framed in a more general biological process calledsensory perception of
chemical stimulusthat is the series of events required for an organism to receive a
sen-sory chemical stimulus, convert it to a molecular signal, and recognize and characterize the signal.
Human GDS4472 dataset
The dataset, corresponding to this batch, has been obtained from GEO [35] under code
GDS4472 titled Transcription factor oncogene OTX2 silencing effect on D425
medul-loblastoma cell line: time course[34]. In this experiment, the effect of doxycycline on
Table 13GDS4510 ranking table
EXPERIMENT SOLUTION TRIQ BIOQ GRQ PEQ SPQ
MSL TRI1 0.446289279 0.003624207 0.990551544 0.496833632 0.468297522
OPT TRI4 0.44490172 0.00136003 0.93478154 0.77222529 0.63395639
OPT TRI9 0.43860855 0.00167827 0.89471647 0.86719834 0.73045828
MSL TRI8 0.436192976 0.001999141 0.958438573 0.512285251 0.524074273
LSL TRI1 0.435171938 0.005902591 0.902662935 0.6949723 0.728137064
MSL TRI9 0.433173322 0.001604555 0.95182792 0.510885656 0.521911883
MSL TRI5 0.431185402 0.001224915 0.948344121 0.507510722 0.517195194
MSL TRI2 0.430638622 0.001399471 0.945717127 0.515568434 0.51747227
LSL TRI4 0.42987221 0.004218243 0.901813346 0.657798589 0.68295641
MSL TRI3 0.429698209 0.00149303 0.943951098 0.506740977 0.520684131
MSL TRI7 0.429129078 0.001401202 0.944156645 0.501640545 0.513675839
OPT TRI3 0.42901805 0.00256279 0.87133294 0.85498273 0.72908679
LSL TRI2 0.427168871 0.002676716 0.885320349 0.700788434 0.733259027
MSL TRI4 0.425844616 0.001388422 0.935696236 0.506485147 0.510953062
LSL TRI9 0.42454573 0.001683951 0.890635412 0.663209255 0.68578253
MSL TRI6 0.422692807 0.001367523 0.927464145 0.507112049 0.513355693
LSL TRI3 0.422560787 0.002909652 0.887599773 0.648196371 0.673124663
MSL TRI10 0.422409162 0.001390319 0.928018397 0.501351072 0.508781791
OPT TRI1 0.42009257 0.00134246 0.83749772 0.8574642 0.8309809
OPT TRI2 0.42005895 0.00356033 0.85404927 0.82019206 0.71298946
LSL TRI10 0.417718487 0.002071672 0.874308872 0.657210052 0.681971994
LSL TRI7 0.417068507 0.001262531 0.87574877 0.648950843 0.673803828
LSL TRI5 0.416008121 0.002006917 0.869706286 0.658784335 0.683658641
LSL TRI6 0.41490654 0.001678815 0.866767983 0.661174595 0.686024185
LSL TRI8 0.40861261 0.001179271 0.854772399 0.649739272 0.672541022
MSR3D TRI7 0.40677296 0.004479209 0.882477468 0.520330064 0.510517317
MSR3D TRI1 0.399937853 0.001348086 0.870211819 0.516112583 0.507469069
MSR3D TRI2 0.397972383 0.001177971 0.866535835 0.511042941 0.504338338
MSR3D TRI4 0.397028323 0.0014405 0.863853884 0.512208068 0.503122322
MSR3D TRI6 0.392316477 0.00190466 0.850869722 0.513791033 0.506534134
MSR3D TRI3 0.391066411 0.001255371 0.849235889 0.508613518 0.506273874
MSR3D TRI9 0.390891083 0.001281294 0.848296937 0.510926324 0.507706903
MSR3D TRI10 0.390730352 0.001137925 0.8484396 0.50930819 0.506402803
MSR3D TRI5 0.388644055 0.001187588 0.842929885 0.511734835 0.505831309
MSR3D TRI8 0.3851186 0.001240227 0.834606686 0.508323861 0.504792392
OPT TRI7 0.37783613 0.00125442 0.81768005 0.50153608 0.50120198
OPT TRI5 0.37648925 0.00128696 0.81223451 0.51226675 0.50677264
OPT TRI8 0.37545313 0.00144891 0.80990327 0.50841987 0.50692736
OPT TRI6 0.37500834 0.00122195 0.80916885 0.50865504 0.50594149
OPT TRI10 0.37115418 0.00120689 0.80002563 0.50727999 0.50352975
Table 14GDS4510 summary table
EXPERIMENT BEST SOLUTION BEST TRIQ MEAN STDEV
MSR3D TRI7 0.40677296 0.39404785 0.006348192
LSL TRI1 0.435171938 0.42136338 0.007979308
MSL TRI1 0.446289279 0.430725347 0.006987671
MSR3D LSL MSL OPT 0.010 0.015 0.020 0.025 0.030 3 4 . 0 2 4 . 0 1 4 . 0 0 4 . 0 MEAN STDEV
GDS4510 experiment: TRIQ summary
Fig. 9MEANvsSTDEVdispersion graph for each GDS4510 experiment
Our input datasetDGSD44723D is composed of 54675 genes, 4 conditions (one for each individual involved) and 6 time points (one per hour) and has been used as the input of the
TriGenand theOPTtriclusteralgorithm in four experiments:MSR3D,LSL,MSLand,OPT.
GDS4472 MSR3Dexperiment
For this experiment,TRI4has the best value ofBIOQ,TRI6has the best value ofPEQ, TRI3has the best value ofSPQandTRI5has the best value ofGRQas you can see Table16.
Conditions for each Time
genes e xpression le v els 2 3 4 5 6
Lgals12 Svs3b Gpr182 day 2 2 3 4 5 6 day 4 2 3 4 5 6 day 6 2 3 4 5 6 day 8
Times for each Condition
genes e xpression le v els 2 3 4 5 6
Lgals12 Svs3b Gpr182 WTREP2 2 3 4 5 6 RD1REP2 2 3 4 5 6 RD1REP3
Genes for each Condition
times e xpression le v els 2 3 4 5 6
day 2 day 4 day 6 day 8 WTREP2 2 3 4 5 6 RD1REP2 2 3 4 5 6 RD1REP3
Table 15TRI1GO table of theMSLGDS4510 experiment
TERM ID TERM P-VALUE
GO:0007606 Sensory perception of chemical stimulus 1.68E-25
GO:0004984 Olfactory receptor activity 6.56E-19
GO:0050911 Detection of chemical stimulus involved in sensory perception of smell 6.56E-19 GO:0050907 Detection of chemical stimulus involved in sensory perception 2.97E-18
GO:0004930 G-protein coupled receptor activity 4.68E-17
GO:0007186 G-protein coupled receptor signaling pathway 4.68E-17
GO:0007608 Sensory perception of smell 6.93E-16
GO:0009593 Detection of chemical stimulus 1.16E-15
GO:0007600 Sensory perception 5.28E-15
GO:0050906 Detection of stimulus involved in sensory perception 8.32E-14
GO:0004872 Receptor activity 9.34E-14
GO:0060089 Molecular transducer activity 6.27E-13
GO:0004888 Transmembrane signaling receptor activity 8.08E-13
GO:0050877 Nervous system process 1.07E-12
GO:0099600 Transmembrane receptor activity 2.01E-12
GO:0038023 Signaling receptor activity 1.43E-11
GO:0004871 Signal transducer activity 2.69E-11
GO:0051606 Detection of stimulus 1.64E-10
GO:0003008 System process 1.09E-09
GO:0005549 Odorant binding 1.85E-08
ThePEQandSPQvalues of the solutions oscillate around 0.64 and theGRQvalues vary
between 0.76 and 0.64; theBIOQindex oscillates around 0.0014 reaching two peaks at
TRI4andTRI8. In general, theTRIQvalue of solutions are in [ 0.32, 0.37] havingTRI3and TRI7as outstanding ones andTRI5as the best solution in this experiment.
GDS4472 LSL experiment
We can verify in Table17howTRI1has the best values ofBIOQ,GRQ,PEQandSPQ.
In general, theGRQ,PEQandSPQindexes of the solutions depicts homogeneous values
with the exception ofTRI1where they reach their maximum; regardingBIOQvalues,
those reach three peaks atTRI1,TRI4andTRI10. TheTRIQvalues vary between 0.39 and
0.44 beingTRI1the best solution of this experiment.
GDS4472 MSL experiment
In Table18we can see howTRI9has the best values ofBIOQandGRQwhileTRI7has the
best value ofPEQandTRI10has the best value ofSPQ. ThePEQvalues of the solutions
Table 16MSR3DGDS4472 solution table
SOLUTION TRIQ BIOQ GRQ PEQ SPQ
TRI1 0.339109333 0.001444791 0.696219908 0.596698979 0.601280513
TRI2 0.321761941 0.001591523 0.645157719 0.633303534 0.624758294
TRI3 0.363970471 0.001440455 0.742093089 0.650828401 0.677431755
TRI4 0.343765956 0.001732664 0.69802844 0.623399523 0.650365438
TRI5 0.370128492 0.001337649 0.761586904 0.637388072 0.659110049
TRI6 0.360725206 0.001406179 0.730735981 0.688724917 0.665829566
TRI7 0.366252916 0.001263468 0.750692098 0.655100071 0.651786783
TRI8 0.351001074 0.00159526 0.709109493 0.674238924 0.656954002
TRI9 0.327754495 0.001401494 0.664697595 0.606214508 0.617279679
Table 17LSLGDS4472 solution table
SOLUTION TRIQ BIOQ GRQ PEQ SPQ
TRI1 0.447346181 0.027287612 0.923852614 0.69377633 0.589450252
TRI2 0.392576223 0.004031468 0.862302229 0.468881448 0.443910489
TRI3 0.409737004 0.002294049 0.886097803 0.570674741 0.512342415
TRI4 0.421749212 0.00967779 0.895313993 0.60768017 0.568014215
TRI5 0.402016193 0.002568856 0.869691073 0.55912722 0.497979503
TRI6 0.394065329 0.00467901 0.864596579 0.474398477 0.443345363
TRI7 0.39497655 0.005644179 0.865341762 0.477395239 0.442959875
TRI8 0.397055929 0.005748916 0.868777413 0.482543181 0.450866935
TRI9 0.40510461 0.007434596 0.881069048 0.514114336 0.465079524
TRI10 0.411954946 0.019662416 0.89416486 0.458207225 0.430948663
vary in the [ 0.43, 0.46] interval and theSEQvalues are in the [ 0.40, 0.44] interval while all solutions have highGRQvalues close to 0.90; theBIOQvalues have three peaks atTRI5, TRI7andTRI9. RegardingTRIQvalues, they vary in [ 0.40, 0.42] interval beingTRI1,TRI5
andTRI7the outstanding solutions and beingTRI9the best solution.
GDS4472 OPT experiment
For this experiment,TRI5has the best value ofBIOQ,TRI10has the best value ofGRQand SPQand,TRI8has the best value ofPEQas you can see Table19. TheBIOQindex
oscil-lates around 0.0015 reaching three peaks atTRI5,TRI9and,TRI10. TheGRQindex vary
in the [ 0.6, 07] interval reaching an outstanding value in theTRI10 solution. Regarding
thePEQvalues they vary in a interval of [ 0.42, 0.86] and theSPQvalues in the [ 0.34, 0.76] interval. TheTRIQvalues vary between 0.28 and 0.44 beingTRI10the best solution of
this experiment.
GDS4472 summary
We can observe in Fig. 11 how the solutions of the four experiments are in aBIOQ
interval of [ 0.0012, 0.0272] meanwhile the GRQ values of the solutions of MSR3D are
in the [ 0.6451, 0.7615] interval, the solutions ofLSLare in the [ 0.8623, 0.8953] inter-val, the solutions ofMSLare in the [ 0.8964, 0.9238] interval and, the solutions of OPT
are in the [ 0.6, 0.7] interval with an outstanding point near toGRQ = 0.92. Regarding
the PEQ andSPQsolutions distribution we can see in Fig. 12how thePEQ andSPQ
ofMSR3Dare concentrated in the [ 0.50, 0.75] interval, the valuesPEQandSPQofLSL
are in the [ 0.325, 0.75] interval, the valuesPEQandSPQofMSLare in the [ 0.325, 0.50]
Table 18MSLGDS4472 solution table
SOLUTION TRIQ BIOQ GRQ PEQ SPQ
TRI1 0.413005918 0.008623332 0.909739803 0.463874665 0.432091958
TRI2 0.406682712 0.005351847 0.901242812 0.449739986 0.420453301
TRI3 0.404078935 0.004069221 0.896447319 0.445616204 0.423691724
TRI4 0.409123273 0.004869646 0.9053715 0.456215467 0.43458153
TRI5 0.410786658 0.011209144 0.903088937 0.453954127 0.424976095
TRI6 0.404207143 0.004999521 0.896798986 0.44398627 0.415769491
TRI7 0.411937377 0.012628523 0.901459314 0.468134175 0.432653616
TRI8 0.405644251 0.0030952 0.902252364 0.445061054 0.418853066
TRI9 0.42006885 0.025664213 0.912118818 0.439476488 0.408307841
Table 19OPTGDS4472 solution table
SOLUTION TRIQ BIOQ GRQ PEQ SPQ
TRI1 0.361091084 0.001165855 0.728642443 0.841096481 0.539927104
TRI2 0.302530473 0.001445096 0.649190316 0.42227834 0.420357627
TRI3 0.298417139 0.001567996 0.639083858 0.421848063 0.418143898
TRI4 0.290997577 0.0013925 0.620125263 0.423388521 0.421635907
TRI5 0.353327655 0.00233497 0.7175687 0.832938328 0.469715461
TRI6 0.298612766 0.001430159 0.640127397 0.421427176 0.415507376
TRI7 0.282392223 0.0018726 0.610369316 0.397933947 0.348229987
TRI8 0.35196608 0.00159536 0.707996999 0.865220464 0.49417155
TRI9 0.328919371 0.001916523 0.649746035 0.838138155 0.523115758
TRI10 0.446233789 0.002289266 0.924944835 0.740548556 0.761675883
interval and, the valuesPEQandSPQofOPT are dispersed in three groups: the first in the [ 0.42, 0.45] interval forPEQandSPQ, the second in the [ 0.70, 0.85] interval forPEQ
and the [ 0.46, 0.54] interval forSPQand the third, that is a single point, inPEQ =0.74,
SPQ=0.76.
We can see the globalTRIQ-based ranking of solutions in Table20; theMSLsolutions, oneOPTsolution and, theLSLsolutions are placed alternatively on the first positions and theMSR3Dand the remaining ofOPTsolutions are on the last positions.
We can see in Table21how the MSLexperiment has the best value of the average
and standard deviation of TRIQ, however, the LSLexperiment has the best tricluster
closely followed by theOPTexperiment. In Fig.13we can see how theMSLis placed in the bottom-right position being the best experiment in terms of standard deviation and average.
The most valuable solution of all experiments is the tricluster TRI1 of the LSL
experiment. This solution depicts very uniform patterns since has a very highGRQvalue, we can check this fact in Fig.14. Also, we can see in Table22that this solution has Gene
Ontology terms with very low p-value such as SRP-dependent cotranslational protein
targeting to membrane,nuclear-transcribed mRNA catabolic process, nonsense-mediated
decayorribonucleoprotein complex.
MSR3D LSL MSL OPT
0.00 0.01 0.02 0.00 0.01 0.02 0.00 0.01 0.02 0.00 0.01 0.02
0.6 0.7 0.8 0.9
BIOQ
GRQ
GDS4472 experiment: BIOQ v GRQ
MSR3D LSL MSL OPT
0.4 0.5 0.6 0.7 0.8 0.4 0.5 0.6 0.7 0.8 0.4 0.5 0.6 0.7 0.8 0.4 0.5 0.6 0.7 0.8 0.4
0.5 0.6 0.7
PEQ
SPQ
GDS4472 experiment: PEQ v SPQ
Fig. 12 PEQvsSPQdispersion graph for each GDS4472 solution of each experiment
TheSRP-dependent cotranslational protein targeting to membraneprocess is described
as the targeting of proteins to a membrane that occurs during translation and is depen-dent upon two key components, the signal-recognition particle (SRP) and the SRP receptor. SRP is a cytosolic particle that transiently binds to the endoplasmic reticu-lum (ER) signal sequence in a nascent protein, to the large ribosomal unit, and to the SRP receptor in the ER membrane; it is a protein targeting process that occurs in the intracellular component and is part of the cellular protein localization process. The
nuclear-transcribed mRNA catabolic process, nonsense-mediated decay is a biological
process that describes the nonsense-mediated decay pathway for nuclear-transcribed mRNAs degrades mRNAs in which an amino-acid codon has changed to a nonsense codon; this prevents the translation of such mRNAs into truncated, and potentially harm-ful, proteins; it is a negative regulation of gene expression process that negatively regulates the macromolecule metabolic process. Finally theribonucleoprotein complexis a cellu-lar component that is defined as a macromolecucellu-lar complex containing both protein and RNA molecules.
Conclusions and discussion
Although triclustering has emerged as an essential task to study 3D datasets, there is no consensus on how to evaluate tricluster solutions obtained from each data set. Different authors validate their triclusters on different measures, with correla-tion, graphic validation and Gene Ontology terms being the most common ones. In
this work we have presented a tricluster validation measure, TRIQ, a single
evalua-tion measure that combines the informaevalua-tion from the three aforemenevalua-tioned sources of validation.
We have appliedTRIQto three different datasets: the yeast cell cycle (Saccharomyces
Cerevisiae), in particular the elutriation experiment, an experiment with mice (Mus
Mus-culus) called GDS4510 and data from an experiments with humans (Homo Sapiens) called
GDS4472.
Table 20GDS4472 ranking table
EXPERIMENT SOLUTION TRIQ BIOQ GRQ PEQ SPQ
LSL TRI1 0.447346181 0.027287612 0.923852614 0.69377633 0.589450252
OPT TRI10 0.446233789 0.002289266 0.924944835 0.740548556 0.761675883
LSL TRI4 0.421749212 0.00967779 0.895313993 0.60768017 0.568014215
MSL TRI9 0.42006885 0.025664213 0.912118818 0.439476488 0.408307841
MSL TRI1 0.413005918 0.008623332 0.909739803 0.463874665 0.432091958
LSL TRI10 0.411954946 0.019662416 0.89416486 0.458207225 0.430948663
MSL TRI7 0.411937377 0.012628523 0.901459314 0.468134175 0.432653616
MSL TRI5 0.410786658 0.011209144 0.903088937 0.453954127 0.424976095
MSL TRI10 0.41078403 0.006450477 0.90556104 0.465916366 0.440771152
LSL TRI3 0.409737004 0.002294049 0.886097803 0.570674741 0.512342415
MSL TRI4 0.409123273 0.004869646 0.9053715 0.456215467 0.43458153
MSL TRI2 0.406682712 0.005351847 0.901242812 0.449739986 0.420453301
MSL TRI8 0.405644251 0.0030952 0.902252364 0.445061054 0.418853066
LSL TRI9 0.40510461 0.007434596 0.881069048 0.514114336 0.465079524
MSL TRI6 0.404207143 0.004999521 0.896798986 0.44398627 0.415769491
MSL TRI3 0.404078935 0.004069221 0.896447319 0.445616204 0.423691724
LSL TRI5 0.402016193 0.002568856 0.869691073 0.55912722 0.497979503
LSL TRI8 0.397055929 0.005748916 0.868777413 0.482543181 0.450866935
LSL TRI7 0.39497655 0.005644179 0.865341762 0.477395239 0.442959875
LSL TRI6 0.394065329 0.00467901 0.864596579 0.474398477 0.443345363
LSL TRI2 0.392576223 0.004031468 0.862302229 0.468881448 0.443910489
MSR3D TRI5 0.370128492 0.001337649 0.761586904 0.637388072 0.659110049
MSR3D TRI7 0.366252916 0.001263468 0.750692098 0.655100071 0.651786783
MSR3D TRI3 0.363970471 0.001440455 0.742093089 0.650828401 0.677431755
OPT TRI1 0.361091084 0.001165855 0.728642443 0.841096481 0.539927104
MSR3D TRI10 0.360821995 0.001434449 0.743345617 0.631027541 0.624302919
MSR3D TRI6 0.360725206 0.001406179 0.730735981 0.688724917 0.665829566
OPT TRI5 0.353327655 0.00233497 0.7175687 0.832938328 0.469715461
OPT TRI8 0.35196608 0.00159536 0.707996999 0.865220464 0.49417155
MSR3D TRI8 0.351001074 0.00159526 0.709109493 0.674238924 0.656954002
MSR3D TRI4 0.343765956 0.001732664 0.69802844 0.623399523 0.650365438
MSR3D TRI1 0.339109333 0.001444791 0.696219908 0.596698979 0.601280513
OPT TRI9 0.328919371 0.001916523 0.649746035 0.838138155 0.523115758
MSR3D TRI9 0.327754495 0.001401494 0.664697595 0.606214508 0.617279679
MSR3D TRI2 0.321761941 0.001591523 0.645157719 0.633303534 0.624758294
OPT TRI2 0.302530473 0.001445096 0.649190316 0.42227834 0.420357627
OPT TRI6 0.298612766 0.001430159 0.640127397 0.421427176 0.415507376
OPT TRI3 0.298417139 0.001567996 0.639083858 0.421848063 0.418143898
OPT TRI4 0.290997577 0.0013925 0.620125263 0.423388521 0.421635907
OPT TRI7 0.282392223 0.0018726 0.610369316 0.397933947 0.348229987
Table 21GDS4472 summary table
EXPERIMENT BEST SOLUTION BEST TRIQ MEAN STDEV
MSR3D TRI5 0.370128492 0.350529188 0.016814529
LSL TRI1 0.447346181 0.407658218 0.016734175
MSL TRI9 0.42006885 0.409631915 0.004869533