M E T H O D O L O G Y
Open Access
LAF: Logic Alignment Free and its
application to bacterial genomes classification
Emanuel Weitschek
1,3*, Fabio Cunial
2and Giovanni Felici
3*Correspondence: [email protected] 1Department of Engineering, Uninettuno International University, Corso Vittorio Emanuele II, 39, 00186 Rome, Italy
3Institute of Systems Analysis and Computer Science “A. Ruberti”, National Research Council, Via dei Taurini 19, 00185 Rome, Italy Full list of author information is available at the end of the article
Abstract
Alignment-free algorithms can be used to estimate the similarity of biological sequences and hence are often applied to the phylogenetic reconstruction of genomes. Most of these algorithms rely on comparing the frequency of all the distinct substrings of fixed length (k-mers) that occur in the analyzed sequences.
In this paper, we present Logic Alignment Free (LAF), a method that combines alignment-free techniques and rule-based classification algorithms in order to assign biological samples to their taxa. This method searches for a minimal subset ofk-mers whose relative frequencies are used to build classification models as
disjunctive-normal-form logic formulas (if-then rules).
We apply LAF successfully to the classification of bacterial genomes to their
corresponding taxonomy. In particular, we succeed in obtaining reliable classification at different taxonomic levels by extracting a handful of rules, each one based on the frequency of just fewk-mers.
State of the art methods to adjust the frequency ofk-mers to the character distribution of the underlying genomes have negligible impact on classification performance, suggesting that the signal of each class is strong and that LAF is effective in identifying it.
Keywords: Supervised classification, Alignment-free sequence comparison, Bacterial taxonomy
Background
The field of biological sequence analysis relies on mathematical, statistical, and computer science methods for discovering similarities among different organisms, understanding their features and their structure, detecting ancestry, relatedness, evolution, and common functions.
Several well-established sequence comparison algorithms are based on sequence align-ment: they compute sequence similarity by aligning portions of sequences (e.g., subse-quences) that have common nucleotide assignments. The alignments of two or more sequences are scored according to the number of common nucleotides. Such methods can be exact or heuristic. Among exact methods, Smith-Waterman [1] and Needleman-Wunsch [2] use dynamic programming techniques. The first performs local sequence alignment: it detects the common regions between two sequences by comparing segments of all possible lengths. The second is a global alignment algorithm, designed to align entire sequences. In order to reduce the computational burden of exact methods, several heuris-tic algorithms have been designed, the most renowned being FASTA [3] and BLAST [4].
For the comparisons of more than two sequences, there are ad-hoc algorithms like Mus-cle [5], ClustalW [6], Motalign [7], and Mafft [8]. Alignment-based sequence analysis algorithms have a very high computational cost, especially when applied to a large set of sequences [9]. Other problems may also be encountered when performing alignment on genome sequences, related with the presence of non-coding subsequences, or simply with the computational burden associated with the alignment of whole genomes [10].
In order to address these issues, alignment-free sequence analysis methods can be considered. Such algorithms are mainly classified in two groups: methods based on sequence compression and methods that rely on the frequencies of the subsequences (oligomers) [9].
The first class of methods compute a model that succinctly describes the sequence, and assess the similarity of the sequences by analyzing their compressed representations, e.g., Kolomogorov complexity [11] or Universal Sequence Maps [12].
In this work we focus on the second class of methods, alignment-free algorithms that rely on oligomer frequencies and map two stringsXandY onto corresponding multi-dimensional vectors XandY; these vectors are indexed by a number of substrings in the given alphabet (a typical case is when all possible substrings of a predefined length kare used).X[W] andY[W] – the element ofXandYassociated with substringW – contain the number of occurrences ofW inXandY respectively. Often the number of occurrences is normalized and converted into a measure of statistical surprise using the length and distribution of characters in each string. Standard distance functions on vec-tors are then applied toXandY, allowing the original strings to be compared by classical distance-based algorithms.
Alignment-free algorithms are currently the most scalable class of methods for recon-structing phylogenetic trees from thousands of large, distantly-related genomes and proteomes [13, 14].
The success of alignment-free methods rests on extensive information on the substring composition of genomes and on codon-usage biases, cumulated over approximately fifty years, with particular emphasis on prokaryotes: from the first studies ofGCcontent [15], to the first detection of biases in the composition of pairs and quadruples of adjacent nucleotides [15–21], to the discovery of species-specific frequencies of 4-mers and 8-mers preserved inDNA fragments ranging from 40 kilobases to 400 bases [22–26], to more recent, unsupervised classifications [27–29] and more complex protein motifs [30].
Since the very beginning, most such studies have relied on some form of noise filtration, either assuming an independent and identically distributed source or a Markov source of low order (i.e., normalizing the raw frequencies using their expectation and or variance according to the specified sources). Markov chains inferred from genomes have indeed been shown to reproduce large fractions of the frequency distribution ofk-mers in the original genomes [23, 31, 32].
distribution and concentration of phylogenetic signal in the space of allk-mers are still open and scarcely investigated. Among the few attempts in this direction, we mention the use of singular value decomposition (SVD[41, 42]) and of irredundant shared substrings [43] in phylogeny reconstruction, the use of few selectedk-mers in barcoding genes [44], and early attempts at classifying protein families using the frequency of a small set of dipeptides [45].
In this work, we search fora minimal set of k-mers whose frequency is sufficient to clas-sify entire genomes. Specifically, we focus onlogic formulas(if-then rules) whose attributes W arek-mers, and whose valuesfX(W)are relative frequencies in a genomeX, possibly corrected by expected counts. An example of such a formula could be:
if(f(ACGT) >0.15)∧(f(GGCT) <0.6)thenX∈T
whereT is a taxonomic unit (for example,E. coli) at a given taxonomic rank (for example, at the species level). Similar to recentDNAbarcoding efforts, such formulas approximate a unique signature of setT, but they work on entire genomes rather than on few specific genes, and they do not requireT to be at the species level [44, 46]. Contrary tomarkers [47–49], the k-mers in such formulas need not to be genes, they need not to be rare in the genomes they characterize, they need not to be absent from the genomes they do not characterize. Contrary todiscriminating substrings (see e.g. [50] and references therein), formulas can use multiple substrings to classify, and they can link frequencies with conjunctions and disjunctions.
In this paper, we experiment with four rule-based algorithms [51] that extract clas-sification models in the form of logic formulas and we compare them with other state-of-the-art classifiers, such as Support Vector Machines [58, 69] and Nearest Neigh-bor [70]. Surprisingly, it turns out that we can reliably classify genomes at multiple taxonomic levels using a limited number of formulas, each involving few, shortk-mers. Moreover, standard noise filtration methods have minimum impact on classification per-formance, suggesting that noise is automatically dampened by the formula-extraction algorithms.
Methods
In this section, we present theLogic Alignment Free(LAF) technique and software pack-age. The aim of LAF is to classify biological sequences and assign them to their taxonomic unit with the aid of a supervised machine learning paradigm [51] (see subsection Super-vised machine learning and rule-based classification algorithmsfor more details). LAF uses a feature vector representation of the biological sequences, and gives them as input to rule-based classification algorithms (for a detailed analysis of rule-based classification methods, see [52]).
In [53], LAF has been already successfully applied to the classification of selectively constrainedDNAelements, which are not alignable and do not come from the same gene regions.
Representing the sequences as feature vectors with alignment-free methods
The most widespread alignment-free methods compute the frequencies of the substrings in the biological sequences, calledk-mers (wherekis the length of the substring). For each sequence, the substring frequencies are then represented in a vector, called frequency vector [12, 54–57]. Each element of this vector expresses the frequency of a givenk-mer, computed by scanning a sliding window of lengthkover the sequence.
More formally [9], letSbe a sequence of ncharacters over an alphabet, e.g. = {A,C,G,T}, and let k ∈[1. . .n]. If K is a generic substring of S of length k, K is called a k-mer. Let the set V = {K1,K2,. . .,Km} be all possible k-mers over , and define m = ||k to be the size of setV. The k-mers are computed by counting the occurrences of the substrings inSwith a sliding window of lengthkoverS, starting at position 1 and ending at positionn−k +1. A vector F contains for each k-mer the corresponding counts F = c1,c2,. . .,cm. The frequencies are then computed accord-ingly and stored in a vectorF = f1,f2,. . .,fm; for ak-merKi, the frequency is defined asfi= n−cki+1.
These numerical representations of the sequences allow the use of statistical and mathematical techniques; indeed, the most used approach for sequence comparisons in alignment-free vector representations are distance measures, such as the Euclidean dis-tance and thed2 distance [9]. While the authors of [56] use feature vector representation in combination with supervised machine learning methods, specifically Support Vector Machines [69] for biological and text sequences, here we propose to analyze the frequency vectors with rule-based supervised machine learning algorithms. The effectiveness of this technique is investigated and tested on bacterial sequences.
Supervised machine learning and rule-based classification algorithms
The aim of this step is to classify the biological sequences into their taxonomic unit. Once the sequences are represented in a vector space, it is possible to analyze them by adopting a supervised machine learning approach, sketched in the following.
Given a setBof biological sequences, each assigned to a taxon (training set), a classifier is trained with these sequences in order to compute a classification model that predicts the taxon of each sequence from the values of its vector space representation. An addi-tional set of sequences with known taxa is used to evaluate whether the model computed on the training set is able to predict correctly the taxa (the latter is calledtest set). For assessing the performance of the classifier we adopt the accuracy measure (A), also called correct rateA= ct, wherecis the number of correct classified sequences in the test set andtis the number of total sequences in the test set.
Data Mining Big (DMB) [60, 64, 65] is a rule-based classification software designed for biomedical data. It adopts optimization models that are formulated and solved in order to deal with the different steps of the data mining process. Five main steps are performed by DMB:
1. discretization: conversion of numeric attributes into nominal (discrete); 2. discrete cluster analysis: samples that are similar in the discretized space are
clustered and dimension-reduced accordingly;
3. feature selection: the most relevant attributes for classification purpose are selected; 4. rule extraction: small and effective rules are extracted from training data and
verified on test data;
5. classification: the extracted rules are used to classify new samples.
RIDOR [61] performs rule extraction directly from the training data set. The first step is the computation of a default rule for the most frequent class (e.g., “all sequences are E. coli”). Then, it computes exception rules that represent the other classes (e.g., “except if freq(ACGT) <0.45 then the sequences are S. aureus”).
PART [62] performs rules extraction with an indirect method. It uses the C4.5 decision tree based classification algorithm [66], which computes a pruned decision tree for a given number of iterations. The best performing tree in terms of classification performances is chosen by PART and converted to rules for every species.
RIPPER [63] is a direct rule extraction method based on a pruning procedure, whose aim is to minimize the error on the training set; it performs the following steps: i) growth of the rules; ii) pruning of the rules; iii) optimization of the model; iv) selection of the model. In the first step, thanks to a greedy procedure, RIPPER extracts many classification rules. Then, the rules are simplified and optimized in step two and three, respectively. Finally, the best model (i.e., set of rules) is selected.
Logic Alignment Free (LAF) method
Rule-based classifiers have been successfully used in the analysis of aligned sequences, e.g., in [59] and [60], where the classification of biological sequences to their species is performed by considering only sequences from the same gene region. In this case the rule-extraction procedure identifies exact gene regions and nucleotide assignments that are specific to a species; an example of such a rule could be ‘’if pos354 = T of gene 16S then the sequence belongs to E. Coli”.
• The genomeg is reverse complemented, the k -mers withk∈[3. . .6]are counted and stored in a frequency vectorF;
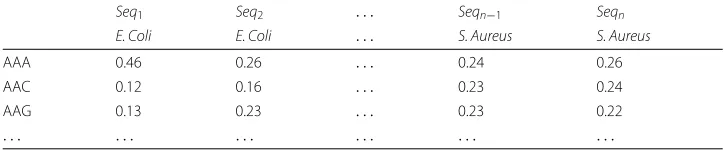
• A matrix that contains all frequency vectors is created; the rows of the matrix are associated to thek -mers and the columns to the sequences (an example is given in Table 1);
• The frequencies are discretized with the MDL procedure [67] before applying RIDOR, PART and RIPPER, while DMB provides its own built-in discretization method;
• A set of four rule-based classifiers (e.g., DMB, RIDOR, PART and RIPPER) take the matrix as input and extract the classification models and specimen to taxonomic unit assignments;
• The above is repeated for different combinations of training/test sets.
For a compact overview of the method the reader may refer to the LAF flow chart drawn in Fig. 1. To computek-mer counts, we adopt the Jellyfish software [68]. Data dis-cretization is performed using MDL [67] or the DMB internal procedure. As rule-based classifiers implementations we employ the Weka [67] and the DMB packages. The LAF method is deployed in a software package available at dmb.iasi.cnr.it/laf.php.
Data sets of bacterial genomes
In order to prove the validity of the LAF technique, we chose to test the method for the classification of biological sequences belonging to the bactria domain. We down-loaded 1964 bacterial genomes from the NCBI genomes database (www.ncbi.nlm.nih. gov/genome/browse/). For every downloaded sequence, we query the NCBI taxonomy service (scripts are available at dmb.iasi.cnr.it/laf.php) to retrieve the full lineage, i.e., Species, Genus, Order, Class, Phylum. In order to perform an effective classification, we do not take into consideration under-represented species and therefore we filter out sequences with less than nine specimens. This step is necessary to perform a proper train-ing of the classifiers. The finalfiltered data set is composed of 413 sequences with 25 species, 21 genera, 14 orders, 9 classes, and 6 phyla. Additionally, we also report the per-formances on theoriginal data set(1964 bacterial genomes, 1157 species, 590 genera, 120 orders, 57 classes, and 36 phyla).
Results and discussion
We apply LAF to the previously describedfiltered data setof bacterial genomes, setting k∈[3. . .6] and using the four already mentioned rule-based classification algorithms by adopting a 10-fold cross validation sampling scheme. We show also the results on the original data setcomposed of 1964 sequences. Additionally, we compare the results of
Table 1Example of frequencies vectors matrix extracted by LAF and provided as input to rule-based classifiers
Seq1 Seq2 . . . Seqn−1 Seqn
E. Coli E. Coli . . . S. Aureus S. Aureus
AAA 0.46 0.26 . . . 0.24 0.26
AAC 0.12 0.16 . . . 0.23 0.24
AAG 0.13 0.23 . . . 0.23 0.22
Fig. 1Flow chart of the LAF method
LAF with respect to the Support Vector Machine (SVM) classifier [69] and with respect to a Nearest Neighbor approach [70].
First, we test LAF on the filtered raw sequences without any preprocessing, obtain-ing very good classification performance. The accuracy of the classification algorithms fork = 4 and multiple taxonomic levels is summarized in Table 2. We focus onk = 4 here since it is the smallest value to achieve good classification performances: increasing kslightly improves classification performances, but also complexity and computational time. We justify the choice ofk=4 providing experimental evidence in Table 3 by focus-ing on the order level since similar performance is obtained at other levels. We can see that the classification accuracy only slightly increases by raising the value ofk, but com-plexity and computational time significantly do. We provide also an example in Fig. 2 that shows the accuracy and computational time of RIPPER with respect to increasing values ofk. Thek-mers extraction is linear in the size of the input, but it is worth noting that for greater values ofkthe required IO bandwidth and the size of the data matrices exponen-tially increase [68], slowing down thek-mers extraction and the classification processes. Additionally, the value ofk=4 resonates with a number of previous studies [71–73].
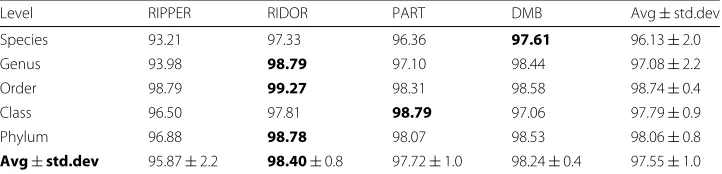
In Table 2, we report the average accuracy over all classification algorithms on the fil-tered data set. We note that the best results (98 % accuracy) are obtained for the phylum level – the highest in the taxonomy. Accuracy remains greater than 96 % at lower lev-els as well. According to the average over all taxonomic levlev-els, RIDOR exhibits the best performance.
Moreover, we compare LAF with respect to the Support Vector Machine (SVM) clas-sifier. We adopt the Weka implementation of SVM (called SMO) with a linear kernel and a soft margin. We obtain an accuracy of 99 % on the filtered data sets with a 10-fold cross validation sampling scheme, which slightly outperforms LAF. But we remark that
Table 2Percent accuracy of the rule-based classifiers for each taxonomic unit (10-fold cross validation) on the filtered data set
Level RIPPER RIDOR PART DMB Avg±std.dev
Species 93.21 97.33 96.36 97.61 96.13±2.0
Genus 93.98 98.79 97.10 98.44 97.08±2.2
Order 98.79 99.27 98.31 98.58 98.74±0.4
Class 96.50 97.81 98.79 97.06 97.79±0.9
Phylum 96.88 98.78 98.07 98.53 98.06±0.8
Avg±std.dev 95.87±2.2 98.40±0.8 97.72±1.0 98.24±0.4 97.55±1.0
Table 3Accuracy (ACC) [%] and computational times (T) [sec] on the order level with different values ofK
Data set Classifier K=3 K=4 K=5 K=6
ACC T ACC T [s] ACC T ACC T
Original RIPPER 64.50 37.08 69.82 83.53 69.76 203.53 69.92 765.34 Original RIDOR 61.63 71.17 62.25 320.72 64.19 1509.75 64.75 10320.40 Original PART 65.37 12.67 67.05 24.58 67.77 70.13 70.02 280.23 Original SVM 70.69 605.55 85.37 937.32 88.59 1312.52 89.56 2020.60 Original NN 83.27 9.56 85.67 12.13 86.49 19.34 87.06 114.48 Filtered RIPPER 98.79 0.82 98.79 1.55 99.27 4.56 98.79 27.76 Filtered RIDOR 96.12 1.58 99.27 3.05 96.36 26.16 97.33 34.31 Filtered PART 97.34 0.51 98.31 1.00 97.58 2.28 97.09 23.11 Filtered SVM 99.56 10.62 99.87 11.58 99.65 13.10 99.68 14.71 Filtered NN 99.45 1.99 99.93 3.30 99.34 3.70 99.63 4.18
Average - 83.67 75.2 86.63 139.88 86.90 316.51 87.38 1360.51
SVM outputs just a single classification model that cannot be easily interpreted by human experts.
Finally, we evaluate also the performances of theNearest Neighbour(NN) classifier by using the Weka implementation of NN (called IBk) and by setting the number of neigh-bours to 1, the NN search algorithm to linear, and by adopting the Euclidean distance. Also in this case we obtain an accuracy of 99 % on all filtered data sets with a 10-fold cross validation sampling scheme, but no human readable classification model.
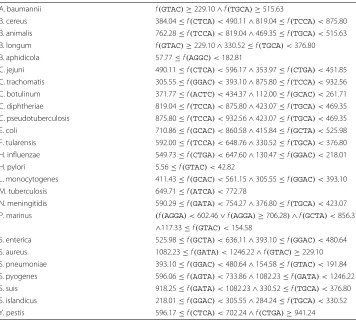
Conversely to NN and SVM, the rule-based classification methods adopted by LAF provide sets of similar rules than can be analyzed, compared, and evaluated by the user. Here we consider as a sample the rules at the species level extracted by DMB, reported in Table 4. A representative example of such family of rules is the one forHelicobacter
Table 4A sample of classification rules at the species level extracted by the DMB software.f(W)
represents the relative frequency of substringWin a genome, multiplied by 105for readability
A. baumannii f(GTAC)≥229.10∧f(TGCA)≥515.63
B. cereus 384.04≤f(CTCA) <490.11∧819.04≤f(TCCA) <875.80 B. animalis 762.28≤f(TCCA) <819.04∧469.35≤f(TGCA) <515.63 B. longum f(GTAC)≥229.10∧330.52≤f(TGCA) <376.80 B. aphidicola 57.77≤f(AGGC) <182.81
C. jejuni 490.11≤f(CTCA) <596.17∧353.97≤f(CTGA) <451.85 C. trachomatis 305.55≤f(GGAC) <393.10∧875.80≤f(TCCA) <932.56 C. botulinum 371.77≤f(ACTC) <434.37∧112.00≤f(GCAC) <261.71 C. diphtheriae 819.04≤f(TCCA) <875.80∧423.07≤f(TGCA) <469.35 C. pseudotuberculosis 875.80≤f(TCCA) <932.56∧423.07≤f(TGCA) <469.35 E. coli 710.86≤f(GCAC) <860.58∧415.84≤f(GCTA) <525.98 F. tularensis 592.00≤f(TCCA) <648.76∧330.52≤f(TGCA) <376.80 H. influenzae 549.73≤f(CTGA) <647.60∧130.47≤f(GGAC) <218.01 H. pylori 5.56≤f(GTAC) <42.82
L. monocytogenes 411.43≤f(GCAC) <561.15∧305.55≤f(GGAC) <393.10 M. tuberculosis 649.71≤f(ATCA) <772.78
N. meningitidis 590.29≤f(GATA) <754.27∧376.80≤f(TGCA) <423.07 P. marinus (f(AGGA) <602.46∨f(AGGA)≥706.28)∧f(GCTA) <856.37
∧117.33≤f(GTAC) <154.58
S. enterica 525.98≤f(GCTA) <636.11∧393.10≤f(GGAC) <480.64 S. aureus 1082.23≤f(GATA) <1246.22∧f(GTAC)≥229.10 S. pneumoniae 393.10≤f(GGAC) <480.64∧154.58≤f(GTAC) <191.84 S. pyogenes 596.06≤f(AGTA) <733.86∧1082.23≤f(GATA) <1246.22 S. suis 918.25≤f(GATA) <1082.23∧330.52≤f(TGCA) <376.80 S. islandicus 218.01≤f(GGAC) <305.55∧284.24≤f(TGCA) <330.52 Y. pestis 596.17≤f(CTCA) <702.24∧f(CTGA)≥941.24
pylori: ”if 5.56≤ f(GTAC) < 42.82 then the sample isHelicobacter pylori”. Heref(K)is the frequency of substringK(for readability, the frequency values are multiplied by 105). We observe that the same 4-mer is able to distinguish 3 and 2 bacterial species with different frequency values, respectively, and that twenty 4-mers suffice to separate all the 25 species. The classification rules are also very concise, since most of them are com-posed only by the conjuction of the conditions on two 4-mers (in the logic jargon, such rules are conjunctive clauses composed of two literals). In general, the rules computed for distinct species do not seem to use disjoint, species-specific sets ofk-mers, suggest-ing that discrimination critically depends on the frequency of ak-mer rather than on its simple presence or absence in a species. Additional considerations derive from the granu-larity of the adopted discretization. The method allows to specify up-front the number of intervals used to discretize the frequency values of eachk-mer, and then searches for an optimal discretization under this condition. From the experimental results we conclude that the number of intervals in which frequencies are discretized has minimal effects on classification quality, provided that at least 3 intervals are used (results not reported).
Table 5Percent accuracy of the classifiers for each taxonomic unit (10-fold cross validation) on the original data set
Level RIPPER RIDOR PART DMB SVM NN Avg±std.dev
Species - - -
-Genus 54.17 47.67 50.17 48.54 - 73.04 45.60±24.2
Order 69.82 62.25 67.05 63.78 85.37 85.68 72.32±10.5 Class 75.08 69.92 71.76 72.05 88.43 89.10 77.72±8.7 Phylum 75.85 70.99 56.77 71.45 85.93 86.08 74.51±8.2
Avg±std.dev 68.73±10.0 62.71±10.7 61.44±9.7 63.96±11 64.93±43.3 83.48±7.1 67.54±14.8 The best performances are highlighted in bold for each taxon
(class and phylum) we obtain more reliable results. We highlight that SVM and NN per-form best, but they do not provide a human readable classification model as rule-based classifiers, which permit to identify the different taxon specifick-mers.
In order to test their effect on the classification performance, we applied different types of preprocessing to the filtered data set suggested in previous works [74–77] about phylogenetic reconstructions of genomes with alignment-free algorithms.
• The first type consists in excluding all high-frequency and low-complexity substrings [74] of a genome from itsk -mer counts, using the DUST software implementation provided by NCBI [78];
• A second type of preprocessing consists in replacing the frequencyfT(W)of ak -mer
W in a string T with a measure of the statistical significance of the event that W has
fT(W)occurrences inT. Specifically, we assigned to a k -mer W the score
zT(W)=
pT(W)− ˜pT(W)
/p˜T(W), wherepT(W)=fT(W)/(|T| −k+1), and
wherep˜T(W)=pT(W[1..k−1])·pT(W[2..k])/pT(W[2..k−1])is the expected
value ofpT(W)under the assumption thatT was generated by a Markov process of
orderk−2or smaller. This score has been shown to be critical in building accurate phylogenies of distantly-related prokaryotes [75];
• We experimented with the estimator
˜
pT(W)=
fT(W[1])·fT(W[2..k])+fT(W[1..k−1])·fT(W[k])
/2, derived under the assumption thatW[2..k−1],W[1]andW[k]occur independently inT [76];
• We also adopted an even simpler estimator, based on single-nucleotide frequencies (see [9, 77] and references therein for alternative ways to computep˜T(W)).
In our experiments, none of these preprocessing methods yielded a visible improve-ment on classification quality, suggesting that noise is automatically dampened by the formula-extraction algorithms run on raw frequencies. Nonetheless, we include in our LAF package an implementation of all such filters, since they could be useful in other data sets.
Conclusions and future work
We compared our method with other state-of-the art classification methods and pro-vided experimental results that show promising performance of LAF in particular in the classification model extraction (i.e., specifick-mers for each taxon).
Several directions for future research stem from the results obtained in this paper: fur-ther reducing the size of the classification models, analyzing more deeply the k-mers selected by our models; and measuring how classification performance degenerates when moving from whole genomes to short fragments.
Another possible way to further reduce the size of our models consists in building hier-archicalclassification rules by extracting logic formulas that best discriminate between elements in a taxonomic unitT and elements inparent(T)\T, whereparent(T)is the parent ofT in the taxonomic tree. Such result would look very similar to a decision tree, and the correspondingk-mers could be related to the notion ofcrowns(see [79]).
Analyzing the actualk-mers selected by our models is another obvious open direc-tion, for example in terms of syntactic similarity and positional correlations between the k-mers that appear in the same formula, or in terms of enrichment of such k-mers in regulatory regions or in gene families devoted to specific cellular processes.
It is also of interest the understanding of how the classification performance degener-ates when moving from whole genomes to short fragments, for example by determining how small a fragment we can classify correctly using the formulas learned from entire genomes, or using new formulas learned from fragments. Abundance estimation in metagenomic samples is also a natural application for the strong biases in the relative frequency ofk-mers that we report here: given a set of observedk-mer frequencies in a sample, and a set of logic rules in sequenced genomes, the problem would then amount to compute the most probable abundance of known species in the sample.
Competing interests
The authors declare that they have no competing interests.
Authors’ contributions
EW designed and implemented the method, planned and executed the experiments, and wrote the paper. FC inspired the research, contributed to the design of the method, suggested the statistical corrections, and wrote the paper. GF directed research, contributed to the design of the experiments, and wrote the paper. All authors read and approved the final manuscript.
Acknowledgements
The authors are grateful to the organizing committee of the 5th Biological Discovery Workshop (Biokdd 2014) for inviting them to write and publish the manuscript in Biodata Mining. The authors would like to thank Giulia Fiscon for the precious advices and for revising the paper and prof. Paola Bertolazzi for providing a stimulating research environment and fruitful scientific discussions. This paper is dedicated to prof. Alberto Apostolico. The authors have been supported by the Italian PRIN “GenData 2020” (2010RTFWBH), the FLAGSHIP “InterOmics” project (PB.P05), and by Academy of Finland under grant 250345 (Center of Excellence in Cancer Genetics Research).
Author details
1Department of Engineering, Uninettuno International University, Corso Vittorio Emanuele II, 39, 00186 Rome, Italy. 2Helsinki Institute for Information Technology HIIT, Department of Computer Science, University of Helsinki, P.O. Box 68
(Gustaf Hällströmin katu 2b), FI-00014 Helsinki, Finland.3Institute of Systems Analysis and Computer Science “A. Ruberti”,
National Research Council, Via dei Taurini 19, 00185 Rome, Italy.
Received: 30 March 2015 Accepted: 30 November 2015
References
1. Pearson WR. Searching protein sequence libraries: comparison of the sensitivity and selectivity of the smith-waterman and fasta algorithms. Genomics. 1991;11(3):635–50.
2. Needleman SB, Wunsch CD. A general method applicable to the search for similarities in the amino acid sequence of two proteins. J Mol Biol. 1970;48(3):443–53.
4. Altschul SF, Madden TL, Schaffer AA, Zhang J, Zhang Z, Miller W, et al. Gapped blast and psi-blast: a new generation of protein database search programs. Nucleic Acids Res. 1997;25(17):3389–402.
5. Edgar RC. Muscle: multiple sequence alignment with high accuracy and high throughput. Nucleic Acids Res. 2004;32(5):1792–7.
6. Thompson JD, Gibson T, Higgins DG. Multiple sequence alignment using clustalw and clustalx. Curr Protocol Bioinformatics. 2002;00:2.3:2.3.1–2.3.22.
7. Mokaddem A, Elloumi M. Motalign: A multiple sequence alignment algorithm based on a new distance and a new score function. In: DEXA Workshops. Los Alamitos, CA, USA: IEEE Computer Society; 2013. p. 81–4.
8. Katoh K, Misawa K, Kuma K-i, Miyata T. Mafft: a novel method for rapid multiple sequence alignment based on fast fourier transform. Nucleic Acids Res. 2002;30(14):3059–66.
9. Vinga S, Almeida J. Alignment-free sequence comparison-a review. Bioinformatics. 2003;19(4):513–23. 10. Delcher AL, Kasif S, Fleischmann RD, Peterson J, White O, Salzberg SL. Alignment of whole genomes. Nucleic
Acids Res. 1999;27(11):2369–76.
11. Li M, Vitnyi PMB. An Introduction to Kolmogorov Complexity and Its Applications, 3rd ed. New York, USA: Springer; 2008.
12. Almeida JS, Vinga S. Universal sequence map (usm) of arbitrary discrete sequences. BMC Bioinformatics. 2002;3:6. 13. Vinga S. Biological sequence analysis by vector-valued functions: revisiting alignment-free methodologies for DNA
and protein classification In: Pham TD, Yan H, Crane DI, editors. Advanced Computational Methods for Biocomputing and Bioimaging. New York: Nova Science Publishers; 2007.
14. Vinga S, Almeida J. Alignment-free sequence comparison – a review. Bioinformatics. 2003;19(4):513–23. 15. Bentley SD, Parkhill J. Comparative genomic structure of prokaryotes. Annu Rev Genet. 2004;38:771–91. 16. Josse J, Kaiser A, Kornberg A. Enzymatic synthesis of deoxyribonucleic acid. J Biol Chem. 1961;236:864–75. 17. Trautner T, Swartz M, Kornberg A. Enzymatic synthesis of deoxyribonucleic acid, x. influence of bromouracil
substitutions on replication. Proc Natl Acad Sci U S A. 1962;48(3):449.
18. Russell G, Walker P, Elton R, Subak-Sharpe J. Doublet frequency analysis of fractionated vertebrate nuclear DNA. J Mol Biol. 1976;108(1):1–20.
19. Russell G, Subak-Sharpe J. Similarity of the general designs of protochordates and invertebrates. Nature. 1977;266(5602):533–6.
20. Karlin S, Burge C. Dinucleotide relative abundance extremes: a genomic signature. Trends Genet. 1995;11(7):283–90. 21. Karlin S, Mrázek J. Compositional differences within and between eukaryotic genomes. Proc Natl Acad Sci.
1997;94(19):10227–32.
22. Teeling H, Meyerdierks A, Bauer M, Amann R, Glöckner FO. Application of tetranucleotide frequencies for the assignment of genomic fragments. Environ Microbiol. 2004;6(9):938–47.
23. Zhou F, Olman V, Xu Y. Barcodes for genomes and applications. BMC Bioinformatics. 2008;9(1):546. 24. Deschavanne PJ, Giron A, Vilain J, Fagot G, Fertil B. Genomic signature: characterization and classification of
species assessed by chaos game representation of sequences. Mol Biol Evol. 1999;16(10):1391–9.
25. Sandberg R, Winberg G, Bränden CI, Kaske A, Ernberg I, Cöster J. Capturing whole-genome characteristics in short sequences using a naive bayesian classifier. Genome Res. 2001;11(8):1404–9.
26. Pride DT, Meinersmann RJ, Wassenaar TM, Blaser MJ. Evolutionary implications of microbial genome tetranucleotide frequency biases. Genome Res. 2003;13(2):145–58.
27. Gatherer D. Genome signatures, self-organizing maps and higher order phylogenies: A parametric analysis. Evol Bioinformatics Online. 2007;3:211.
28. Takahashi M, Kryukov K, Saitou N. Estimation of bacterial species phylogeny through oligonucleotide frequency distances. Genomics. 2009;93(6):525–33.
29. Teeling H, Waldmann J, Lombardot T, Bauer M, Glockner FO. Tetra: a web-service and a stand-alone program for the analysis and comparison of tetranucleotide usage patterns in dna sequences. BMC Bioinformatics. 2004;5(1):163. 30. Rigoutsos I, Floratos A, Ouzounis C, Gao Y, Parida L. Dictionary building via unsupervised hierarchical motif
discovery in the sequence space of natural proteins. Proteins. 1999;37(2):264–77.
31. Chor B, Horn D, Goldman N, Levy Y, Massingham T. Genomic DNAk-mer spectra: models and modalities. Genome Biol. 2009;10(10):108.
32. O ˘gul H, Mumcuo ˘glu EÜ. Svm-based detection of distant protein structural relationships using pairwise probabilistic suffix trees. Comput Biol Chem. 2006;30(4):292–9.
33. Karlin S, Mrazek J, Campbell AM. Compositional biases of bacterial genomes and evolutionary implications. J Bacteriol. 1997;179(12):3899–913.
34. Foerstner KU, von Mering C, Hooper SD, Bork P. Environments shape the nucleotide composition of genomes. EMBO Rep. 2005;6(12):1208–13.
35. McHardy AC, Martín HG, Tsirigos A, Hugenholtz P, Rigoutsos I. Accurate phylogenetic classification of variable-length DNA fragments. Nat Methods. 2007;4(1):63–72.
36. Chatterji S, Yamazaki I, Bai Z, Eisen JA. Compostbin: A dna composition-based algorithm for binning environmental shotgun reads. In: Research in Computational Molecular Biology. Berlin: Springer; 2008. p. 17–28.
37. Leung HC, Yiu S, Yang B, Peng Y, Wang Y, Liu Z, et al. A robust and accurate binning algorithm for metagenomic sequences with arbitrary species abundance ratio. Bioinformatics. 2011;27(11):1489–95.
38. Wang Y, Leung HC, Yiu S, Chin FY. Metacluster 4.0: a novel binning algorithm for ngs reads and huge number of species. J Comput Biol. 2012;19(2):241–9.
39. Tanaseichuk O, Borneman J, Jiang T. Separating metagenomic short reads into genomes via clustering. In: Algorithms in Bioinformatics. New York, NY, USA: Springer; 2011. p. 298–313.
40. Song K, Ren J, Zhai Z, Liu X, Deng M, Sun F. Alignment-free sequence comparison based on next generation sequencing reads. In: Research in Computational Molecular Biology. Berlin: Springer; 2012. p. 272–85. 41. Stuart GW, Moffett K, Baker S. Integrated gene and species phylogenies from unaligned whole genome protein
42. Stuart GW, Moffett K, Leader JJ. A comprehensive vertebrate phylogeny using vector representations of protein sequences from whole genomes. Mol Biol Evol. 2002;19(4):554–62.
43. Comin M, Verzotto D. Whole-genome phylogeny by virtue of unic subwords. In: Database and Expert Systems Applications (DEXA), 2012 23rd International Workshop On. Los Alamitos, CA, USA: IEEE Computer Society; 2012. p. 190–4.
44. Kuksa P, Pavlovic V. Efficient alignment-free DNA barcode analytics. BMC Bioinformatics. 2009;10(Suppl. 14):9. 45. Solovyev VV, Makarova KS. A novel method of protein sequence classification based on oligopeptide frequency
analysis and its application to search for functional sites and to domain localization. Comput Appl Biosci: CABIOS. 1993;9(1):17–24.
46. Ratnasingham S, Hebert PDN. BOLD: the barcode of life data system. Mol Ecol Notes. 2007;7:355–64. 47. Liu B, Gibbons T, Ghodsi M, Treangen T, Pop M. Accurate and fast estimation of taxonomic profiles from
metagenomic shotgun sequences. BMC Genomics. 2011;12(Suppl 2):4.
48. Segata N, Waldron L, Ballarini A, Narasimhan V, Jousson O, Huttenhower C. Metagenomic microbial community profiling using unique clade-specific marker genes. Nat Methods. 2012;9(8):811–4.
49. Edwards RA, Olson R, Disz T, Pusch GD, Vonstein V, Stevens R, et al. Real time metagenomics: Using k-mers to annotate metagenomes. Bioinformatics. 2012;28(24):3316–17.
50. Seth S, Välimäki N, Kaski S, Honkela A. Exploration and retrieval of whole-metagenome sequencing samples. Bioinformatics. 2014;30(17):2471–9.
51. Weitschek E, Fiscon G, Felici G. Supervised dna barcodes species classification: analysis, comparisons and results. BioData Mining. 2014;7:4.
52. Lehr T, Yuan J, Zeumer D, Jayadev S, Ritchie M. Rule based classifier for the analysis of gene-gene and gene-environment interactions in genetic association studies. BioData Mining. 2011;4(1):4.
doi:10.1186/1756-0381-4-4.
53. Polychronopoulos D, Weitschek E, Dimitrieva S, Bucher P, Felici G, Almirantis Y. Classification of selectively constrained dna elements using feature vectors and rule-based classifiers. Genomics. 2014;104(2):79–86. 54. Kudenko D, Hirsh H. Feature generation for sequence categorization. In: AAAI/IAAI. Cambridge, USA: The MIT Press;
1998. p. 733–8.
55. Ben-Hur A, Brutlag D. Remote homology detection: a motif based approach. Bioinformatics. 2003;19(suppl 1):26–33. 56. Xing Z, Pei J, Keogh E. A brief survey on sequence classification. ACM SIGKDD Explorations Newslett. 2010;12(1):40–8. 57. Kuksa P, Pavlovic V. Efficient alignment-free dna barcode analytics. BMC Bioinformatics. 2009;10 Suppl 14:9.
doi:10.1186/1471-2105-10-S14-S9.
58. Vapnik VN, Vapnik V. Statistical Learning Theory. New York, NY, USA: Wiley; 1998.
59. Bertolazzi P, Felici G, Weitschek E. Learning to classify species with barcodes. BMC Bioinformatics. 2009;10(S-14):7. 60. Weitschek E, Lo Presti A, Drovandi G, Felici G, Ciccozzi M, Ciotti M, et al. Human polyomaviruses identification by
logic mining techniques. BMC Virol J. 2012;58(9):1–6.
61. Gaines BR, Compton P. Induction of ripple-down rules applied to modeling large databases. J Intell Inf Syst. 1995;5(3):211–28.
62. Frank E, Witten IH. Generating accurate rule sets without global optimization. In: Proc. of the 15th Int. Conference on Machine Learning. San Francisco, CA, USA: Morgan Kaufmann; 1998.
63. Cohen WW. Fast effective rule induction. In: Proceedings of the Twelfth International Conference on Machine Learning. San Francisco, CA, USA: Morgan Kaufmann; 1995. p. 115–23.
64. Felici G, Truemper K. A minsat approach for learning in logic domains. INFORMS J Comput. 2002;13(3):1–17. 65. Bertolazzi P, Felici G, Weitschek E. Learning to classify species with barcodes. BMC Bioinformatics. 2009;10(S14):7. 66. Quinlan JR. Improved use of continuous attributes in C4.5. J Artif Intell Res. 1996;4:77–90.
67. Hall M, Frank E, Holmes G, Pfahringer B, Reutemann P, Witten IH. The weka data mining software: an update. SIGKDD Explor Newsl. 2009;11(1):10–18. doi:10.1145/1656274.1656278.
68. Marcais G, Kingsford C. A fast, lock-free approach for efficient parallel counting of occurrences of k-mers. Bioinformatics. 2011;27(6):764–70. doi:10.1093/bioinformatics/btr011.
69. An Introduction to Support Vector Machines and Other Kernel-based Learning Methods. Cambridge, UK: Cambridge University Press.
70. Dasarathy BV. Nearest Neighbor NN Norms: NN Pattern Classification Techniques. Los Alamitos, CA, USA: IEEE Computer Society Press; 1991.
71. Teeling H, Meyerdiekers A, Bauer M, Glockner FO. Application of tetranucleotide frequencies for the assignment of genomic fragments. Environ Microbiol. 2004;6(9):938–47.
72. Pride DT, Meinersmann RJ, Wassenaar TM, Blaser MJ. Evolutionary implications of microbial genome tetranucleotide frequency biases. Genome Res. 2003;13:145–58.
73. Teeling H, Waldmann J, Lombardot T, Bauer M, Glockner FO. Tetra: a web-service and a stand-alone program for the analysis and comparison of tetranucleotide usage patterns in dna sequences. BMC Bioinformatics. 2004;5:163. 74. Chan RH, Chan TH, Yeung HM, Wang RW. Composition vector method based on maximum entropy principle for
sequence comparison. Comput Biol Bioinform IEEE/ACM Trans. 2012;9(1):79–87.
75. Qi J, Wang B, Hao BI. Whole proteome prokaryote phylogeny without sequence alignment: a k-string composition approach. J Mol Evol. 2004;58(1):1–11.
76. Yu ZG, Zhou LQ, Anh VV, Chu KH, Long SC, Deng JQ. Phylogeny of prokaryotes and chloroplasts revealed by a simple composition approach on all protein sequences from complete genomes without sequence alignment. J Mol Evol. 2005;60(4):538–45.
77. Song K, Ren J, Reinert G, Deng M, Waterman MS, Sun F. New developments of alignment-free sequence comparison: measures, statistics and next-generation sequencing. Brief Bioinform. 2014;15(3):343–53. 78. Blast Package Version 2.2.25-7. http://packages.ubuntu.com/precise/ncbi-blast+. Accessed Dec 2015. 79. Huang K, Brady A, Mahurkar A, White O, Gevers D, Huttenhower C, et al. Metaref: a pan-genomic database for
![Table 3 Accuracy (ACC) [%] and computational times (T) [sec] on the order level with differentvalues of K](https://thumb-us.123doks.com/thumbv2/123dok_us/357469.1528309/8.595.120.477.484.703/table-accuracy-acc-computational-times-order-level-differentvalues.webp)