Open Access
Research article
Identification of genes influencing dendrite morphogenesis in
developing peripheral sensory and central motor neurons
Yimiao Ou
†1,2,3, Barbara Chwalla
†4, Matthias Landgraf*
†4and Donald J van
Meyel*
†1,2,3Address: 1Centre for Research in Neuroscience, McGill University, Cedar Ave, Montreal, QC, H3G 1A4, Canada, 2Department of Neurology and Neurosurgery, McGill University, Montreal, QC, H3G 1A4, Canada, 3McGill University Health Centre Research Institute, Montreal, QC, H3G 1A4, Canada and 4Department of Zoology, University of Cambridge, Downing Street, Cambridge CB2 3EJ, UK
Email: Yimiao Ou - [email protected]; Barbara Chwalla - [email protected]; Matthias Landgraf* - [email protected]; Donald J van Meyel* - [email protected]
* Corresponding authors †Equal contributors
Abstract
Background: Developing neurons form dendritic trees with cell type-specific patterns of growth, branching and targeting. Dendrites of Drosophila peripheral sensory neurons have emerged as a premier genetic model, though the molecular mechanisms that underlie and regulate their morphogenesis remain incompletely understood. Still less is known about this process in central neurons and the extent to which central and peripheral dendrites share common organisational principles and molecular features. To address these issues, we have carried out two comparable gain-of-function screens for genes that influence dendrite morphologies in peripheral dendritic arborisation (da) neurons and central RP2 motor neurons.
Results: We found 35 unique loci that influenced da neuron dendrites, including five previously shown as required for da dendrite patterning. Several phenotypes were class-specific and many resembled those of known mutants, suggesting that genes identified in this study may converge with and extend known molecular pathways for dendrite development in da neurons. The second screen used a novel technique for cell-autonomous gene misexpression in RP2 motor neurons. We found 51 unique loci affecting RP2 dendrite morphology, 84% expressed in the central nervous system. The phenotypic classes from both screens demonstrate that gene misexpression can affect specific aspects of dendritic development, such as growth, branching and targeting. We demonstrate that these processes are genetically separable. Targeting phenotypes were specific to the RP2 screen, and we propose that dendrites in the central nervous system are targeted to territories defined by Cartesian co-ordinates along the antero-posterior and the medio-lateral axes of the central neuropile. Comparisons between the screens suggest that the dendrites of peripheral da and central RP2 neurons are shaped by regulatory programs that only partially overlap. We focused on one common candidate pathway controlled by the ecdysone receptor, and found that it promotes branching and growth of developing da neuron dendrites, but a role in RP2 dendrite development during embryonic and early larval stages was not apparent.
Conclusion: We identified commonalities (for example, growth and branching) and distinctions (for example, targeting and ecdysone response) in the molecular and organizational framework that underlies dendrite development of peripheral and central neurons.
Published: 10 July 2008
Neural Development 2008, 3:16 doi:10.1186/1749-8104-3-16
Received: 18 December 2007 Accepted: 10 July 2008
This article is available from: http://www.neuraldevelopment.com/content/3/1/16
© 2008 Ou et al.; licensee BioMed Central Ltd.
Background
Dendrites are the primary sites for the reception of sensory and synaptic input to neurons. This input is influenced by the architecture of the dendritic tree [1,2] and by the tar-geting of dendrites into appropriate territories [3,4]. For example, the length and tufted architecture of dendrites in the auditory brainstem of birds and mammals influences the tuning of coincidence-detecting neurons to optimal stimulus frequencies [5]. In the vertebrate spinal cord, specific targeting of motor neuron dendrites correlates with the precise matching with their presynaptic sensory afferents [4].
A current challenge for developmental neurobiologists is to uncover the cellular and molecular mechanisms that underlie the growth, branching and targeting of dendrites. The fruitfly, Drosophila melanogaster, has proven to be an effective model system for applying genetics to this issue [6-9]. Drosophila has neurons that are uniquely identifia-ble, with reproducible dendrite morphologies as intricate and diverse as those of vertebrates [2]. Moreover, Dro-sophila dendrites are also thought to be homologous to those of vertebrate neurons [7]. Within the peripheral nervous system (PNS) of Drosophila, studies to date indi-cate that genetic programs regulate the outgrowth, size, branching pattern and orientation of dendritic arborisa-tion (da) sensory neurons [2,6]. Although a range of mol-ecules implicated in da dendrite development have been identified, including cytoskeleton-associated proteins, small GTPases, transmembrane proteins, transcription factors and translation regulators, our understanding of da neuron dendrite morphogenesis remains far from complete [6,10-15]. Still less is known about the develop-ment of dendrites in the Drosophila central nervous system (CNS) [16]. Dendrites in the CNS differ from PNS sensory neuron dendrites in that they are not specialised for the reception of particular external stimuli [17-20] but instead form connections with presynaptic terminals of other neurons, and develop in a highly complex environment, the central neuropile.
In view of these fundamental differences, it is important to ask whether dendrites of peripheral and central neu-rons are shaped by distinct or shared mechanisms. To this end, we have carried out two comparable gain-of-function genetic screens in Drosophila to identify genes influencing dendrite morphogenesis. We used GAL4 driver lines [21] that express in either the da sensory neurons or an identi-fied central motor neuron, RP2, for which we designed a novel mosaic expression system [22]. We screened a well characterized collection of 141 lines that carry independ-ent insertions of the Gene Search (GS) P elemindepend-ent [23], a potent UAS-based vector that can direct the expression of genes flanking the site of insertion [24]. We identified genes in each screen that influenced dendritic
architec-ture. Some were novel, some were previously character-ized, and 39% of the genes were common to both screens. However, the phenotypes arising from the genes identi-fied in these screens revealed that fundamental differences may exist in the way peripheral and central neurons grow, branch, and find their targets.
Results
A gain-of-function screen for genes that influence the morphologies of peripheral neuron dendrites
Screening in embryos
To identify genes affecting da dendrite morphogenesis, we focused on da neurons of the dorsal PNS cluster, visual-ised selectively by GAL4109(2)80 and a transgene encoding
a membrane-targeted green fluorescent protein (GFP) reporter, UAS-mCD8::GFP [15,21]. We crossed each of 141 GS expression lines into this background and assayed in late stage 17 Drosophila embryos the effects on: overall PNS integrity; the number and position of GFP-positive cell bodies in the dorsal cluster; the extent of dendrite out-growth of dorsal cluster da neurons; and their pattern of branching. The results of this screen are reported in Table 1.
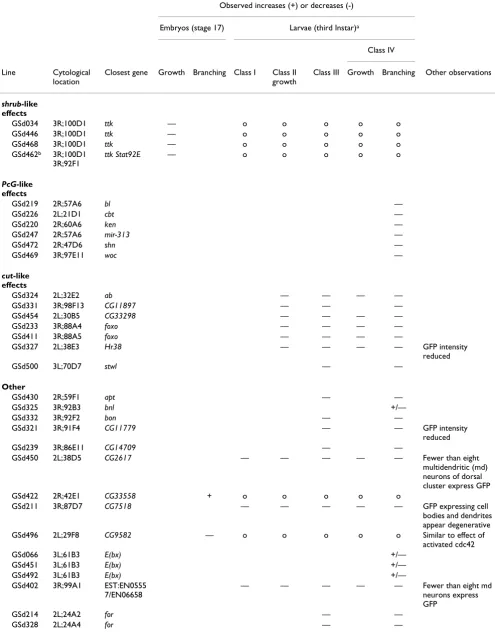
Our screen identified eight GS lines that, at embryonic stages, caused severely reduced dendrite outgrowth and/ or branching, or increased branching (Figure 1). For example, misexpression of GSd034 resulted in thickened lower order dendrites and reduced outgrowth of higher order dendritic branches (Figure 1c). Misexpression of GSd231 led to reduced dendritic growth as reflected by reduced area of the dendritic field (Figure 1d), though profuse branching was retained at the terminals of the shortened primary branches. A third example is misex-pression of GSd422, which caused the formation of ectopic spine-like protrusions from the main branches of all dorsal cluster da neurons (Figure 1f). These examples demonstrate that gene misexpression can modulate spe-cific aspects of dendritic development, such as growth and branching, and that the regulation of these two processes is genetically separable.
Screening in larvae
rela-Table 1: Dendrite morphology phenotypes observed in da neurons
Observed increases (+) or decreases (-)
Embryos (stage 17) Larvae (third Instar)a
Class IV
Line Cytological
location
Closest gene Growth Branching Class I Class II growth
Class III Growth Branching Other observations
shrub-like effects
GSd034 3R;100D1 ttk — o o o o o
GSd446 3R;100D1 ttk — o o o o o
GSd468 3R;100D1 ttk — o o o o o
GSd462b 3R;100D1
3R;92F1
ttk Stat92E — o o o o o
PcG-like effects
GSd219 2R;57A6 bl —
GSd226 2L;21D1 cbt —
GSd220 2R;60A6 ken —
GSd247 2R;57A6 mir-313 —
GSd472 2R;47D6 shn —
GSd469 3R;97E11 woc —
cut-like effects
GSd324 2L;32E2 ab — — — —
GSd331 3R;98F13 CG11897 — — —
GSd454 2L;30B5 CG33298 — — — —
GSd233 3R;88A4 foxo — — — —
GSd411 3R;88A5 foxo — — — —
GSd327 2L;38E3 Hr38 — — — — GFP intensity
reduced
GSd500 3L;70D7 stwl — —
Other
GSd430 2R;59F1 apt — —
GSd325 3R;92B3 bnl +/—
GSd332 3R;92F2 bon — —
GSd321 3R;91F4 CG11779 — — GFP intensity
reduced
GSd239 3R;86E11 CG14709 — —
GSd450 2L;38D5 CG2617 — — — — — Fewer than eight
multidendritic (md) neurons of dorsal cluster express GFP
GSd422 2R;42E1 CG33558 + o o o o o
GSd211 3R;87D7 CG7518 — — — — — GFP expressing cell
bodies and dendrites appear degenerative
GSd496 2L;29F8 CG9582 — o o o o o Similar to effect of
activated cdc42
GSd066 3L;61B3 E(bx) +/—
GSd451 3L;61B3 E(bx) +/—
GSd492 3L;61B3 E(bx) +/—
GSd402 3R;99A1 EST:EN0555
7/EN06658
— — — — — Fewer than eight md
neurons express GFP
GSd214 2L;24A2 for — —
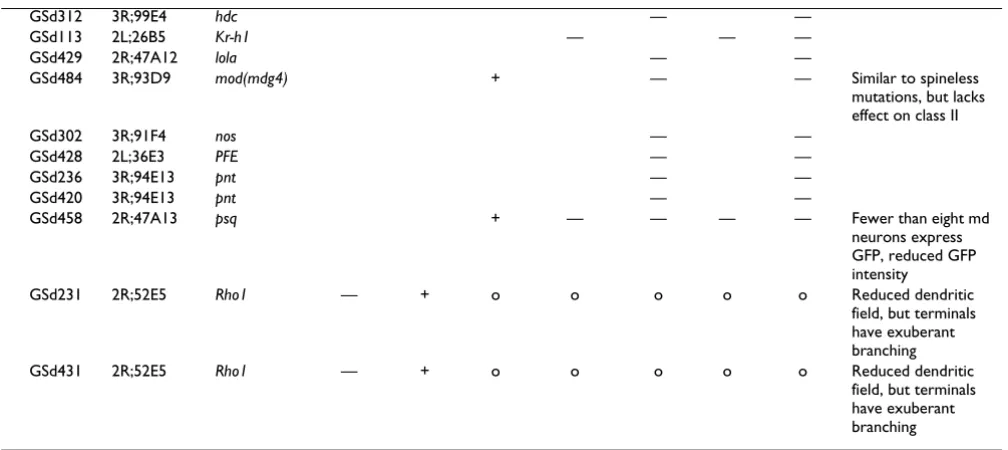
tively few primary dendrites with interstitial secondary and tertiary branches oriented in the anterior-posterior direction (Figure 2e). The dendrites of class II da neurons are long and typically have symmetric bifurcations. Class III dendrites are characterized by short spine-like protru-sions emanating from long main branches (Figure 2g). Class IV dendrites show highly complex branching pat-terns that innervate large regions of the body wall (Figure 2c) [25].
The majority of the 35 selected GS lines affected specific aspects of growth and branching of larval dendrites. The results of our study are catalogued in Table 1. Examples of phenotypes are provided in Figure 2 and are summarized below. Where phenotypic defects were specific to particu-lar classes, we confirmed this with class-specific driver lines (Figure 3).
Growth (12 lines)
Dendritic arbors with overtly reduced field area were interpreted as having growth defects. In other GS lines, the field area was unaffected because the major branches extended fully, yet minor branches of higher order showed reduced growth. For example, in class IV ddaC dendrites, misexpression of GSd239 reduced the length, but not necessarily the number of higher order branches (Figure 2d).
Branch number (31 lines)
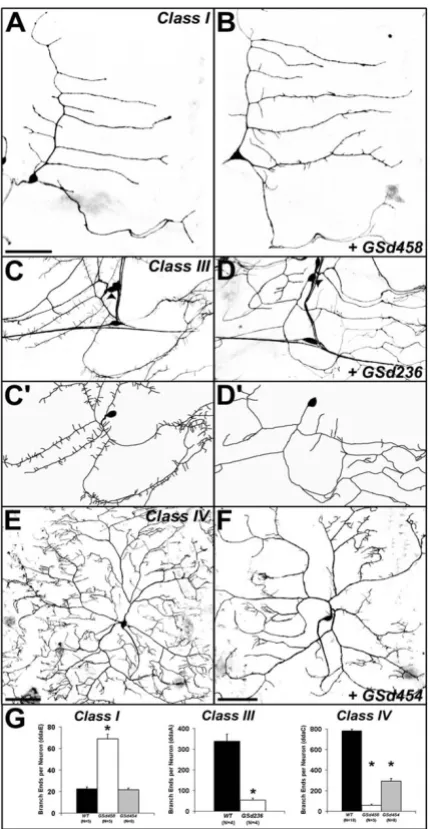
Increases and decreases of branch number were also observed. For example, misexpression of GSd302 (Figure 2b) and GSd454 (Figure 3f,g) specifically reduced the number of higher though not lower order branches.
Branch type (six lines)
In class I neurons, GSd458 increased the number of short tips on the normally bare primary and secondary branches (Figures 2f and 3b,g). The opposite effect was caused by misexpression of GSd236, which reduced the number of spine-like protrusions normally found on class III neurons (Figures 2h and 3d,d',g).
Degeneration (four lines)
Despite only mild effects on embryonic dendrite mor-phology, several GS lines caused severely reduced den-dritic trees at larval stages, often accompanied by degeneration of the cell soma, for example, GSd402 (Fig-ure 2i,j) and GSd450 (Fig(Fig-ure 2k,l).
Summary of phenotypes induced in da neuron dendrites
In total, we identified 43 GS lines causing da dendrite phenotypes at embryonic (8) or larval (35) stages. The phenotypes generated by many GS lines resemble those of known mutants and fall into five categories that may relate to known molecular pathways (Table 1). In the first category, four GS lines had phenotypes that resemble genetic mutations in shrub, which leads to reduced embry-onic da dendrite growth [26]. The second category (six lines) resembles phenotypes of Polycomb Group genes like
E(z), esc, or Su(z)12, which are involved in the mainte-nance of dendritic arbors of class IV neurons [27]. The third category contains seven GS lines that showed effects similar to cut mutations, the levels of which regulate class-specific dendritic growth and terminal branching [28]. A fourth phenotypic category is represented by GSd484, which resembled spineless mutants because it increased class I and reduced class III and IV dendrites [29].
How-GSd312 3R;99E4 hdc — —
GSd113 2L;26B5 Kr-h1 — — —
GSd429 2R;47A12 lola — —
GSd484 3R;93D9 mod(mdg4) + — — Similar to spineless
mutations, but lacks effect on class II
GSd302 3R;91F4 nos — —
GSd428 2L;36E3 PFE — —
GSd236 3R;94E13 pnt — —
GSd420 3R;94E13 pnt — —
GSd458 2R;47A13 psq + — — — — Fewer than eight md
neurons express GFP, reduced GFP intensity
GSd231 2R;52E5 Rho1 — + o o o o o Reduced dendritic
field, but terminals have exuberant branching
GSd431 2R;52E5 Rho1 — + o o o o o Reduced dendritic
field, but terminals have exuberant branching
aBoxes marked with an 'o' indicate that larval phenotypes were not assessed for those GS lines that had severe effects in embryos. bLine GSd462 harbours two insertions of the GS element.
Embryonic da dendrite screen – examples of phenotypes Figure 1
Embryonic da dendrite screen – examples of phenotypes.(a) Cartoon showing the relative positions of cell bodies of dorsal cluster multidendritic (md) neurons in late stage 17 embryos. The dotted box indicates the region of dendritic field cho-sen for enlargement in each of (b',c',d',e',f'). (b,b') In control animals, the dendritic trees of the six da neurons in the dorsal cluster can be visualized with GAL4109(2)80 driving membrane-targeted GFP (UAS-mCD8::GFP). (c,c') Misexpression of GSd034:
Larval da dendrite screen – examples of phenotypes Figure 2
Larval da dendrite screen – examples of phenotypes. (a) In a control third instar larva (GAL4109(2)80, UAS-mCD8::GFP/+),
GS misexpression with class-specific Gal4 drivers in larval da neurons Figure 3
GS misexpression with class-specific Gal4 drivers in larval da neurons.(a) Control class I da neuron ddaE visualized with GAL4221 driving UAS-mCD8::GFP. (b) Misexpression of GSd458 caused increased numbers of small dendritic branches,
though the primary branches were unaffected. (c) C161-GAL4 drives expression in classes I-III, but not class IV, allowing better visualization of spine-like protrusions on the class III neuron ddaA. Arrowheads in (c,d) mark the cell body of ddaA. (c') Trac-ing of ddaA cell body and dendrites in (c). (d) Misexpression of GSd236: primary dendrites of ddaA are devoid of spine-like protrusions. (d') Tracing of ddaA cell body and dendrites in (d). (e) ppk1.9-GAL4 is a class IV da neuron driver, revealing the complex dendritic tree of ddaC. (f) Misexpression of Gsd454: reductions in the number and growth of higher order branches of ddaC. (g) Quantification of branch ends per neuron for the genotypes shown in (a-f), showing class specificity of branching defects. In class I ddaE neurons (left), GSd458 increases branching dramatically (asterisk denotes t-test, P < 1e-5), while GSd454
has no effect. In class IV ddaC neurons (right), both GSd458 and GSd454 reduce branching relative to controls (wild type (WT); asterisks denote t-tests, both P < 1e-8). In both cases, the total length of the dendritic arbor was dramatically reduced
(control (WT) = 17,389 ± 422 μm versus GSd454 = 8,544 ± 657 μm (t-test P < 1e-10) or versus GSd458 = 2,650 ± 296 μm (t
-test, P < 1e-16). Since higher order branches were reduced but the growth of primary dendrites was mostly unaffected, there
was no effect on dendritic field area (for example, control = 304,899 ± 7,115 μm2 versus GSd454 = 301,475 ± 9,141 μm2; t-test P > 0.8). In class III ddaA neurons (middle), GSd236 dramatically reduced the number of short spine-like protrusions (t-test, P
ever, spineless mutants also have increased class II den-drites, which we did not observe with GSd484. Fifth, GSd496 showed reduced dendritic branching in embry-onic da neurons, similar to constitutive activation of the GTPase cdc42 [15].
In addition to these five phenotypic categories, we also identified 24 GS lines causing phenotypes that did not resemble known mutants. These lines suggest the exist-ence of additional genetic pathways that underlie den-dritic development and may, via their insertion sites into the genome, provide clues about their molecular nature.
A gain-of-function screen for genes that affect central neuron dendrites
To compare dendrite morphogenesis between peripheral sensory neurons and central neurons, we executed a com-parable misexpression screen for central neuron den-drites. Using a new FLPout based system we expressed the same 141 GS lines discussed above in selected RP2 motor neurons, again using mCD8::GFP to reveal dendrite mor-phologies [22]. With this system, misexpression is initi-ated by 14–15 hours after egg laying (AEL). At this time, RP2 neurons have begun to establish characteristic den-dritic trees in a particular neuropile territory and, in the periphery, RP2 axons have made contacts with their target muscles [30]. We examined RP2 dendritic trees more than 10 hours later, at 25–31 hours AEL, when the majority of dendritic branches are normally located in the lateral neuropile and only a few branches project towards the midline (Figure 4a–c).
We identified 60 GS lines that affect specific aspects of RP2 dendrite development (summarised in Table 2; for a comparative summary of both screens see Additional file 1). The resultant RP2 phenotypes fall into two partially overlapping classes: altered dendritic growth and/or branching; and aberrant dendritic targeting.
Growth and branching (19 lines)
Ten lines affected dendritic growth, reducing field size. We quantified the phenotypes caused by two lines (GSd466 and GSd312) in detail and found that the reduction in overall dendritic tree length was linked to a reduction in the number of branch points (Figure 4d–f). Eight lines caused branching defects, altering the pattern of branch-ing. While this appears to be associated with reduced growth and branch point number (Figure 4f), the category of 'branching' phenotypes can be distinguished from 'growth' phenotypes based on the extent to which the dendritic trees span neuropile territories in the antero-posterior axis (Additional file 2). Quantification of the phenotypes caused by expression of GSd446 and GSd450 further showed that the altered pattern of branching pro-duced more long (>5 μm) dendritic segments, as is typical
for other motor neuron classes (Figure 4f–h; M Tripodi et al., submitted). Only one line (GSd427) affected both growth and branching. It is possible that in some addi-tional cases reduced growth could have disguised an effect on branching. Unlike peripheral (da) dendrites, we did not find any lines that caused overgrowth of RP2 drites. Similar to da dendrites, the regulation of RP2 den-dritic growth and branching are clearly genetically separable (Figure 5).
Targeting in the antero-posterior axis (40 lines)
17 GS lines led to an extended anterior dendritic field and a trimming of the posterior field (Figure 4i–k). 22 lines induced an enlarged posterior territory, frequently (16/ 22) with reductions in the anterior dendritic field (Figure 4l,m and Table 2). One line, GSd440, led to reductions of the posterior tree only (not shown).
Targeting in the medio-lateral axis (26 lines)
To evaluate the medio-lateral distribution of dendrites, we used the set of FasciclinII axon bundles as landmarks [31] and defined the neuropile between the lateral and central intermediate axon bundle as 'lateral', and the region between the central intermediate fascicle and the ventral midline as 'medial' (Figure 4b,o,p). 20 GS lines caused reductions of medial branches, often (12/20) also increas-ing lateral branches (Figure 4f–q). Five lines induced extra medial branches, though only one of these, GSd309, showed concomitant reductions of lateral dendrites (Table 2).
In the majority of cases (70%), we found that dendritic mis-targeting led to a shift of the dendritic territory within a neuropile axis, as expansion in one direction was accom-panied by a complementary reduction in the other. Expansions of the dendritic field in one direction only were much less frequent (30%).
Dendritic targeting along Cartesian co-ordinates
RP2 dendrite screen – phenotypic categories Figure 4
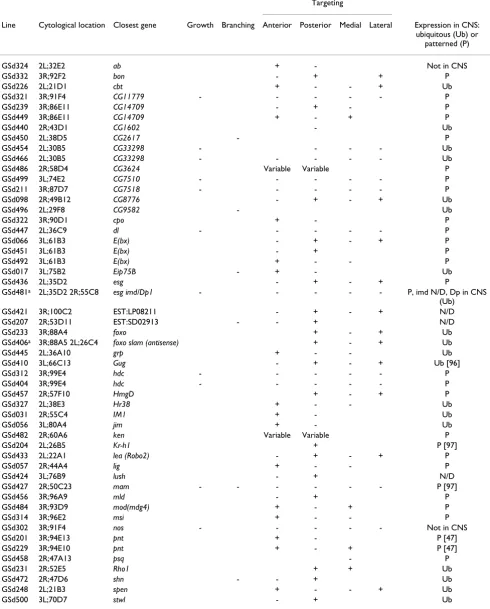
Table 2: Summary of phenotypes observed in RP2 neurons
Observed increases (+) or decreases (-)
Targeting
Line Cytological location Closest gene Growth Branching Anterior Posterior Medial Lateral Expression in CNS: ubiquitous (Ub) or
patterned (P)
GSd324 2L;32E2 ab + - Not in CNS
GSd332 3R;92F2 bon - + + P
GSd226 2L;21D1 cbt + - - + Ub
GSd321 3R;91F4 CG11779 - - - P
GSd239 3R;86E11 CG14709 - + - P
GSd449 3R;86E11 CG14709 + - + P
GSd440 2R;43D1 CG1602 - Ub
GSd450 2L;38D5 CG2617 - P
GSd454 2L;30B5 CG33298 - - - - Ub
GSd466 2L;30B5 CG33298 - - - Ub
GSd486 2R;58D4 CG3624 Variable Variable P
GSd499 3L;74E2 CG7510 - - - P
GSd211 3R;87D7 CG7518 - - - P
GSd098 2R;49B12 CG8776 - + - + Ub
GSd496 2L;29F8 CG9582 - Ub
GSd322 3R;90D1 cpo + - P
GSd447 2L;36C9 dl - - - P
GSd066 3L;61B3 E(bx) - + - + P
GSd451 3L;61B3 E(bx) - + P
GSd492 3L;61B3 E(bx) + - - P
GSd017 3L;75B2 Eip75B - + - Ub
GSd436 2L;35D2 esg - + - + P
GSd481a 2L;35D2 2R;55C8 esg imd/Dp1 - - - - - P, imd N/D, Dp in CNS
(Ub)
GSd421 3R;100C2 EST:LP08211 - + - + N/D
GSd207 2R;53D11 EST:SD02913 - - + N/D
GSd233 3R;88A4 foxo + - + Ub
GSd406a 3R;88A5 2L;26C4 foxo slam (antisense) + - + Ub
GSd445 2L;36A10 grp + - - Ub
GSd410 3L;66C13 Gug - + - + Ub [96]
GSd312 3R;99E4 hdc - - - P
GSd404 3R;99E4 hdc - - - P
GSd457 2R;57F10 HmgD + - + P
GSd327 2L;38E3 Hr38 + - - Ub
GSd031 2R;55C4 IM1 + - Ub
GSd056 3L;80A4 jim + - Ub
GSd482 2R;60A6 ken Variable Variable P
GSd204 2L;26B5 Kr-h1 + P [97]
GSd433 2L;22A1 lea (Robo2) - + - + P
GSd057 2R;44A4 lig + - - P
GSd424 3L;76B9 lush - + N/D
GSd427 2R;50C23 mam - - - P [97]
GSd456 3R;96A9 mld - + P
GSd484 3R;93D9 mod(mdg4) + - + P
GSd314 3R;96E2 msi + - - P
GSd302 3R;91F4 nos - - - Not in CNS
GSd201 3R;94E13 pnt + - P [47]
GSd229 3R;94E10 pnt + - + P [47]
GSd458 2R;47A13 psq - P
GSd231 2R;52E5 Rho1 + + Ub
GSd472 2R;47D6 shn - - + Ub
GSd248 2L;21B3 spen + - - + Ub
Targeting relative to the ventral midline has been docu-mented for axons [37,38]. Some of the molecular cues involved in this process (Slit and Netrins) and their recep-tors (Robo, Robo2, Robo3 and Frazzled/DCC) have also been shown to regulate midline crossing of dendrites in the Drosophila nerve cord [33,34]. We found that a GS insertion near lea/robo2, which encodes a receptor for the midline repulsive cue Slit [37,38], caused a reduction of dendrites innervating the medial neuropile (Figure 6e). We therefore asked if midline-derived guidance cues such as Slit and Netrin might be involved in targeting dendritic trees to distinct medio-lateral territories, in addition to their documented role in midline crossing. To test this hypothesis we over-expressed other elements of the Slit and Netrin signalling pathways: robo, commissureless and
frazzled. As previously reported, expression in RP2 of the
robo antagonist commissureless [39,40] or frazzled could lead to inappropriate midline crossing of RP2 dendrites [33]. However, we found that expression of frazzled, though not commissureless (N = 49), also led to an expan-sion of the RP2 dendrites innervating the medial neuro-pile (Figure 6a–c,g), which is normally occupied by dendrites of other motor neurons such as RP1 and RP3. Conversely, expression of the Slit receptor Robo led to an absence of medially positioned branches (Figure 6f,g).
Our results support the idea that dendrites in the CNS are targeted along the antero-posterior and medio-lateral
neuropile axes using, at least in part, guidance cues that also pattern axon trajectories.
Growth and branching of central dendrites is specified independently from the target territory
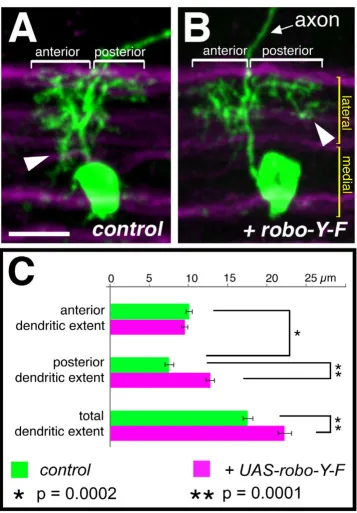
We next investigated the strategy with which motor neu-ron dendrites innervate particular neuropile territories. Do dendritic arbors expand until their target territory is occupied? Or do motor neurons have a program of den-dritic growth and branching that is independent of the positioning of dendrites within the neuropile? To distin-guish between these alternatives, we altered the dendritic territory of RP2 by misexpression of an activated form of Robo (Robo-Y-F [41]). This manipulation suppressed the establishment of dendritic branches in the medial neuro-pile anterior of the axon and led to a concomitant poste-rior expansion of the arbor, phenocopying GS lines that also reduce the medial dendritic territory (Figure 7). We measured the maximal distances (extent) to which den-dritic trees extend anterior and posterior of the axon. We found that this manipulation led to a significant increase in the extent to which RP2 dendrites project posteriorly (dendritic extent of posterior arbors: 7.4 ± 1.5 μm wild type versus 12.7 ± 1.3 μm Robo-Y-F, p = 0.0001, t-test; Fig-ure 7). However, expression of UAS-robo-YF does not abolish the establishment of anterior dendrites in the lat-eral neuropile and the anterior extent of the arbor is there-fore comparable to controls (anterior arbors: 10 ± 0.9 μm wild type versus 9.4 ± 1 μm Robo-Y-F, p = 0.22, t-test; N = 8; Figure 7). This correlation between the induced absence of branches in the medial anterior neuropile and the extension of the posterior territory is compatible with the notion that expression of UAS-robo-YF may have caused a displacement of part of the dendritic tree from a medial anterior to a lateral posterior domain.
To further investigate the relationship between dendritic growth and targeting, we compared controls to RP2 neu-rons with marked dendritic mistargeting phenotypes as induced by misexpression of GSd421 (Figure 8). For a quantitative readout we reconstructed dendritic trees from three-dimensional confocal image stacks using recently developed reconstruction algorithms [42,43] (Figure 8a,b). As anticipated, we found significant differences in the directionality of dendritic growth (that is, targeting),
GSd234 2R;49E7 Su(z)2 + P
GSd426 2R;49E7 Su(z)2 - + - + P
GSd309 3R;89B9 tara + - Ub
GSd413 3R;89B8 tara - + Ub
GSd485 3R;89B9 tara + - - Ub
GSd446 3R;100D1 ttk - Not in CNS neurons [98]
GSd468 3R;100D1 ttk - Not in CNS neurons [98]
GSd462a 3R;100D1 3R;92F1 ttk Stat92E - Not in CNS neurons [98]
aLines GSd481, GSd406, and GSd462 each harbour two insertions of the GS element.
Table 2: Summary of phenotypes observed in RP2 neurons (Continued)
Dendrite growth and branching are distinctly affected by gene misexpression
Figure 5
reflected by the maximum dendritic path lengths from the axon to the perimeter of the dendritic trees (19 ± 3 μm control versus 31 ± 4 μm experimental, p < 0.003, t-test) (Figure 8c). However, control and GSd421-misexpressing RP2 neurons did not differ significantly in other aspects of dendritic growth and branching, including total dendritic length (157 ± 16 μm wild type versus 143 ± 21 μm GSd421) and number of dendritic tips generated (35 ± 6 wild type versus 36 ± 4 GSd421).
These observations demonstrate that dendritic growth and branching are regulated by mechanisms that are genetically separable from targeting: RP2 motor neurons generate a set quantity of dendritic length and branches independent of the neuropile domains in which they are positioned. The quantitative analysis further addresses the
longstanding issue of which attributes of neurons are genetically specified and which are subject to non-genetic influences and, therefore, highly variable [44,45]. Here we show that total dendritic length, branch point number and territories of branching are reproducible features. In contrast, the number of primary branches was highly var-iable.
Reliability of the misexpression screens
Next, we assessed the reliability of the screening method by making use of the fact that, for each of the GS lines, the closest gene predicted to be expressed in response to Gal4 has previously been identified [23]. First, in the entire col-lection of 141 lines, there were 29 genes for which there were at least two independent GS insertions. We deter-mined the frequency with which independent GS-lines
Dendritic targeting relative to the ventral midline Figure 6
Dendritic targeting relative to the ventral midline.(a) Control and (b,c,e,f) experiments showing confocal images (maximal Z-projections) of RP2 neurons at 25–31 hours AEL, visualised with UAS-mCD8::GFP (green) in the context of a set of axon tracts visualised by anti-FasciclinII staining (magenta). Dendrites between the lateral and central intermediate Fasciclin II fascicle are defined as 'lateral'; dendrites located between the central intermediate fascicle and the midline as 'medial'. Misex-pression lines are indicated in the bottom left hand corner of each panel. (b) Misexpression of commissureless (comm) leads to aberrant midline crossing of dendritic branches (arrowhead), though no apparent increase of dendrites targeted towards the midline between the intermediate and medial FascilinII tracts. The high variability in phenotype is partly due to the varying lengths the dendritic tree mis-routed across the ventral midline. (c) Misexpression of frazzled (fra) causes increased targeting of dendrites into the medial neuropile (arrowhead). Black asterisk indicates the cell body of the contralateral RP2 neuron. (d,d') Ventral (d) and lateral (d') views of stage 13 embryos driving expression of GSd433 with engrailed-GAL4 and stained by in
situ hybridisation using an anti-sense probe against robo2. The staining shows the segmentally repeated stripes characteristic for
engrailed. The reaction had to be terminated before the endogenous robo2 expression pattern appeared (see Additional file 3) due the high levels of expression. (e,f) Misexpression of robo2 by GSd433 (e) or robo (f) leads to a reduction to near absence (robo) of branches innervating the medial neuropile (arrowheads), and some dendritic branches positioned aberrantly lateral of the lateral Fasciclin II axon tract (arrows). (g) Quantification showing ratios of medial/lateral dendrites; *P = 0.04, **P < 0.001,
Displacement of dendritic branches from medial anterior to posterior lateral regions Figure 7
Displacement of dendritic branches from medial anterior to posterior lateral regions. RP2 neurons at 25–31 hours AEL and visualised with UAS-mCD8::GFP in the context of FascicilinII positive axon bundles (magenta) demarcating the medial and lateral neuropile (maximal Z-projections of confocal image stacks). (a) Control. (b) Misexpression of UAS-robo-Y-F
Dendritic growth, branching and targeting are regulated independently Figure 8
Dendritic growth, branching and targeting are regulated independently. (a,b) Three-dimensional reconstructions from confocal image stacks of RP2 neurons at 25–31 hours AEL and visualised with UAS-mCD8::GFP generated with AMIRA software. (a) Control. (b) Misexpression of GSd421 causes aberrant dendritic targeting to the posterior. Brackets in (a) indi-cate the dendritic tree. (a',b') Dendrograms derived from the reconstructions with branch points highlighted in magenta and the cell body and axon offset from the dendritic tree by green. (c) Quantification of the dendritic architectures for controls (green, N = 4) and GSd421 expressing RP2 neurons (magenta, N = 4). The significance of pair-wise comparisons using Student's
near the same gene gave concordant results: 20/29 genes (69%) in the da screen and 17/29 (59%) in the RP2 screen (Tables 1 and 2). Where different phenotypes were induced by the expression of independent GS lines near the same gene, this may in some instances be due to inser-tion site-specific variainser-tions in gene expression levels. In other cases, different GS insertions in the same gene may generate functionally distinct transcripts, as is predicted for insertions in the Kr-h1 (GSd113 = Kr-h1-RA; GSd204 =
Kr-h1-RB transcript) and pnt loci (GSd229 = pnt-RC; GSd236 and GSd420 = pnt-RB transcript) [46-48]. With 69% and 59% concordance, respectively, and evidence for isoform-specific insertions at some of the discordant loci, we judge these screens to be a reliable means for identify-ing genes that influence dendrite development.
Secondly, we asked if the screens reported here had recov-ered predicted candidate genes. Among the 35 genes iden-tified in the da screen, five have been studied previously in the context of da dendrite development: abrupt (ab),
nanos (nos), bonus (bon), E(bx) and tramtrack (ttk). In all of these cases, the GS misexpression phenotypes are con-versely related to the reported mutant or RNA interference (RNAi) knockdown phenotypes [11,49-51]. For instance, mutation or RNAi knockdown of ab increases arborisation of class I neurons, while expression of GSd324 (inserted closest to ab) in class II-IV da neurons reduces dendritic branching as previously reported for misexpression of ab
[50,51]. This concurrence suggests that the additional 30 candidate genes identified in the da screen may reveal new molecular determinants of PNS dendrite morphologies.
For the screen on central neuron dendrites we had to gauge its utility differently, since genes regulating the development of RP2 dendrites remain largely unknown. We therefore examined with in situ hybridization whether identified genes were actually expressed in the embryonic CNS during the time of dendritic outgrowth, stages 14– 16. We assayed 47 of the 51 genes and found 43 to be expressed in the CNS, 25 of these in subsets of cells (Table 2; Additional file 3). These expression data suggest a high degree of confidence in the validity of the screen, though further loss-of-function studies are needed to test this directly.
A comparison of dendrite development between peripheral and central neurons
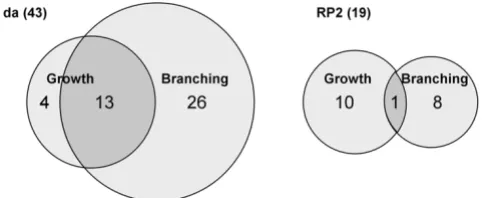
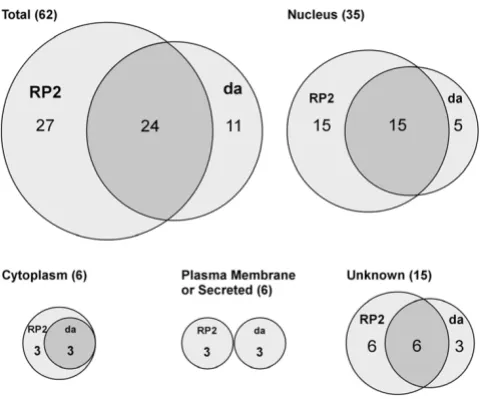
One of our aims was to ask whether the development of peripheral and central neuron dendrites is influenced by common or distinct molecular mechanisms. We did so by comparing the effects of the same GS lines on da and RP2 neurons. Of the 35 unique genes identified in the da screen and 51 for RP2, there were 24 genes (39%) that were capable of influencing dendrites in both cell types (Table 3; Figure 9). Therefore, there were 11/35 genes
(31%) that were particular to the da screen, while 27/51 genes (53%) were specific to the RP2 screen. This provides evidence that neither screen was prone to chronically low levels of gene misexpression that might prevent detection of phenotypes, and that each screen could reveal unique genes.
We classified the products of all previously studied genes according to their proposed site of activity (nucleus, cyto-plasm, plasma membrane, secreted; Figure 9). The major-ity (56%) are predicted to encode nuclear proteins. This is not surprising since the lines in the GS collection were pre-selected for lethal effects when expressed throughout the nervous system. We have argued previously that this pre-selection, which has enriched the collection for visible phenotypes, may also have biased the collection toward transcriptional regulators whose misexpression may deregulate the expression of multiple downstream genes [23]. Such factors could also interfere with the establish-ment of cell fate in some cases, causing transformations that switch dendritic architecture toward that of other classes. The proportion of genes encoding nuclear factors that were either unique or common to the two screens is similar to the proportions observed for all sites of activity in total (Figure 9). The same is true for unknown proteins (Figure 9). Notably, all of the cytoplasmic proteins that we identified to have an effect in the da screen also affected RP2 dendrites. This analysis suggests that peripheral and central dendrites are influenced by partially overlapping cytoplasmic and nuclear regulatory programs. However, the complete lack of overlap among the plasma mem-brane-associated and secreted proteins (Figure 9) suggests that factors mediating interactions between developing dendrites and substrata may be highly specific for periph-eral versus central neurons.
The EcR regulates the morphogenesis of da neuron dendrites
Finally, we wanted to test whether there were molecular mechanisms uncovered by these screens that were required for dendrite morphogenesis, and whether these mechanisms shed light on common or distinct pathways for peripheral and central dendrites. In both the da and RP2 screens, we identified several candidate genes (Kr-h1,
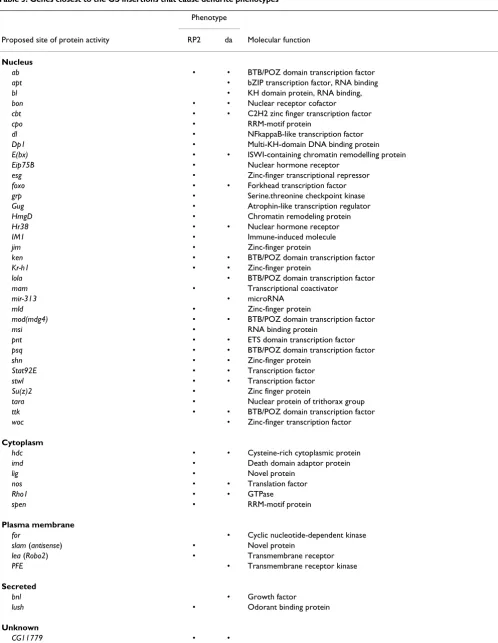
regulat-Table 3: Genes closest to the GS insertions that cause dendrite phenotypes
Phenotype
Proposed site of protein activity RP2 da Molecular function
Nucleus
ab • • BTB/POZ domain transcription factor
apt • bZIP transcription factor, RNA binding
bl • KH domain protein, RNA binding,
bon • • Nuclear receptor cofactor
cbt • • C2H2 zinc finger transcription factor
cpo • RRM-motif protein
dl • NFkappaB-like transcription factor
Dp1 • Multi-KH-domain DNA binding protein
E(bx) • • ISWI-containing chromatin remodelling protein
Eip75B • Nuclear hormone receptor
esg • Zinc-finger transcriptional repressor
foxo • • Forkhead transcription factor
grp • Serine.threonine checkpoint kinase
Gug • Atrophin-like transcription regulator
HmgD • Chromatin remodeling protein
Hr38 • • Nuclear hormone receptor
IM1 • Immune-induced molecule
jim • Zinc-finger protein
ken • • BTB/POZ domain transcription factor
Kr-h1 • • Zinc-finger protein
lola • BTB/POZ domain transcription factor
mam • Transcriptional coactivator
mir-313 • microRNA
mld • Zinc-finger protein
mod(mdg4) • • BTB/POZ domain transcription factor
msi • RNA binding protein
pnt • • ETS domain transcription factor
psq • • BTB/POZ domain transcription factor
shn • • Zinc-finger protein
Stat92E • • Transcription factor
stwl • • Transcription factor
Su(z)2 • Zinc finger protein
tara • Nuclear protein of trithorax group
ttk • • BTB/POZ domain transcription factor
woc • Zinc-finger transcription factor
Cytoplasm
hdc • • Cysteine-rich cytoplasmic protein
imd • Death domain adaptor protein
lig • Novel protein
nos • • Translation factor
Rho1 • • GTPase
spen • RRM-motif protein
Plasma membrane
for • Cyclic nucleotide-dependent kinase
slam (antisense) • Novel protein
lea (Robo2) • Transmembrane receptor
PFE • Transmembrane receptor kinase
Secreted
bnl • Growth factor
lush • Odorant binding protein
Unknown
ing genes involved in ecdysone responses [59], and Hr38
encodes an orphan receptor that can compete with the ecdysone receptor (EcR) for binding to its obligate co-receptor, Ultraspiracle (Usp) [60,61].
Our findings that Kr-h1, bon and Hr38 may influence the morphologies of da dendrites suggested a new role for ecdysone signalling in addition to its role in metamor-phosis when it induces dendrite regression and pruning. This is consistent with a recent study that showed that arborisations of class I da neurons are reduced by RNAi knockdown and mutations in EcR and usp [11]. However, it remained unresolved whether EcR and Usp are required cell-autonomously in da neurons, as is the case for den-drite pruning at pupariation [9,54].
To investigate this further, we confirmed expression of the EcR-A and EcR-B1 protein isoforms [62] in dorsal da neu-rons of third instar larvae (Additional file 5) [54]. Focus-ing on the class IV neuron ddaC, we then tested with three approaches whether there is a requirement for the EcR in ddaC dendrite development. First, since mosaic analysis with a repressible cell marker (MARCM) could not be applied directly to the EcR due to its cytological location, we generated MARCM clones for mutations in the EcR co-receptor, Usp [9,63]. Relative to control clones (Figure 10a), the dendritic arbors of ddaC neurons in usp2 null
mutant clones had reduced numbers of branches (control = 754.1 ± 15.1 versus usp2 MARCM = 580.3 ± 23.1; p < 1e-6, t-test; Figure 10b,c). We also examined MARCM clones for
usp3 (a hypomorphic allele) and usp5, a missense mutation
in the second zinc finger of the DNA binding domain of Usp [9]. Unlike the null usp2 allele, neither usp3 nor usp5
showed branching defects in ddaC neurons (not shown), likely due to residual Usp function in these mutant clones. Second, we used the class IV-specific driver ppk1.9-GAL4
[17] to express an RNAi-inducing construct of the EcR (UAS-IR-EcR) that targets all EcR isoforms [64]. This resulted in a significant reduction in the mean density of branches to 75.8% of control levels, as measured by the number of branch ends normalised to dendritic field area (Figure 10e,g). Third, as an additional direct manipula-tion, we expressed a dominant negative form of the recep-tor (EcR-DN) that binds Usp normally, but fails to bind ecdysone and cannot activate transcription, and is thereby a competitive inhibitor of all endogenous isoforms of EcR [65]. This also reduced the density of ddaC dendrites (50.8% of controls; Figure 10f,g), affecting primarily higher order branches and so having negligible impact on the field area (mean area in controls = 304,899 ± 7,115
μm2 versus EcR-DN = 308,802 ± 7,400 μm2).
Together, the reduced branching observed in usp2 MARCM
clones and in the direct EcR manipulations using RNAi and EcR-DN support the idea that ecdysone promotes the arborisation of developing ddaC neurons prior to and in
CG11897 •
CG14709 • •
CG1602 •
CG2617 • •
CG33298 • •
CG33558 •
CG3624 •
CG7510 •
CG7518 • •
CG8776 •
CG9582 • •
EST:EN05557/EN06658 •
EST:LP08211 •
EST:SD02913 •
Table 3: Genes closest to the GS insertions that cause dendrite phenotypes (Continued)
Overlap of RP2 and da screens, classified by sites of gene activity
Figure 9
The EcR pathway is required for peripheral dendrite development Figure 10
The EcR pathway is required for peripheral dendrite development.(a) Control class IV ddaC MARCM clone. (b)
usp2 MARCM clone showing reduced ddaC dendrite branches. (c) Quantification of the mean number of branch ends per
neu-ron, comparing wild-type (WT) to usp2 MARCM clones. The asterisk indicates significant reduction (t-test, P < 0.000001). (d)
Control ddaC neuron (genotype: UAS-mCD8::GFP/+;;ppk1.9-GAL4/+). (e) Expression of RNAi-inducing UAS-IR-EcR, targeting all EcR isoforms. (f) Expression of a dominant-negative EcR (EcR-DN). (g) The graph on left shows the mean number of branch ends per neuron for all genotypes tested, including those co-expressing UAS-Dicer2 (Dcr2), a component of the RNAi machin-ery that can potentiate the RNAi effect [88]. The graph on right shows the mean branch density in ddaC class IV neurons. Pair-wise comparisons (ANOVA, Tukey, P < 0.0001) determined that EcR RNAi significantly reduced both branch number per neuron and branch density (single asterisks). EcR-DN further reduced branch number and density to levels lower than both controls and RNAi (double asterisks). The analysis revealed that the RNAi-induced reduction of branch density (right graph) was not enhanced by coexpression of Dcr2. (h) Control ddaC neuron (same genotype as (d)) in first instar larva (28–30 hours AEL). (i) Expression of EcR-DN (same genotype as (f)). (j) EcR-DN reduced branch number in first instar larvae (asterisk, t -test, P < 1e-7), but did not influence the field area (control = 11,349.7 ± 324.6 μm2 versus EcR-DN = 12,261.0 ± 372.7 μm2, t
addition to its role in metamorphosis. This is consistent with other experiments showing that ecdysone enhances neurite outgrowth of cultured Drosophila neurons in vitro
[66]. We explored whether this role for the EcR could influence dendrite arborisation in embryonic and early larval development, or whether it was restricted to later larval life. We found that the EcR was expressed in embry-onic dorsal da neurons, including ddaC (Additional file 5), and that reduced branching caused by EcR-DN was already apparent in first-instar larvae 28–30 hours AEL (mean branches per ddaC neuron in controls = 190.4 ± 5.0 versus EcR-DN = 139.1 ± 4.1; Figure 10h–j).
Central RP2 dendrites were also affected by GS lines near the three genes Kr-h1, bon, and Hr38 (Additional file 4). However, unlike in da neurons, misexpression of EcR-DN in the RP2 neuron using the FLPout system did not con-sistently affect its dendrites despite high expression levels (not shown), suggesting that EcR may not play a role in CNS dendrite growth in embryonic and early larval stages.
Discussion
The development of dendrites, including their patterns of growth, branching and targeting, are critical to the func-tion of neurons and neural circuits [1]. Here, we have applied genetic screens in Drosophila to improve our understanding of cellular and molecular mechanisms governing dendrite development. Specifically, we used a well-characterised collection of 141 GS misexpression lines to perform two gain-of-function screens, one for peripheral neurons and one for central neurons. Our goals were: to identify new candidate genes involved in dendrite development; to understand better the organizational framework within which dendrites develop; and to com-pare dendrite development between peripheral and cen-tral neurons through the candidate genes identified and their misexpression phenotypes.
Identification of genes involved in dendrite patterning
This study is the first published report of a misexpression approach used to identify candidate genes required for dendrite development. Clearly, this strategy has limita-tions since genes that induce phenotypes may not be required for dendrite development, nor are the pheno-types necessarily informative. Despite these concerns, we judge these gain-of-function screens a useful alternative to forward loss-of-function genetic screens, which can be limited by technical challenges (for example, when target-ing specific cells) and by genetic redundancies. We deem it a valid strategy for gene discovery in many cases since at least 5 of the 35 genes identified in the da neuron screen (ab, nos, bon, E(bx) and ttk) are known to be required for da dendrite patterning and have loss-of-function types that are the converse of the gain-of-function pheno-types described here [11,49-51]. Notably, the da screen
led to the discovery that signaling through the EcR path-way promotes the arborisation of developing da neurons prior to metamorphosis.
Considerably more candidate genes, 51, were identified in the central neuron (RP2) dendrite screen. This difference in sensitivity between the two screens may reflect true dif-ferences in developmental robustness, or a bias within the GS collection, or technical issues such as the strength of the Gal4 drivers or the ease of detection of mutant pheno-types. The collection did not contain any genes shown previously to be required for dendrite development in central neurons (for example, shot/kak,fra,robo, sema1a,
Dscam) [32-34,36,67]. We were therefore unable to vali-date the RP2 screen in the same manner as the da neuron screen. However, the phenotypes recovered were specific for particular aspects of dendrite growth, branching and targeting, and as such reveal the constraints of the under-lying organizational framework. By way of verification we were able to show that at least 43 of 51 candidate genes from the RP2 screen are expressed in the CNS during the period of dendritic outgrowth and targeting. Since their ectopic and/or elevated expression in RP2 is sufficient to mis-pattern RP2 dendrites, these genes could encode novel factors required for CNS dendrite development.
Features of dendrite morphogenesis that are genetically regulated: a comparison of peripheral and central dendrites
The second aim of this study was to gain a better under-standing of the organizational framework that underlies dendrite development. In both screens the misexpression phenotypes fell into specific categories, demonstrating that specific features of dendrite development, such as growth, branching and targeting can be reproducibly and selectively modulated. Within each screen, there was incomplete overlap between phenotypic categories, sug-gesting that these features are derived from molecularly distinct mechanisms. Comparing the two screens, we found molecular and phenotypic evidence for similarities as well as differences between peripheral da and central RP2 neurons in the implementation of dendrite growth, branching and targeting.
Growth and branching
additional clear examples such as GSd422, which caused increased formation of higher order branches while leav-ing the growth and pattern of lower order dendrites intact.
How is the extent of growth and branching regulated? For peripheral da neurons we found that many GS lines led to a reduction of either dendrite growth (17 of 43) and/or branching (32 of 43). We also recovered phenotypes with increased growth and branching (for example, GSd422 (Figure 1f) and GSd458 (Figure 2f)). Increased growth and branching has also been reported for flamingo and
sequoia mutants (growth) or mutations in abrupt and over-expression of cut (branching) [28,50,51,71,72]. Together these observations indicate that for da neurons the rates of growth and branching are not maximal during normal development but are tightly regulated. This regulation is clearly influenced by class-specific factors, as shown here and elsewhere [28,50,51], and by global cues such as ecdysone, which may implement matching the density of da dendrites to the area of growing receptive fields.
In addition, there are also genetic components that link dendritic growth and branching complexity. For instance, we found that two GS lines (GSd231, GSd431) closest to
Rho1 cause exuberant dendritic branching but at the same time reduce growth. Such opposing effects on growth and branching have also been reported for several transcrip-tion factors [11]. The factors that balance growth and branching may be part of a molecular switch that modu-lates cytoskeletal dynamics to favour growth at the expense of branching or vice versa. Switching between extension and branching may aid the exploratory den-dritic growth necessary for denden-dritic tiling and self-avoid-ance [25,73-77].
How is dendritic growth and branching regulated in cen-tral (RP2) neurons? The quantitative comparison between control and GSd421-expressing RP2 neurons revealed that parameters such as total dendritic length and branch point number are probably specified by the RP2 genetic program of differentiation, since these are fairly invariant features. The detailed tree architecture, however, as indi-cated by the number of primary branches, is highly varia-ble and, therefore, not likely part of such a genetic program. Contrasting with the da neuron screen, the RP2 screen recovered no GS lines whose expression had oppo-site effects on growth and branching, nor lines that caused exuberant growth or branching. This could be interpreted as RP2 dendritic growth being near maximal at the devel-opmental stage that we examined (early first instar larva). Alternatively, the lack of overgrowth phenotypes may be due to a lack of GS insertions near central dendrite over-growth-inducing genes, or insufficient sensitivity of detec-tion. Contrasting further with da neurons, we found that RP2 neurons generated dendritic trees of a standard size
by the early first instar stage (as quantified by dendritic length and number of branches), irrespective of the terri-tory they occupied.
Are dendrite growth and branching influenced by the same genes in peripheral and central neurons? Though both misexpression screens suggested a role for ecdysone signalling, further loss-of-function testing found that only the peripheral da neurons required the EcR. Moreover, there was remarkably little overlap (nine GS lines) between the 'growth' and 'branching' categories for peripheral da and central RP2 neurons, and no significant concordance of phenotypes generated by these nine GS lines. Only four (GSd211 (CG7518), GSd450 (CG2617), GSd454 (CG33298) and GSd472 (shn)) led to compara-ble growth and branching phenotypes in both types of neurons. Therefore, while growth and branching are prin-cipal features of all dendrites, central RP2 and peripheral da dendrites appear to differ significantly in the molecular pathways that regulate these features.
Neuronal diversity and branch order
Type-specific morphologies of dendritic trees are gener-ated by distinct levels of growth and branching, and also by the mode of branching (for example, splitting versus interstitial), the arrangement/angles of branches (for example, acute, right or obtuse) and the types of branches (for example, spine-like protrusions versus shafts). The dendrite morphologies of the four classes of da neurons are implemented by class-specific patterns of gene expres-sion. The simple, comb-like branching patterns of class I da neurons are governed by abrupt [50,51], while more complex branching patterns of class II-IV da neurons are specified by different levels of cut, with highest levels gen-erating spine-like protrusions particular to class III den-drites [28]. In our da neuron screen, many GS lines exhibited class-specific effects, indicating that the unique dendrite morphologies of distinct da neuron classes can be regulated by additional factors whose activity is dependent upon the cellular context. For instance, GSd458 and GSd484 caused exuberant dendrite branch-ing in class I neurons but the converse in class IV neurons (Table 1; Figure 2f). These findings are reminiscent of
spineless mutants, where class I and II dendrites are increased while class III and IV arbors are reduced, with the effect that these da neurons of different classes approach a similar degree of branching complexity [29].
spine-like protrusions, normally specific to class III da neurons, on other da classes. Branching order on the other hand is affected by four GS lines (GSd325, GSd066, GSd451, and GSd492) that cause a shift within class IV neurons from a branching morphology with higher order branches to one with lower order branches. It remains to be established whether lower and higher order branches of da neurons represent different types of dendrites, and whether pheno-types that reduce branch complexity reflect a direct effect of these GS lines on the proportion of different branch types within an arbor, the pattern of branching among dendrites of a similar type, or a partial transformation of cell identity.
Our screens provided less information about the regula-tion of type-specific branching patterns in central neu-rons, as we focused on RP2 only. While there is no evidence of different branch types among motor neuron dendrites, they do vary in the frequency of branching and length of dendritic segments: for example, higher branch orders and shorter segments are characteristic for aCC and RP2, while RP1 has lower branch orders and longer seg-ments (M Tripodi et al., submitted). We identified eight GS lines (GSd017, GSd207, GSd446, GSd450, GSd462, GSd468, GSd472, GSd496), which changed the RP2 to an RP1-like dendritic morphology with relatively long seg-ments and lower branching orders (Figure 4f–h). These observations suggest that motor neuron dendrite branch-ing is under genetic control and that it may be linked to segment length.
Targeting
The territories that dendrites innervate are important determinants of neuronal function, shaping the receptive field for peripheral sensory neurons and contributing to the selection of inputs for central neurons. We did not recover dendritic targeting phenotypes in the peripheral (da) dendrite screen, yet for central (RP2) neurons these were abundant, representing more than three-quarters of all phenotypes. This may reveal fundamental differences in the way peripheral (da) and central (RP2) neurons establish their dendritic territories. It is conceivable that the formation of most da dendritic fields requires few guidance cues because their fields are: largely two-dimen-sional; generally explored radially; and delineated through repulsive/competitive neuro-neuronal interac-tions such as tiling [25,73,77,78]. Extensions of da den-drites along antero-posterior and dorso-ventral axes in the body wall may reflect responses to patterning cues or, alternatively, could result from an inherent cellular polar-ity. Unfortunately, no evidence to support either alterna-tive was provided by our screen.
For central (RP2) neurons, whose dendrites are targeted to diverse regions within a complex, three-dimensional
neuropile, we found abundant evidence for dendritic ter-ritories being altered by gene misexpression. This is an exciting finding since this area of dendrite development is among the least explored. Unlike in the periphery, there are as yet no indications for the existence of tiling-like mechanisms in the ventral nerve cord of Drosophila [30], nor restrictions of growth by neuromere boundaries (for example, GSd421; Figure 4l). It is likely, therefore, that dendritic explorations in the CNS are directed by combi-nations of global and local guidance cues. The large number of genes we identified as candidates provide new entry points for investigating the genetic and molecular mechanisms that underlie dendritic targeting in the CNS.
The classes of targeting phenotypes that we observed for RP2 neurons suggest that central dendrites innervate terri-tories defined by Cartesian co-ordinates along the antero-posterior and the medio-lateral axes. The cues to establish these co-ordinates could be distributed at discrete loca-tions within the neuropil or in the form of gradients [79] (also reviewed in [80,81]). Cues shown to be required for targeting of central neuron dendrites (for example, Sema3A, Sema1A, Slit, Netrin) are compatible with guid-ance along gradients [32-35,82]. In this study, we pro-vided first evidence for the involvement of Slit and Netrin in targeting motor neuron dendrites to distinct medio-lat-eral neuropile territories through their receptors Robo and Frazzled. Although gradients are capable of defining a multitude of arborisation zones, relatively few zones might actually be required in the ventral nerve cord of
Drosophila, as suggested by the actual number (five) of apparent motor neuron dendritic territories in the antero-posterior axis of each abdominal half segment [30]. Spe-cificity of connections among the many neurons within such coarsely defined territories could be generated by additional, local cues and by functional validation of syn-aptic contacts.
Common or distinct molecular mechanisms for peripheral and central dendrite morphogenesis?
response). Furthermore, there was also a sizable overlap of 39% among the 62 candidate genes identified in both the da and RP2 screens, suggesting partially overlapping cytoplasmic and nuclear regulatory programs (Figure 9). However, at a more stringent level of comparison we found that particular GS lines do not necessarily induce comparable phenotypes in both cell types. In fact, candi-date genes that were common to both screens were as likely to generate different phenotypes as similar ones in peripheral and central neurons. Only four genes common to both screens gave similar phenotypes in both screens
(CG7518 (GSd211), CG2617 (GSd450), CG33298
(GSd454), and shn (GSd472). This observation suggests a more differentiated scenario, namely that the molecular implementation and regulation of dendrite morphogene-sis in peripheral da and central RP2 neurons is largely cell type-specific, perhaps because they have distinct cellular requirements to accommodate differences in environ-mental complexity, the specificity of intercellular connec-tions, or the integration of function and morphology. Nonetheless, the RP2 screen identified three genes not expressed in central neurons, but required for dendrite morphogenesis in peripheral (da) neurons (for example,
ab, nos,ttk). We interpret this cross-fertilisation between the screens as an indication that certain cellular tasks required for the extension, branching and stabilisation of dendrites are supported by similar, though perhaps not identical, regulatory mechanisms in both cell types.
Conclusion
We conclude that these gain-of-function screens in Dro-sophila identified new candidate genes for dendrite mor-phogenesis in peripheral da and central RP2 neurons. The phenotypes produced by these screens suggest that growth, branching and targeting of dendrites are regulated by pathways that are genetically separable. Direct compar-ison showed that 39% of the genes we identified were common to both screens, yet the phenotypes arising from the genes suggest that the dendrites of peripheral and cen-tral neurons grow, branch, and find their targets by molec-ular and cellmolec-ular mechanisms that only partially overlap and may be largely cell type-specific. For peripheral da neurons we identified a new cell-autonomous require-ment for EcR signalling during developrequire-ment prior to met-amorphosis, when it may implement matching of dendritic territories to growing target areas. For central RP2 neurons the screens provided evidence for dendritic targeting in the neuropile, likely along Cartesian coordi-nates. We identified the midline signalling systems Slit/ Robo and Netrin/Frazzled as candidates for dendritic tar-geting in the medio-lateral axis. The positioning of den-dritic trees in the neuropile appeared to be independent of the developmental programs specifying patterns of growth and branching. Taken together, the identified can-didate genes and phenotypes have advanced our
under-standing of the molecular and cellular framework within which dendrites develop.
Methods
Fly stocksGAL4 driver lines were: en-GAL4 [21]; Tub84B-FRT-CD2-FRT-Gal4 [86]; GAL4109(2)80 [15]; GAL4221 [28]; C161-GAL4 [87]; and ppk1.9-GAL4 [17]. UAS-lines were: UAS-mCD8::GFP [63]; UAS-EcR-DN (UAS-EcR-B1W650A) [65];
UAS-IR-EcR [64]; and UAS-Dcr2 [88].
GS expression lines
GS is a bidirectional UAS-based P-element that can acti-vate genes on either side of the insertion site [24,89]. As described previously [23], the 141 independent GS lines screened here were pre-selected from a larger collection (1,127) for having lethal effects when misexpressed in the entire embryonic nervous system (using scrt11–6-GAL4), so
as to enrich (eight-fold) for genes likely to disrupt neuro-nal morphology or function.
Screening of GS lines in da neurons
Forty-four PNS neurons form per abdominal hemi-seg-ment in three clusters [90,91]. We focused on the dorsal-most cluster in which there are eight neurons with multi-ple dendrites (md), including one tracheal dendrite (td) neuron, one neuron with bipolar dendrites (bd), and six dendritic arborisation (da) neurons. The pattern of den-drite outgrowth from dorsal cluster da neurons has been shown to be consistent from embryo to embryo [15,78].
For screening in embryos, each of the 141 GS lines was crossed to the recombinant fly line GAL4109(2)80, UAS-mCD8::GFP. Eggs were collected for 2 hours at 25°C, incu-bated at 25°C for another 17 hours, then shifted to 4°C for 24 hours to allow for improved visualization of the GFP signal. The resulting late stage 17 embryos were man-ually de-chorionated, fixed 5 minutes in 4% paraformal-dehyde, immersed in halocarbon 200 oil (Halocarbon Products, River Edge, NJ, USA), coverslipped, and exam-ined with confocal microscopy using a Yokogawa spin-ning disk confocal system (Perkin-Elmer, Waltham, MA, USA) on an Eclipse TE2000-U microscope (Nikon). Z-series images (60× objective) were collected using Meta-morph software (MDS Inc., Mississauga, ON, Canada). Image stacks (approximately 15 optical sections, step size 0.2 μm) were exported to Photoshop software (Adobe) and prepared for publication by converting images to greyscale and adjusting brightness and contrast. Neurons from at least 20 individuals per genotype were examined.