Atmos. Meas. Tech., 4, 1227–1240, 2011 www.atmos-meas-tech.net/4/1227/2011/ doi:10.5194/amt-4-1227-2011
© Author(s) 2011. CC Attribution 3.0 License.
Atmospheric
Measurement
Techniques
Diode laser-based cavity ring-down instrument for NO
3
, N
2
O
5
, NO,
NO
2
and O
3
from aircraft
N. L. Wagner1,2, W. P. Dub´e1,2, R. A. Washenfelder1,2, C. J. Young1,2, I. B. Pollack1,2, T. B. Ryerson1, and S. S. Brown1
1NOAA Earth System Research Laboratory, R/CSD7, 325 Broadway, Boulder, CO 80305, USA
2Cooperative Institute for Research in Environmental Sciences, University of Colorado, Boulder, CO 80309, USA Received: 9 February 2011 – Published in Atmos. Meas. Tech. Discuss.: 3 March 2011
Revised: 31 May 2011 – Accepted: 14 June 2011 – Published: 28 June 2011
Abstract. This article presents a diode laser-based, cavity
ring-down spectrometer for simultaneous in situ measure-ments of four nitrogen oxide species, NO3, N2O5, NO, NO2, as well as O3, designed for deployment on aircraft. The in-strument measures NO3 and NO2 by optical extinction at 662 nm and 405 nm, respectively; N2O5is measured by ther-mal conversion to NO3, while NO and O3are measured by chemical conversion to NO2. The instrument has several ad-vantages over previous instruments developed by our group for measurement of NO2, NO3 and N2O5 alone, based on a pulsed Nd:YAG and dye laser. First, the use of continu-ous wave diode lasers reduces the requirements for power and weight and eliminates hazardous materials. Second, de-tection of NO2 at 405 nm is more sensitive than our previ-ously reported 532 nm instrument, and does not have a mea-surable interference from O3. Third, the instrument includes chemical conversion of NO and O3to NO2to provide mea-surements of total NOx(= NO + NO2) and Ox (= NO2+ O3) on two separate channels; mixing ratios of NO and O3 are determined by subtraction of NO2. Finally, all five species are calibrated against a single standard based on 254 nm O3 absorption to provide high accuracy. Disadvantages include an increased sensitivity to water vapor on the 662 nm NO3 and N2O5channels and a modest reduction in sensitivity for these species compared to the pulsed laser instrument. The in-flight detection limit for both NO3 and N2O5 is 3 pptv (2σ, 1 s) and for NO, NO2and O3is 140, 90, and 120 pptv (2σ, 1 s) respectively. Demonstrated performance of the in-strument in a laboratory/ground based environment is better by approximately a factor of 2–3. The NO and NO2 mea-surements are less precise than research-grade chemilumi-nescence instruments. However, the combination of these five species in a single instrument, calibrated to a single
Correspondence to: S. S. Brown
analytical standard, provides a complete and accurate pic-ture of nighttime nitrogen oxide chemistry. The instrument performance is demonstrated using data acquired during a re-cent field campaign in California.
1 Introduction
The nitrate radical, NO3and its reservoir species, dinitrogen pentoxide (N2O5) are important trace gases in the nocturnal atmosphere (Wayne et al., 1991). NO3is formed by reaction of ozone with NO2(Reaction R1), and reacts with NO2 to reversibly form N2O5(Reaction R2).
O3 +NO2 → NO3 +O2 (R1)
NO3 +NO2 N2O5 (R2)
These species are typically present at very modest levels dur-ing daytime (less than 1 pptv) because NO3undergoes rapid photolysis and reaction with NO, which is present during the day and in close proximity to large NOx emission sources during the night.
NO3+hυ → NO2+O → NO+O2
(R3)
NO3 +NO → 2 NO2 (R4)
The nitrate radical is a strong oxidant and is consumed by reactions with biogenic VOCs and sulfur compounds, and some classes of highly reactive anthropogenic VOCs (Atkinson, 1991). N2O5 undergoes heterogeneous uptake to aerosol. Its hydrolysis leads either to non-photochemical conversion of NOxto soluble nitrate via production of HNO3 (Jones and Seinfeld, 1983), or to activation of photola-bile halogens through formation of nitryl chloride, ClNO2 (Finlayson-Pitts et al., 1989; Thornton et al., 2010). Thus,
1228 N. L. Wagner et al.: Diode laser-based cavity ring-down instrument for NO3, N2O5, NO, NO2and O3 NO3 and N2O5 are intermediates in a number of
impor-tant atmospheric chemical transformations, and understand-ing their atmospheric concentrations is an important topic of current research.
Much of the prior database for understanding these pro-cesses was based on measurements of NO3 by differential optical absorption spectroscopy (DOAS) over a long, open path or by passive techniques using natural light sources (Platt et al., 1980; Solomon et al., 1989; Plane and Nien, 1992). Such measurements have been extremely useful in developing an understanding of the factors that govern night-time chemistry. In situ instruments add to this database by enabling measurements from mobile platforms, such as air-craft and ships (e.g., Brown et al., 2007a), and from tall tow-ers (e.g., Brown et al., 2007b). The in situ measurements are valuable for characterizing the strong vertical gradients characteristic of the nocturnal boundary layer or for measure-ments within the residual daytime boundary layer.
Cavity ring-down spectroscopy (CRDS) is a sensitive tech-nique for in situ measurement of atmospheric trace gases (Brown, 2003). In situ measurement of NO3was first devel-oped approximately a decade ago and was based on CRDS with either a pulsed dye laser (Brown et al., 2002) or ex-tended cavity diode laser (King et al., 2000). Thermal con-version of N2O5to NO3in a second channel enabled direct measurement of the sum of the two compounds and mea-surement of N2O5 itself by difference. This development ultimately led to the deployment of a CRDS instrument for NO3and N2O5on aircraft (Dub´e et al., 2006). Although the pulsed laser system used in this instrument had a relatively small footprint, such laser systems are in general somewhat cumbersome for field instruments because of their require-ments for power and weight (30 kg and 0.5 kW). In addition, the use of toxic dyes and solvents requires hazardous ma-terials that are not ideal for field environments, especially aircraft.
The aircraft instrument described above also incorporated measurements of NO2 by pulsed laser CRDS at 532 nm by taking advantage of the Nd:YAG laser second harmonic that was used to pump the dye laser (Osthoff et al., 2006). These NO2measurements required active subtraction of an interfer-ence from ozone, but were otherwise accurate (Fuchs et al., 2010). These CRDS NO2measurements have recently been further developed using a diode laser with a center wave-length near 405 nm (Fuchs et al., 2009). Because there is no significant interference from ozone at this wavelength, this approach is capable of simultaneous detection of NO via its conversion to NO2in excess ozone. We have also recently demonstrated the analogous conversion of O3to NO2in ex-cess NO (Washenfelder et al., 2011).
In this paper, we describe a single CRDS instrument based on diode lasers that measures NO3, N2O5, NO, NO2, and O3. Unlike the previous instruments from our group, this in-strument uses a diode laser near the maximum in the NO3 absorption spectrum at 662 nm for the measurement of NO3
and N2O5(Dub´e et al., 2006). This is advantageous in terms of size, weight, power consumption, and elimination of toxic dyes. The main disadvantage to this approach is its increased sensitivity to water vapor. Implications of the water vapor sensitivity for aircraft measurements are described further below. A second diode laser centered near 405 nm is used for detection of NO2by CRDS and of NO and O3by chemi-cal conversion to NO2. The NO2channel provides not only a direct measurement of this compound, but also a method for calibrating the NO3and N2O5measurements via the conver-sion of these compounds to NO2in excess NO as described by Fuchs et al. (2009). The NO2measurement is itself cal-ibrated against a standard based on ultraviolet absorption of ozone at 254 nm as described by Washenfelder et al. (2011), providing a common analytical standard for all five species measured by this instrument.
The combination of these five trace gases provides a com-plete picture of the nighttime chemistry shown in Reac-tions (R1)–(R4). Measurements of NO2 and O3 provide the source for NO3formation. Direct measurement of NO3 and N2O5allow for understanding of their chemistry in the nighttime atmosphere. Measurement of NO characterizes the most important nighttime sink for NO3in near source regions (e.g., low altitude over urban areas). This paper describes the design and operation of this instrument, and its deployment on aircraft.
2 Instrument description
CRDS is commonly used for sensitive detection of trace gases and has been described in several reviews (Busch and Busch, 1999; Brown, 2003; Atkinson, 2003). CRDS is a di-rect absorption spectroscopy in which the optical path length is enhanced by a high finesse cavity formed by a set of two highly reflective mirrors. A laser is directed into the cavity, the optical intensity builds in the cavity, and then the laser is turned off quickly compared with the decay of optical in-tensity in the cavity. The exponential decay of light inin-tensity from the cavity is monitored by measuring the light transmit-ted through the back mirror. When an absorber is present, the exponential decay time constant is reduced, providing an ab-solute measurement of optical extinction, as given in Eq. (1).
σ[A] = α = Rl c
1 τ −
1 τ0
(1) Here,σ is the absorption cross-section corresponding to the absorber, averaged under the spectrum of the laser, [A] is the concentration of the absorber,αis the optical extinction coefficient (units of inverse length),cis the speed of light,τ andτ0are the exponential decay constants with and without the absorber in the cavity andRlis the ratio of the total length of the cavity to the length over which the absorber is present. The instrument described here consists of two largely in-dependent parts that share a common set of electronics, data
N. L. Wagner et al.: Diode laser-based cavity ring-down instrument for NO3, N2O5, NO, NO2and O3 1229
28
850
851
Figure 1.
Instrument schematic. The upper part framed in red shows the NO
3and N
2O
5852
measurement. The lower part framed in blue shows the NO, NO
2and O
3measurement.
853
BS denotes a beamsplitter. A photo of the optical bench instrument is shown on the right.
854
855
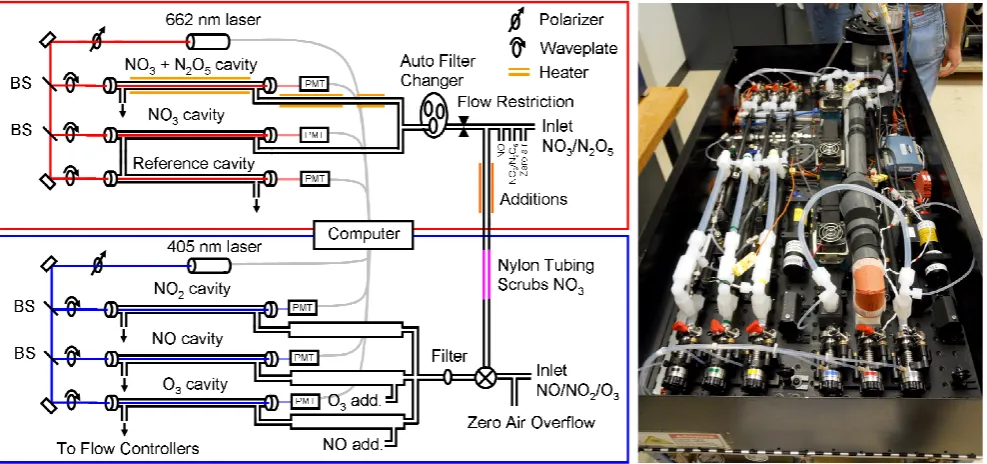
Fig. 1. Instrument schematic. The upper part framed in red shows the NO3and N2O5measurement. The lower part framed in blue shows
the NO, NO2and O3measurement. BS denotes a beamsplitter. A photo of the optical bench instrument is shown on the right.
acquisition, frame and optical mounting system. The first part is the measurement of NO3 and N2O5 using a 662 nm diode laser. The second is the measurement of NO2, NO, and O3using an additional 405 nm diode laser. The two parts of the instrument have separate inlets that are only connected together during automated calibrations, as described further below. A schematic of the instrument is shown in Fig. 1 with NO3/N2O5measurement framed in red and the NO/NO2/O3 measurement framed in blue. A photo of the instrument is shown in the right panel of Fig. 1.
2.1 NO3and N2O5measurement
Previous NO3and N2O5 instruments from our group were based on cavity ring-down spectroscopy using a pulsed dye laser and a Nd:YAG laser to pump the dye laser. Diode lasers, which are available at wavelengths near the 662 nm absorp-tion maximum of the nitrate radical, are a suitable alternative that are smaller, lighter, lower in power consumption and do not require hazardous material. Like pulsed dye lasers, com-mercially available Fabry-Perot diode lasers are spectrally broad enough to couple passively to the mode structure of the optical cavity (Fuchs et al., 2009). They are also spectrally narrow enough to provide a specific measurement for the ni-trate radical. Ayers et al. (2005) and Schuster et al. (2009) have already demonstrated the use of similar diode lasers for detection of NO3and N2O5. The instrument described here is similar to these instruments aside from two distinct differ-ences. First, our instrument uses an on-axis rather than an off-axis alignment to couple the laser to the optical cavity,
similar to our 405 nm NO2 detection scheme (Fuchs et al., 2009). Since the nominal 0.5 nm width of the diode laser spectrum overlaps more than 2000 longitudinal modes of the 93 cm cavities, it couples passively without active control of the laser spectrum or cavity modes. On-axis coupling also allows for a more compact (i.e., smaller diameter) sample cell, decreasing sample residence time and simplifying the optical alignment. Second, this instrument incorporates an automated calibration for NO3 and N2O5 against the NO2 channels.
Light is provided by a continuous wave (cw) diode laser (Power Technology Inc., Fabry-Perot diode model IQµ se-ries), with an output power of approximately 100 mW. The laser can be temperature tuned over a range of 15–33◦C, corresponding to center wavelengths 659.1–662.7 nm, al-though individual laser diodes typically vary in tuning range. Upon request, the manufacturer selected a diode with tun-ing range that includes the nitrate radical’s absorption peak near 662 nm. The laser spectrum is typically composed of between 2–4 modes of the laser cavity. Each mode is sepa-rated by∼0.4 nm and has a width of∼0.3 nm. The intensity in each mode is determined by the temperature of the laser diode. Certain temperatures give output spectra that are dom-inated by 1, or at most 2, of these 0.3 nm modes. A compact spectrometer (Ocean Optics USB4000) is used to monitor the laser spectrum. The diode temperature is set to maximize the spectral overlap with the nitrate radical’s absorption. The laser operates in cw mode and is modulated on and off by a 0–5 volt square wave input. The rise and fall time of the in-tensity is less than 30 ns, which is rapid on the time scale of
1230 N. L. Wagner et al.: Diode laser-based cavity ring-down instrument for NO3, N2O5, NO, NO2and O3 the intensity decay from the optical cavity. The laser is
op-tically isolated from the cavities in this on-axis alignment in order to prevent potentially damaging back reflections from entering the laser. The isolators consist of a single linear polarizer that is placed in front of the laser, and three sepa-rate quarter waveplates; one placed directly in front of each cavity. This design ensures that the polarization through the beamsplitters remains linear, so that the polarization sensi-tivity of the beamsplitters does not degrade the performance of the isolators.
The cavities consist of two 25 mm diameter, 1 m radius of curvature high-reflectivity dielectric mirrors. The mirrors are separated by 93 cm and mounted to an optical breadboard in a custom bellows mount that allows optical alignment and a flexible seal to the sample volume, from which the mir-rors themselves are isolated. The cleanliness of the mirmir-rors is maintained by a small purge flow, 25 sccm, of ultrapure air (zero air) over each mirror to separate the mirror surface from the sample flow. Light transmitted through the back mirror of the each cavity is collected by an optical fiber and detected on a photomultiplier tube (PMT) (Hamamatsu HC120-05M). A colored glass filter (Schott RG665) is used immediately before the PMT to reject stray light.
The ring-down traces are digitalized using 14-bit oscil-loscope card (National Instruments PCI-6132) at a rate of 2.5×10⁶samples s−1. A digital output of the oscilloscope card is used to modulate the laser intensity normally at 500 Hz, but this can be adjusted to increase the number of ring-down traces acquired or duration of each ring-down trace. The ring-down traces are transferred to a computer over the PCI bus and co-added in lots of 100. The number of ring-down traces in each lot can be adjusted to correspond with the laser modulation frequency and the desired measure-ment frequency. The co-added ring-down traces are then fit to a single exponential decay. The ring-down traces are fit us-ing the techniques described by Everest and Atkinson (2008). Usually, the digital Fourier transform method is used; how-ever the linear, LRS, and Levenberg-Marquardt methods are also available. When using the linear fitting method, the laser is turned off after every lot of 100 ring-down traces to mea-sure the zero level of the PMTs. During ambient sampling, only the fit parameters are saved and ring-down traces are discarded after fitting.
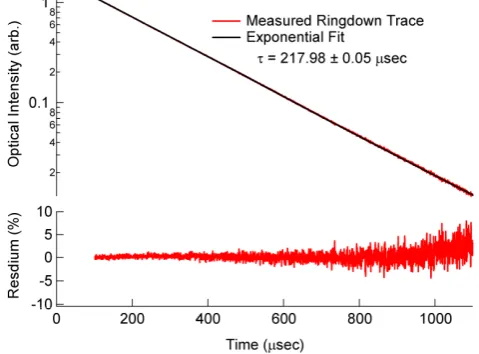
The upper panel of Fig. 2 shows a co-added ring-down trace acquired while sampling laboratory air at a cell pres-sure of 504.6 hPa. The 1/etime constant for this ring-down trace is 217.98±0.05 µs where the error is the covariance of the fit parameter. The time constant is determined by the combination of Rayleigh scattering losses, mirror re-flectivity, and cavity alignment. The mirror reflectivity is 99.999 %, or 10 ppm transmission. The lower panel in Fig. 2 shows the fit residual as a percentage of the ring-down trace. Higher reflectivity mirrors (Advanced Thin Films, Inc.) with R= 99.9995 % (5 ppm transmission) have also been used in this instrument and give a ring-down time constant in excess
29
856
857
Figure 2. Upper panel: Ring-down trace from one of the 662 nm cavities, along with the
858
fit to the ring-down trace. The lower panel shows the fit residual as a percentage of the
859
fit.
860
861
Fig. 2. Upper panel: ring-down trace from one of the 662 nm cav-ities, along with the fit to the ring-down trace. The lower panel shows the fit residual as a percentage of the fit.
of 400 µs at 500 hPa pressure. All of the performance char-acteristics described in this paper have been achieved with the lower reflectivity mirrors, which give a larger intensity throughput and allow a higher repetition rate. Instrument per-formance with the higher reflectivity mirrors is not substan-tially different. For the lower reflectivity mirrors, the laser is modulated at 500 Hz, and 0.2 s is needed to acquire 100 ring-down traces; thus the overall signal acquisition rate should be 5 Hz. However, due to overhead from transferring ring-down traces to the computer memory, fitting the ring-down traces, and auxiliary measurements, the actual data acquisition rate of the measurement is currently limited to 3 Hz.
The sampling and inlet configuration for NO3and N2O5 is equivalent to that described by Fuchs et al. (2008) and is described only briefly here. Because NO3and N2O5are re-active gases, the inlet is constructed from Teflon tubing and fittings. The shortest possible residence time is needed in or-der to minimize wall losses for NO3, which has been shown previously to have a first order loss with respect to reactions on Teflon inlet walls of approximately 0.2 s−1(Dub´e et al., 2006).
The inlet consists of several parts and is shown in Fig. 1. The first is a short length of 0.4 cm inner diameter tubing to bring ambient air from outside into the aircraft or instru-ment enclosure. Following this there are addition points for NO used to determine the instrument zero, zero air used to overflow the inlet, and NO3/N2O5additions for calibration. Next, a short length of 1.6 mm inner diameter tubing is used as a flow restriction to drop the pressure to approximately half of ambient. A Teflon membrane (Pall Corp. R2PJ047, 2 µm pore size, 25 µm thickness) is used in an automatic fil-ter changer describe by Dub´e, et al. (2006) to remove aerosol from the sample flow. After the filter, the flow is split and delivered to each of the two sample cells by 0.64 cm inner
N. L. Wagner et al.: Diode laser-based cavity ring-down instrument for NO3, N2O5, NO, NO2and O3 1231 diameter tubing. A 78 cm length of 0.79 cm inner diameter
tubing along the axis of each cavity creates the sample cell. Flows are set using flow controllers positioned downstream of the sample cells. One cell remains at ambient tempera-ture to measure the concentration of NO3. The sample gas in the other channel is heated to convert N2O5to NO3in order to detect the sum of NO3 and N2O5. For this channel the gas flow is heated in three stages that are designed to rapidly bring the gas to a temperature sufficient to thermally disso-ciate N2O5 and then to hold it at a temperature where the equilibrium in Reaction (R1) is shifted mainly toward NO3. For example, the conversion of N2O5 to NO3based on its equilibrium constant is greater than 98 % for ambient NO2 levels less than 10 ppbv at 75◦C. The first section is 0.64 cm inner diameter tubing, 40 cm long and held at 130◦C. The second is 25 cm long and held at 80◦C to reduce thermal
gradients and minimize flow noise in the sample cell which is held at 75◦C.
A third 662 nm channel is used to continuously monitor the optical extinction from species other than NO3, such as NO2, O3 and water vapor. It consists of an optical cavity and sample cell downstream of the NO3sample cell. NO is continuously added to this sample cell in the same manner as the instrument zeroing described below.
The total flow through the inlet is controlled at a con-stant volumetric flow rate that is adjusted for conditions of a particular measurement campaign. Typical flows for re-cent aircraft measurements described below were 15 and 9 LPM (liters per minute) for the NO3and NO3+ N2O5 sam-ple cells, respectively. As in our previously described in-strument, the zero for the NO3measurement is determined by adding a small amount of NO to the inlet. In an ex-cess of NO, NO3 is rapidly converted via Reaction (R4) (k= 2.6×10⁻¹¹cm3molecule−1at 298 K) into NO2, which has an absorption cross-section that is approximately 4×10⁴ times smaller than that of NO3at 662 nm. This zero method does not influence optical extinction due to ambient lev-els of O3, NO2or H2O and is therefore highly specific for NO3. A small flow of a 100 ppmv NO in N2 mixture is added to the inlet flow to produce an NO concentration of ∼1012molecules cm−3, designed to give>99.9 % conver-sion of NO3to NO2before the flow enters the axis of the NO3 measurement cell. The zero of the instrument is typically 5 s in duration and is measured at arbitrary intervals depending on requirements. During aircraft ascent and descent, when changes in pressure lead to rapid changes in background time constant due to Rayleigh scattering, the zero interval can be as short as once per minute. On level flight legs or for ground based measurements, a zero interval of 3–5 min is normally sufficient to track any changes inτ0due to cavity alignment or variable background absorbers.
2.2 NO, NO2, and O3measurement
Measurement of NO2is integral to the NO3and N2O5 cali-brations and measurements of inlet transmission. Measure-ment of NO2using a 405 nm diode laser improves its sensi-tivity compared to our previously described, 532 nm instru-ment (Osthoff et al., 2006; Fuchs et al., 2010), since the NO2 cross-section is approximately 4×larger at 405 nm. Further-more, the interference from ozone is essentially eliminated, since its absorption cross-section is approximately 4×10⁴ times smaller than that of NO2at 405 nm. Both NO and O3 can be measured by the same instrument via conversion to NO2; conversion of NO to NO2in excess ozone has been de-scribed previously by Fuchs et al. (2009), while conversion of O3to NO2in excess NO has been described by Washen-felder et al. (2011).
A second diode laser centered at 405 nm (Power Tech-nology Inc., Fabry-Perot diode model IQµseries) provides the light source for the CRDS detection of NO2. Unlike the 662 nm diode laser, this diode laser is not actively tempera-ture tuned and is held at a constant 20◦C. We have found the center wavelength to be stable over the lifetime of the laser by repeated checks against a calibrated grating spectrome-ter. The laser output power of 80 mW is divided into three equal parts using a 33 % beamsplitter and a 50 % beamsplit-ter. The three cavities are constructed in the same manner as the 662 nm cavities, except that a bandpass filter centered at 405 nm is used in front of the photomultiplier to reject stray light. The layout is shown schematically in Fig. 1.
The data acquisition for the 405 nm channels is done in the same way as for the 662 nm channels using a second os-cilloscope card to modulate the laser and acquire the ring-down ring-down traces. The 405 nm mirrors have a reflectivity of 99.9965 % (35 ppmv transmission) and give typical back-ground time constants of 40 µs at a pressure of 840 hPa. Be-cause the time constants on the 405 nm cavities are shorter than the 662 nm cavities, the laser is modulated at four times the frequency, or 2 kHz. Ring-down traces are acquired in lots of 400 and co-added to achieve the same overall data ac-quisition rate (3 Hz) as the 662 nm side of the instrument. It is not required that both the 662 nm channels and the 405 nm channels acquire the ring-down traces in lots corresponding to equal acquisition time but doing so maximizes the total number of ring-down traces collected.
The NO, NO2 and O3 sample cells have a separate in-let from the NO3/N2O5measurement, and the inlet is sim-pler because the 405 nm cavities are operated at ambient pressure and the measured species are less reactive. The inlet and sample cells are constructed with Teflon tubing and fittings. Ambient air is drawn in through a length of 0.4 cm inner diameter tubing to a 1 µm pore size Teflon filter (Pall Corp. R2PL047) in a commercial, PFA Teflon mount (Savillex). The smaller pore-size filter ensures rejection of smaller size aerosol to which the 405 nm channels may in principle be more sensitive. Loss of NO, NO2 and O3 on
1232 N. L. Wagner et al.: Diode laser-based cavity ring-down instrument for NO3, N2O5, NO, NO2and O3 these filters is negligible. There is no evidence for a signal
due to aerosol extinction on the downstream side of these filters during sampling of ambient air. Following the filter, the flow is split into three equal parts and delivered to the sample cells. Before entering each sample cell, there is a re-actor consisting of a 33 cm length of 0.95 cm inner diameter tubing. The flow rate through each channel is controlled at 2.7 LPM (volumetric) to maintain a residence time of 0.6 s (plug flow) within each reactor while sampling from vari-able external pressures from the aircraft. On the first channel which is used for the NO2measurement, the purpose of the reactor is only to match the residence time of all three chan-nels, so that NO2may be accurately subtracted from NOxor Ox, as described below.
The second channel measures total NOx via conversion of NO to NO2 in excess O3. A 12 sccm flow of 0.3 % ozone is added at the beginning of the reactor via a three way valve that allows switching of this ozone addition to a vent line. The ozone is generated by passing a flow of pure oxygen over a mercury-argon lamp (UVP 90-0004-01). The resulting ozone concentration in the sample cell is approxi-mately 4×10¹⁴(∼16 ppmv at 1 atmosphere and 298 K) and is measured periodically from the change in optical extinc-tion at 405 nm (∼6×10⁻⁹cm−1) upon switching the ozone flow into and out of the sample cell. This measurement is checked less frequently using a commercial ozone mon-itoring instrument. The background extinction due to this added ozone changes the ring-down time constant by ap-proximately 0.25 µs from its nominal value of 40 µs at at-mospheric pressure (1013 hPa). The presence of this large excess ozone converts NO quantitatively to NO2 via Reac-tion (R5).
O3+NO → NO2 +O2 (R5)
k298 = 1.9 ×10⁻¹⁴cm−3molecule−1s−1
Conversion of NO to NO2under these reactor conditions is greater than 99 %. A small correction of 1–2 % is required to account for the further oxidation of NO2to higher oxides of nitrogen, NO3 and N2O5, via Reactions (R1) and (R2) (Fuchs et al., 2009). The measured NOxconcentration is also corrected for the small dilution (∼0.5 %) due to the addition of the O3/O2flow.
The third channel measures total odd oxygen, Ox= NO2+ O3, via the analogous conversion of O3 to NO2 in excess NO. A small flow of NO from a standard mixture of NO in N2 (Scott-Marin) is added at the beginning of the reactor to produce an excess concentration of NO iden-tical to the excess O3 concentration in the NOx channel (i.e. 4×10¹⁴molecules cm−3). The excess NO quantita-tively (greater than 99 %) converts O3in the ambient sam-ple flow to NO2 via Reaction (R5). There is no need for an additional correction for further oxidation of NO2on this channel since Reactions (R1)–(R2), to the small extent that
they might occur without large, excess O3, are effectively re-versed by reaction of NO3with the excess NO (Reaction R4). The excess NO added to this channel does contain an un-avoidable contamination of NO2, which can produce a large background signal. An FeSO4converter on the outlet of the standard cylinder reduces this NO2contamination consider-ably to a background level of 0.5–2 ppbv within the sample cell (Washenfelder et al., 2011).
Maintaining a constant conversion efficiency of O3 and NO to NO2 is a potential challenge for sampling from an aircraft platform since the ambient pressure (and hence the reactant concentration and reactor residence time) is variable with aircraft altitude. Flows on all three 405 nm channels are controlled at constant volumetric rates, rather than constant mass flow rates, to maintain constant residence time and re-actant number density in each reactor. Addition of a constant, mass flow of the excess reactant with a well-defined mix-ing ratio to the variable, volumetric flow produces a constant number density in each reactor as the aircraft ascends and descends. For example, the number density of NO in the Ox sample cell is the product of mixing ratio of the NO standard cylinder (MR), the total number density in the sample cell (Nd) and the ratio of the volumetric flows (FNOvolandFcellvol) as shown in Eq. (2). Here,P is the pressure in the sample cell, P0is the standard pressure,kis Boltzmann’s constant,T is the sample cell temperature, andFNOSTDis the volumetric flow of the reactant at standard pressure and temperature which is directly proportional to the mass flow and independent of pressure.
[NO] = MR×Nd×
FNOvol
Fcellvol (2)
= MR × P kT ×
FNOSTD(P0/P )
Fcellvol
Because the flow through the sample cell is maintained at a constant volumetric rate, the only pressure dependences in Eq. (2) are the number density and the reactant volumetric flow, and they cancel each other. The result is a reactant number density that is independent of pressure. Thus, the conversion efficiencies outlined above do not vary with air-craft altitude.
The current scheme for acquiring a zero time constant for the 405 nm channels is identical to that used previously with our 532 nm CRDS NO2instrument, namely to slightly over-flow the inlet with zero air. The overover-flow is added through a concentric piece of Teflon tubing with an inner diameter slightly larger than the outer diameter of the inlet tubing and which extends slightly (2–4 cm) beyond the inlet tubing. Ad-dition through this concentric inlet minimizes the pressure difference between the zero and signal measurements, which can be significant (1 hPa or greater) if the zero air overflow is added through a simple tee fitting. Such pressure differ-ences between the zero and sample measurement change the
N. L. Wagner et al.: Diode laser-based cavity ring-down instrument for NO3, N2O5, NO, NO2and O3 1233 Rayleigh scattering background, which must be corrected for
after the measurement. An additional correction is needed to account for the difference in humidity between ambient air and the dry zero air used to overflow the inlet. The differ-ence in the Rayleigh scattering cross-section of water vapor and air was measured at 405 nm by Fuchs et al. (2009) to be 5×10⁻²⁷cm2, leading to a maximum correction equiv-alent to 0.15 ppbv NO2 at 80 % RH (22◦C) . Actual water vapor corrections are typically smaller, however. The poten-tial for an NO2impurity in the zero air limits the applicabil-ity of this zero scheme for sampling in remote environments, where ambient NOxmay be comparable to the NOximpurity in commercial zero air. Chemiluminescence measurements at our laboratory have found the zero air (Scott-Marin Ultra-zero) to have less than 10 pptv of NOx. Zero measurements occurred every 3 min during ambient sampling and lasted 15 s to allow for the zero air to completely fill the sample cell.
The optical extinction due to excess O3on the NOx chan-nel, and the NO2impurity in the added NO on the Ox chan-nel, are not affected by the addition of zero air to the inlet. Thus, no correction is required for these small, background optical extinctions.
3 Calibrations
Although cavity ring-down spectroscopy is, in principle, an absolute method, calibrations are required if either the inlet transmission efficiency for a particular trace gas is not unity, or if the effective absorption cross-section can vary as a func-tion of sampling condifunc-tions (i.e., temperature, pressure, laser spectrum). The former is the case for NO3and N2O5, which are reactive trace gases whose transmission through the inlet system may vary. The latter is potentially the case for NO2 (and by extension, NO and O3 in this instrument) since its absorption cross-section varies with pressure, temperature, and laser spectrum. We have recently developed calibration standards for NO3 and N2O5 based on their conversion to NO2(Fuchs et al., 2008) and for NO2based on conversion of standard additions of O3, as described above (Washenfelder et al., 2011). The following sections outline these calibration schemes and their implementation in the current version of this aircraft instrument.
3.1 NO2calibration
The 405 nm laser diodes provided by the manufacturer vary in center wavelength; hence, the effective cross-section for each laser must be calibrated by standard NO2 additions. Standard concentrations of O3are generated and measured using a commercial ozone monitor, then quantitatively con-verted to NO2, which is measured on the CRDS instrument, as described above. The calibrator contains its own NO cylinder and flow controllers for conversion of O3 to NO2
30
862
863
Figure 3
.
Pressure dependence of the effective NO
2cross-section at 405 nm. The
864
pressure-dependent cross-section is parameterized by 2
ndorder polynomial and used for
865
calculating NO
2concentration during aircraft sampling at variable altitudes and cell
866
pressures. The pressure dependence may be due to the variation in the NO
2cross section
867
itself, or to pressure dependence in R
lfrom Eq (1). Here, the cross section is fit to a
868
pressure dependence assuming constant R
lof 1.15, though this choice is arbitrary.
869
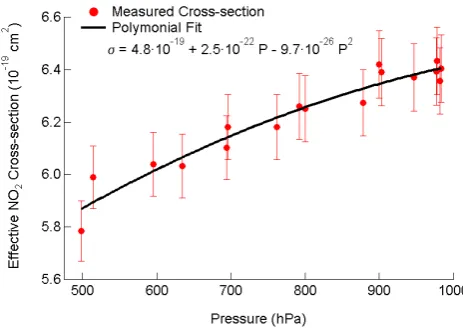
Fig. 3. Pressure dependence of the effective NO2cross-section at 405 nm. The pressure-dependent cross-section is parameterized by 2nd order polynomial and used for calculating NO2concentration during aircraft sampling at variable altitudes and cell pressures. The pressure dependence may be due to the variation in the NO2cross
section itself, or to pressure dependence inRlfrom Eq. (1). Here,
the cross section is fit to a pressure dependence assuming constant Rlof 1.15, though this choice is arbitrary.
such that it delivers standard additions of NO2independent from the CRDS instrument itself. The calibrator is also field portable and can be used for routine calibration on a daily basis. Typical calibration curves use a series of NO2 mix-ing ratios between 0–200 ppbv, with the effective NO2 cross-section determined as the slope of a plot of measured optical extinction against NO2 concentration. The effective cross-section is the NO2 cross-section integrated under the laser spectrum and divided by Rl, which is ratio of the cavity length to the length over which the absorber is present.
The cell pressure in the 405 nm channels varies signifi-cantly with altitude, typically between 500–900 hPa over the altitude range of the NOAA WP-3 aircraft and is typically 80–100 hPa below ambient pressure. Therefore, any pressure dependence in the effective cross-section for NO2, or in the ratio of the cross section toRlin Eq. (1), will directly affect the measurement from aircraft. Literature spectra for NO2 do indeed show a pressure dependence (e.g. Vandaele et al., 1998), but only for spectral features too fine to be resolved by the laser system in the CRDS instrument. Nevertheless, the ratio of the effective NO2absorption cross-section toRl, i.e.,σ/Rl, shows a distinct pressure dependence, as shown in Fig. 3. The value ofσ/Rl decreases by approximately 6 % between 1000–500 hPa. The calibration curve in Fig. 3 is the result of multiple determinations in the field on differ-ent days, which were reproducible at any given pressure to within±2 %. For the purpose of calculating the NO2 con-centration, the cross-section is parameterized by a 2nd order polynomial. The measured pressure dependence of the ef-fective cross-section may be due to a variation of the actual cross-section or a pressure dependence ofRl. Regardless of
1234 N. L. Wagner et al.: Diode laser-based cavity ring-down instrument for NO3, N2O5, NO, NO2and O3
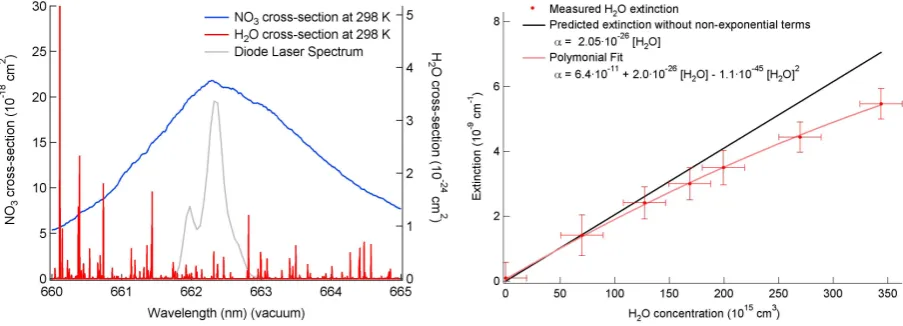
Fig. 4. The right panel shows the NO3(blue) and water vapor (red) absorption spectrum around 662 nm. A typical laser spectrum is also
shown. The left panel shows the measured water sensitivity along with predicted sensitivity neglecting the non-exponential terms. The measured sensitivity is fit to a 2nd order polynomial and used to correct the field data.
the source of the pressure dependence, the effective cross-section is still valid for determination of the NO2 concentra-tion.
3.2 NO3cross-section and water vapor sensitivity
The cross-section for NO3is determined using the absorp-tion spectrum measured by Yokelson et al. (1994) shown in Fig. 4 and temperature-dependence determined by Osthoff et al. (2007). Although the absorption spectrum peaks at 2.17×10⁻¹⁷cm2 for 298 K, the effective cross-section in this instrument is a convolution of the measured cross-section and the laser spectrum and is therefore smaller than the peak absorption. Using a typical laser spectrum shown Fig. 4, the effective cross-section was 2.03×10⁻¹⁷cm2, a reduction of 7 %. One drawback of 662 nm diode laser used in this in-strument is that the intensity in different modes, and thus its spectral output, is not stable on the time scale of hours. Based on several measured laser spectra, this instability leads to a variation of 1.5 % in the effective NO3 cross-section. The cross-sections measured by Yokelson et al. (1994) and Osthoff et al. (2007) are accurate to±4 %. In this instru-ment the variability of spectrum increases the inaccuracy of the effective cross-section to±6 %. The laser spectrum is currently measured infrequently (e.g., once per flight) using a small grating spectrometer (Ocean Optics, USB4000) but will be incorporated into routine data acquisition in the fu-ture. The NO3 cross-section is temperature dependent, as described previously, such that the effective cross-section for the heated channel is 1.68×10⁻¹⁷cm2molecule−1at 348 K. Water vapor has an absorption in the 662 nm region of the spectrum. The potential for water vapor interference with NO3 measurements is well known from broadband optical measurements of NO3(e.g. Langridge et al., 2008; Solomon et al., 1989). The water vapor spectrum at 20◦C from the
HITRAN database (Rothman et al., 2009) is shown in red on Fig. 4 along with the nitrate radical absorption spectrum (blue) and typical diode laser spectrum (gray). Our previous, pulsed dye laser instrument had a narrow bandwidth which effectively resolved this water vapor spectrum, and could be tuned off resonance with the discrete water vapor lines while still being tuned effectively to the maximum in the NO3 absorption spectrum. The output of the diode laser, by con-trast, unavoidably overlaps multiple water vapor lines, mak-ing the instrument much more sensitive to this interference. Furthermore, because the water vapor absorption spectrum consists of several peaks under the laser bandwidth, the vari-ation in absorption cross-section can lead to non-exponential ring-down traces.
The measured sensitivity to water vapor is shown in Fig. 4 (right panel). The extinction is not linear with respect to wa-ter concentration because the ring-down transients become slightly non-exponential at higher optical extinctions because of the mismatch between the discrete, water vapor lines and the broadband laser source (Zalicki and Zare, 1995). How-ever, the data can be corrected by using the fitted polyno-mial as an effective concentration-dependent cross-section as shown in Eq. (3).
τcorrected = 1
τ +
f ([H2O]) c
Rl
−1
(3) τcorrectedis the exponential decay time constant that would be measured in the absence of water vapor. τ is the measured exponential decay constant. f ([H2O])is the fitted polyno-mial sensitivity and requires an independent measurement of the water vapor mixing ratio. The linear term in the poly-nomial fit corresponds to the water vapor cross-section when averaged over the laser spectrum and agrees well with the value calculated using the water vapor cross-section obtained from the HITRAN database, 2.05×10⁻²⁶cm2. This linear
N. L. Wagner et al.: Diode laser-based cavity ring-down instrument for NO3, N2O5, NO, NO2and O3 1235
32
879
880
Figure 5. Example calibration sequences for (A) N
2O
5and (B) NO
3. For the N
2O
5881
calibration, the N
2O
5source is added directly to the inlet, while for the NO
3calibration it
882
first passes through a heater to convert it primarily to NO
3. The sequence of the
883
calibration, indicated by the numbers across the top, includes 1) zero measurement; 2)
884
addition of N
2O
5/ NO
3source; 3) titration of the NO
3/ N
2O
5source with excess NO to
885
convert it to 2
×
NO
2; 4) N
2O
5/ NO
3source switched off, NO titration on to determine
886
NO
2content of the added NO; and 5) NO titration turned off. The calibration is given by
887
Eq. (4) and is effectively the ratio of 2
∆
(N
2O
5)/
∆
NO
2(or 2
∆
NO
3/
∆
NO
2) marked in the
888
figure, where
∆
NO
2is corrected for the small additional NO
2in the added NO source
889
given by the difference between (4) and (5) in the sequence above. For the data shown in
890
the figure, the N
2O
5transmission is 99%. The NO
3calibrations factors are shown for the
891
ambient channel (NO
3A) and the heated channel (NO
3B), and are 87% and 85%,
892
respectively.
893
894
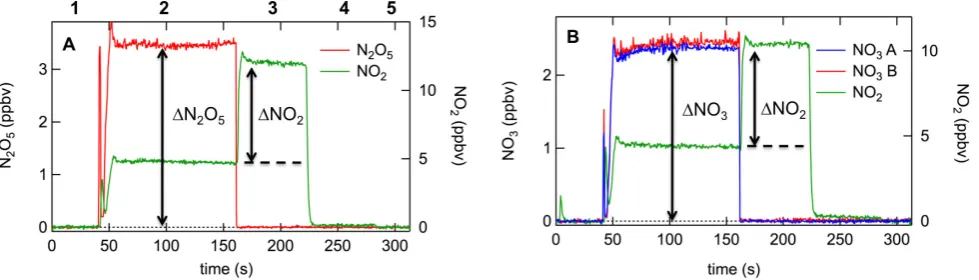
Fig. 5. Example calibration sequences for (A) N2O5and (B) NO3. For the N2O5calibration, the N2O5source is added directly to the inlet,
while for the NO3calibration it first passes through a heater to convert it primarily to NO3. The sequence of the calibration, indicated by the
numbers across the top, includes (1) zero measurement; (2) addition of N2O5/NO3source; (3) titration of the NO3/N2O5source with excess
NO to convert it to 2×NO2; (4) N2O5/NO3source switched off, NO titration on to determine NO2content of the added NO; and (5) NO
titration turned off. The calibration is given by Eq. (4) and is effectively the ratio of 21(N2O5)/1NO2(or 21NO3/1NO2) marked in the
figure, where1NO2is corrected for the small additional NO2in the added NO source given by the difference between Eqs. (4) and (5) in the
sequence above. For the data shown in the figure, the N2O5transmission is 99 %. The NO3calibrations factors are shown for the ambient channel – NO3, (A) – and the heated channel – NO3(B), and are 87 % and 85 %, respectively.
absorption is insensitive to the presence of added NO, and will therefore only interfere with the measurement of NO3 and N2O5 if the water vapor mixing ratio changes rapidly on the time scale of the instrument zero frequency. Such variations can, in principle, be corrected by the reference channel (see above), though in practice the active correc-tion described here proved as useful as a reference chan-nel. For ground based measurements, simple interpolation between zeros would normally be sufficient. However, for aircraft sampling, which may rapidly traverse regions of higher or lower absolute humidity (e.g., on vertical profiles), the interferences must be actively corrected via Eq. (3). A worst-case change in relative humidity of 0 to 100 %, or 3.5×1017cm−3 (2.9 % mixing ratio at 20◦C and 505 hPa in the sample cells), would result in an additional extinction of 7×10⁻⁹cm−1, or the equivalent of 30 pptv of NO3/N2O5. In practice, we have never observed variations in background extinction that are this extreme; however active correction re-mains a necessity.
When the water vapor concentration is approximately con-stant between the zero and the signal measurement, there is an additional, small error due to fitting the slightly non-exponential ring-down transients in the presence of water va-por as though they were single exponentials to retrieve con-centrations of NO3or N2O5. This effect produces a measure-ment error of less than 0.2 % for either compound.
Although much smaller, both NO2 and NO3 have some variation in the cross-section under the laser spectrum like water vapor. We have not observed non-exponential ring-downs from either NO2or NO3. For NO2 the exponential character of the ring-down trace is further confirmed by the linear extinction as a function of the NO2concentration dur-ing calibrations.
3.3 NO3and N2O5inlet transmission
Wall loss of NO3 on the Teflon surfaces of the inlet and measurement cells is the most significant source of uncer-tainty for CRDS measurement of NO3 and N2O5 (Dub´e et al., 2006). Characterization of the NO3and N2O5 transmis-sion efficiency has been described by Fuchs et al. (2008). The following provides a short description of the method and the changes that are specific to the current instrument design. The calibration scheme for NO3is based on its chemical con-version to NO2with excess NO by Reaction (R4), the same as used for zeroing the 662 nm channels. The resulting NO2 has negligible inlet loss and can be measured by CRDS at 405 nm to provide a standard for the 662 nm NO3 measure-ment. N2O5 transmission efficiency can be measured simi-larly by chemical and thermal conversion of N2O5to NO2. During transmission efficiency measurement the inlet is over-flowed with zero air to avoid interference from ambient O3 and NO.
Each measurement of NO3transmission efficiency has five steps shown in Fig. 5. First, the zero of the instrument is mea-sured as discussed above. Second, the NO3source is added to the tip of the NO3/N2O5inlet and the mixing ratio NO3is measured in 662 nm channels. The amount of NO2coming from the source directly is measured in the NO2channel. As described above, for ambient sampling, the inlet for the NO2, NOxand Oxchannels is separate from the NO3and N2O5 in-let; however, during the transmission measurements the NO2 channel must be connected to the NO3/N2O5inlet. This con-nection is made via the three-way valve shown in Fig. 1, which switches the instrument between sampling and cali-bration mode. Unlike the previously described pulsed laser instrument, in which the NO3and NO2measurements were
1236 N. L. Wagner et al.: Diode laser-based cavity ring-down instrument for NO3, N2O5, NO, NO2and O3 in series, they are in parallel in this instrument, such that
measurements of NO3 or N2O5 occur simultaneously with that of NO2. The third step of the transmission efficiency measurement is to add NO3 and NO simultaneously to the NO3/N2O5inlet. The reaction of NO3and NO quantitatively converts NO3into NO2producing two molecules of NO2for each molecule of NO3 added to the inlet. During this step the NO2 channel measures NO2 from three sources: NO2 coming directly from the N2O5calibration source, NO2 pro-duced by the reaction of NO3and NO, and the NO2impurity present in the NO addition. The fourth step is to shut off the NO3/N2O5addition from the calibration source, but leave the NO flow present to measure the NO2impurity present in this NO. The fourth step accounts for this contamination. The fifth step is a second zero measurement, with no addition of either NO or NO3/N2O5.
The N2O5 transmission efficiency can be measured by a similar five step procedure with the addition of N2O5to the inlet instead of NO3; however, during the third step a heater is used to convert the N2O5into NO3which is then converted to NO2by reaction with NO. This heater is along the connec-tion between the NO3/N2O5 inlet and the NO2sample cell and is followed by a short section of nylon tubing which acts as an NO3scrubber, as described in Fuchs et al. (2008). In this configuration, the scrubber serves to remove NO3from the flow produced by thermal decomposition of N2O5when the NO addition is off during step 2, so that the NO2 chan-nel measures only the NO2arising from thermal dissociation of N2O5and not any optical extinction from NO3. It also prevents recombination of NO3 with NO2in the NO2 sam-ple cell. (Both the heater and scrubber are necessary for the NO3transmission measurement as well, because our source can not produce pure NO3. It is unavoidably contaminated with N2O5.) During addition of NO, all NO3produced in the heater between the inlet and the NO2sample cell is converted to 2×NO2, which is not affected by the scrubber.
Calibration samples of N2O5 or NO3 are generated by passing a small flow of zero air over a sample of solid N2O5 stored in a trap at−78◦C (dry ice). The source produces N2O5with less than 2 % NO3or, if switched through an ad-ditional heater mounted in the calibration box, greater than 90 % NO3.
The transmission efficiency can be calculated using the measurements taken during each of the five steps. Equa-tion (4) then gives the expression for the transmission effi-ciency as the ratio between measured NO3during step 2 in the 662 nm channel and 1/2 the NO2generated from the con-version in Reaction (R4).
Te =
2 × [NO3]
[NO2]source+NO − [NO2]source − [NO2]NO
(4)
Here, [NO2]source+NO is the NO2 concentration when both the NO3 and NO are added to the inlet during step 3, and [NO2]sourceand [NO2]NO are the NO2concentrations when
the NO3 and NO are added to the inlet separately, during steps 2 and 4 respectively.
To relate ambient concentrations with those measured in the sample cells, three separate transmission efficiencies are required: (1) the transmission of N2O5 through the heated inlet,Te (N2O5), which is the combination of the transmis-sion efficiency for N2O5 itself, the conversion efficiency to NO3, and the transmission of NO3through the heated inlet; (2) the transmission of NO3 through the ambient channel,
Teambient(NO3); and (3) the transmission of NO3through the heated channel,Teheated (NO3) (Dub´e et al., 2006; Fuchs et al., 2008). For the NO3channel only the inlet transmission of NO3is needed to determine the ambient NO3 concentra-tion, Eq. (5). However, because N2O5is converted to NO3 in the inlet and consequently lost to the walls, the inlet trans-mission of both NO3 and N2O5 is needed to calculate the ambient N2O5concentration, Eq. (6).
[NO3]amb =
[NO3]cell
Tambient e (NO3)
(5)
[N2O5]amb =
([NO3] +[N2O5])cell−Teheated(NO3)[NO3]amb
Te(N2O5)
(6) [NO3]amband [N2O5]amb are the ambient concentration of NO3 and N2O5. [NO3]cell and ([NO3] + [N2O5])cell are the concentrations measured in the sample cells.
Figure 5 illustrates the scheme for an example calibration. Panel a shows the N2O5 transmission measurement, while panel b shows the NO3transmission measurements in both the ambient and heated measurement cells, which is done simultaneously by addition of NO3to both channels. In field calibrations during CalNex showed no dependence of NO3 transmission efficiency on NO3mixing ratio over the range 0.3–4.3 ppbv, although calibrations on any given day were normally performed at a single concentration.
4 Detection limits, accuracy, and sample data
Figure 6 shows a representative measurement of the NO3and N2O5instrument baseline precision in our laboratory while sampling zero air. The Allan variance plot gives a detection limit under∼1 pptv (2σ) in 1 s for both species. For NO3, this sensitivity is comparable to, but slightly worse than that reported by Dub´e et al. (2006) (e.g., 0.5 pptv, 1 s, 2σ) using the Nd:YAG/dye laser instrument. For N2O5, the sensitiv-ity is slightly improved over the pulsed laser version (e.g., 2 pptv, 1 s, 2σ), although the improvement derives more from reduction in the optical noise associated with the fast flow in the heated channel than with any change in the op-tical system itself. The reduction in precision compared to the previously reported, pulsed laser instrument is due to a combination of factors, including reduced performance from the composite optical bench and cavity ring-down mirrors experience during the CalNex field intensive, and is not due
N. L. Wagner et al.: Diode laser-based cavity ring-down instrument for NO3, N2O5, NO, NO2and O3 1237 33 Figure 6 895 6 8 0.1 2 4 6 8 1 A lla n D e v . 2 σ ( p p tv )
1 10 100
Integration time (s) -4 -2 0 2 4 N O3 ( p p tv ) 2000 1500 1000 500 0
Elapsed Time (s)
1.4 pptv in 0.34 sec 0.82 pptv in 1 sec
A 6 8 0.1 2 4 6 8 1 A lla n D e v . 2 σ ( p p tv )
1 10 100
Integration time (s) -4 -2 0 2 4 N2 O5 ( p p tv ) 2000 1500 1000 500 0
Elapsed time (s)
1.6 pptv in 0.34 sec
0.99 pptv in 1 sec
B
896
Figure 6. Allan variance plots for the NO3 (upper) and N2O5 (lower) measurements when
897
sampling synthetic zero air. Both channels have a 2σ precision better than 1 pptv in 1 s. 898
33
Figure 6
895
6 8 0.1 2 4 6 8 1 A lla n D e v . 2 σ ( p p tv )1 10 100
Integration time (s) -4 -2 0 2 4 N O3 ( p p tv ) 2000 1500 1000 500 0
Elapsed Time (s)
1.4 pptv in 0.34 sec 0.82 pptv in 1 sec
A 6 8 0.1 2 4 6 8 1 A lla n D e v . 2 σ ( p p tv )
1 10 100
Integration time (s) -4 -2 0 2 4 N2 O5 ( p p tv ) 2000 1500 1000 500 0
Elapsed time (s)
1.6 pptv in 0.34 sec
0.99 pptv in 1 sec
B
896
Figure 6. Allan variance plots for the NO
3(upper) and N
2O
5(lower) measurements when
897
sampling synthetic zero air. Both channels have a 2
σ
precision better than 1 pptv in 1 s.
898
Fig. 6. Allan variance plots for the NO3(upper) and N2O5(lower) measurements when sampling synthetic zero air. Both channels have a
2σprecision better than 1 pptv in 1 s.
solely to the introduction of diode lasers. Due to environ-mental effects (e.g. vibrations on the aircraft) and variations in the ambient air (e.g. temperature gradients), the precision of the instrument is reduced while sampling ambient air in flight. The in-flight detection limits are determined from day-time measurements during CalNex when the ambient mixing ratios of both NO3and N2O5were below the laboratory de-tection limits and were 3 pptv (2σ) in 1 s for both NO3and N2O5.
The laboratory detection limits for the NO2and O3 mea-surements have been reported in a separate publications (Washenfelder et al., 2011) and are 46 pptv and 56 pptv (1 s, 2σ) respectively. Our previously reported, ground based NOx instrument (Fuchs et al., 2009) exhibits a better pre-cision of 22 pptv (2σ, 1 s). In-flight baseline precision can be determined during zero measurements, which are 10–15 s in duration. For NO, NO2, and O3the in-flight detection lim-its were 140 pptv, 90 pptv, and 120 pptv, respectively. These detection limits are the average precision of 140 zero mea-surements from an 8 h flight on 3 June 2010. During some time periods, the aircraft measurements of NO, NO2and O3 also suffer from an optical instability in flight that leads to drifts on the order of 0.1–0.3 ppbv in flight. The longer-term baseline instability is most likely related to the mechanical stability of the optical cavity alignments on these channels. Investigation into the source of this instability and potential solutions is ongoing, although it could be addressed by sim-ply increasing the frequency of zero measurements from the current 5 min interval. We anticipate improvements, primar-ily in the data acquisition software, to improve the precision of the NOxand O3channels on the aircraft instrument.
The accuracy of the NO3and N2O5measurements were described in detail by Fuchs et al. (2008), are unchanged by modifications described here. The N2O5 accuracy ranges from−8 % to +11 % (1σ). The major uncertainties
contributing to the accuracy are uncertainty in the cross-section,Rl, inlet loss and filter aging. Because the filter aging can only decrease the measured mixing ratios, it only con-tributes to the upper limit of the accuracy. The same factors contribute to the accuracy of the NO3measurement (−9 %, +12 %, 1σ). However, the inlet loss of NO3is more uncer-tain leading to a decreased accuracy compared with N2O5.
For measurements of NO, NO2 and O3, the accuracy is dominated by uncertainty of the effective cross-section which is directly related to the ±2 % accuracy of the UV ozone monitor used to measure the cross-section as describe in section 3.1. There is additional uncertainty (±1 %) in the dilution associated with the NO addition required to convert the O3to NO2. The total accuracy for each of three measure-ments is±3 % (1σ).
This aircraft instrument was deployed during the CalNex campaign in California on the NOAA WP-3 aircraft and took measurements on 25 research flights. An example of the per-formance and utility of this instrument is shown in Fig. 7, which shows data from a flight in the Los Angeles basin on 3 June 2010. The flight track is shown on the left panel of the figure. This flight includes a series of vertical pro-files over the ocean and the urban area of the Los Angeles basin. The flight began in late evening and landed 2 hours after sunrise. The second panel shows the measured NO3 and N2O5 concentrations during the flight along with alti-tude. The yellow background indicates the solar elevation angle and time of sunrise. The mixing ratios of NO3 and N2O5vary strongly with altitude, consistent with the previ-ous measurements of vertical stratification within the night-time atmosphere (Brown et al., 2007a).
The NO, NO2and O3data for the same flight are shown in the left panels of Fig. 8. Very little NO was encountered dur-ing darkness on this flight since the majority of the sampled air masses were distant from direct NOxemission sources.
1238 N. L. Wagner et al.: Diode laser-based cavity ring-down instrument for NO3, N2O5, NO, NO2and O3
Fig. 7. Sample NO3and N2O5data from the flight on 3 June 2010. The left panel shows the flight track in the Los Angeles basin. The right panel shows the NO3(blue) and N2O5(red) mixing ratios measured during the flight along with the aircraft altitude in gray. The yellow
background indicates the time of sunrise.
35 905
906
Figure 8. The left panels show sample NO (upper panels), NO2 (middle panels) and O3
907
(lower panels) mixing ratio from both the CRDS instrument in red and the 908
chemiluminescence (CL) measurements in blue for the June 3rd flight. The right panels 909
show the correlations of the two measurements for each species. There was a small 910
population of points on this flight for which there was a deviation on the NO2
911
measurement, likely related to the zero measurement on one or the other instruments. 912
These deviations were not observed on other CalNex flights. 913
Fig. 8. The left panels show sample NO (upper panels), NO2
(mid-dle panels) and O3(lower panels) mixing ratio from both the CRDS
instrument in red and the chemiluminescence (CL) measurements in blue for the 3 June flight. The right panels show the correlations of the two measurements for each species. There was a small pop-ulation of points on this flight for which there was a deviation on the NO2measurement, likely related to the zero measurement on
one or the other instruments. These deviations were not observed on other CalNex flights.
Several NO2plumes were encountered throughout the night, many of which showed distinct anticorrelations with O3due to titration and subsequent nighttime chemistry within these plumes. After sunrise, the NOx containing plumes showed
measurable levels of NO, which peaked near 30 ppbv during landing at Ontario airport.
The standard P-3 instrument for measurement of ambi-ent NO, NO2and O3 is a custom-built, high-precision, re-search grade chemiluminescence (CL) instrument (Ryerson et al., 1999, 2000, 2003). The NO2channel of the CL instru-ment has recently undergone substantial improveinstru-ment to the photolysis system for conversion of NO2 to NO and mod-ifications of inlet and sample flow path for improved time response of all channels (Pollack et al., 2011). The right three panels of Fig. 8 show the scatter plots comparing NO, NO2, and O3measurements from the 405 nm CRDS instru-ment with those from the CL instruinstru-ment at 1 s time resolu-tion. The instruments agree to within 3 % for NO, 5 % for NO2, and 1 % for O3 measurements, which is within the summed accuracy of both instruments for each species. Cor-relation among all measurements was excellent, withR2 val-ues ≥0.99. Much of the scatter in the correlation plots is the result of synchronization between the instruments when transecting NOxplumes with sharp edges. Although CRDS is lower in precision than the CL instrument and is subject to some baseline instability as described above, the compar-isons in Fig. 8 demonstrate that it is accurate, at least at larger NOxand O3values.
One common diagnostic used to understand the nighttime reactivity of NO3and N2O5is their steady state atmospheric lifetime (Platt et al., 1984). The steady state lifetime of a species can be determined from its rate of production and its concentration, defined in Eqs. (7) and (8) for NO3 and N2O5(Brown et al., 2003).
τSS(NO3) =
[NO3]
k1[O3] [NO2]
≈ kNO3 +kN2O5Keq[NO2]
−1 (7)
τSS(N2O5) =
[N2O5]
k1[O3] [NO2] ≈
kN2O5 +
kNO3
Keq[NO2]
−1
(8) HereτSS(NO3) andτSS(N2O5) are the steady state lifetimes andk1is the rate constant for Reaction (R1). When the steady
N. L. Wagner et al.: Diode laser-based cavity ring-down instrument for NO3, N2O5, NO, NO2and O3 1239
36
914
915
Figure 9
.
The lifetimes of NO
3(blue) and N
2O
5(red) for the June 3
rdflight. The
916
lifetimes were calculated using concentrations measured by a single instrument.
917
Fig. 9. The lifetimes of NO3(blue) and N2O5(red) for the 3 June
flight. The lifetimes were calculated using concentrations measured by a single instrument.
state approximation is valid the lifetimes can be used to deter-mine the pseudo first-order loss rate of NO3and N2O5,kNO3 andkN2O5.Keqis the equilibrium constant for Reaction (R2). In past field campaigns, this analysis would require data from at least two separate instruments. Figure 8 demonstrates the advantage of the combined measurements of nighttime ni-trogen oxides (NO2, NO3 and N2O5) and O3 into a single instrument. Figure 9 shows the steady state lifetimes for the flight of 30 May. The lifetimes of NO3range from 0–1.5 h and lifetimes up to 3 h are observed for N2O5. Thus, the combination of NO2, O3with NO3 and N2O5, all tied to a single analytical standard, provides a complete and accurate representation of nighttime nitrogen oxide chemistry.
5 Conclusions
The article has described an aircraft instrument for atmo-spheric measurements of NO3, N2O5, NO, NO2, and O3 by cavity ring-down spectroscopy. NO3and NO2are mea-sured directly using a diode lasers with center wavelengths of 662 nm and 405 nm. N2O5is thermally converted to NO3 for measurement and NO and O3are chemically converted to NO2and measured. Each channel is regularly calibrated in the field by a scheme linking the cross-sections of each measured species to the O3 cross-section at 254 nm. The inlet transmission of NO3 and N2O5 is also measured reg-ularly in the field. The performance of the instrument was demonstrated during its first deployment on the NOAA P-3 in California during a 2010 field intensive.
Acknowledgements. This work was funded in part by NOAA’s Atmospheric Chemistry and Climate Program.
Edited by: W. R. Simpson
References
Atkinson, D. B.: Solving chemical problems of environmental importance using cavity ring-down spectroscopy, Analyst, 128, 117–125, doi:10.1039/b206699h, 2003.
Atkinson, R.: Kinetics and mechanisms of the gas-phase reactions of the NO3radical with organic-compounds, J. Phys. Chem. Ref.
Data, 20, 459–507, 1991.
Ayers, J. D., Apodaca, L., Simpson, W. R., and Baer, D. S.: Off-axis cavity ring-down spectroscopy: Application to atmospheric nitrate radical detection, Appl. Optics, 44, 7239–7242, 2005. Brown, S. S.: Absorption spectroscopy in high-finesse
cavi-ties for atmospheric studies, Chem. Rev., 103, 5219–5238, doi:10.1021/cr020645c, 2003.
Brown, S. S., Stark, H., Ciciora, S. J., McLaughlin, R. J., and Rav-ishankara, A. R.: Simultaneous in situ detection of atmospheric NO3and N2O5via cavity ring-down spectroscopy, Rev. Sci.
In-strum., 73, 3291–3301, doi:10.1063/1.1499214, 2002.
Brown, S. S., Stark, H., and Ravishankara, A. R.: Applicabil-ity of the steady state approximation to the interpretation of at-mospheric observations of NO3 and N2O5, J. Geophys.
Res.-Atmos., 108, 5219–5238, doi:10.1029/2003jd003407, 2003. Brown, S. S., Dub´e, W. P., Osthoff, H. D., Stutz, J., Ryerson, T. B.,
Wollny, A. G., Brock, C. A., Warneke, C., de Gouw, J. A., At-las, E., Neuman, J. A., Holloway, J. S., Lerner, B. M., Williams, E. J., Kuster, W. C., Goldan, P. D., Angevine, W. M., Trainer, M., Fehsenfeld, F. C., and Ravishankara, A. R.: Vertical profiles in NO3and N2O5measured from an aircraft: Results from the
NOAA P-3 and surface platforms during NEAQS 2004, J. Geo-phys. Res., 112, D22304, doi:10.1029/2007JD008883, 2007a. Brown, S. S., Dub´e, W. P., Osthoff, H. D., Wolfe, D. E., Angevine,
W. M., and Ravishankara, A. R.: High resolution vertical distri-butions of NO3and N2O5through the nocturnal boundary layer,
Atmos. Chem. Phys., 7, 139–149, doi:10.5194/acp-7-139-2007, 2007b.
Busch, K. W. and Busch, M. A.: Cavity-ringdown spectroscopy, American Chemical Society, Washington, DC, 1999.
Dub´e, W. P., Brown, S. S., Osthoff, H. D., Nunley, M. R., Ciciora, S. J., Paris, M. W., McLaughlin, R. J., and Ravishankara, A. R.: Aircraft instrument for simultaneous, in situ measurement of NO3and N2O5via pulsed cavity ring-down spectroscopy, Rev.
Sci. Instrum., 77, 034101, doi:10.1063/1.2176058, 2006. Everest, M. A. and Atkinson, D. B.: Discrete sums for the rapid
determination of exponential decay constants, Rev. Sci. Instrum., 79, 023108, doi:10.1063/1.2839918, 2008.
Finlayson-Pitts, B. J., Ezell, M. J., and Pitts, J. N.: Formation of chemically active chlorine compounds by reactions of atmo-spheric NaCl particles with gaseous N2O5and ClONO2, Nature,
337, 241–244, 1989.
Fuchs, H., Dub´e, W. P., Ciciora, S. J., and Brown, S. S.: Determina-tion of inlet transmission and conversion efficiencies for in situ measurements of the nocturnal nitrogen oxides, NO3, N2O5and NO2, via pulsed cavity ring-down spectroscopy, Anal. Chem.,
80, 6010–6017, doi:10.1021/ac8007253, 2008.
Fuchs, H., Dub´e, W. P., Lerner, B. M., Wagner, N. L., Williams, E. J., and Brown, S. S.: A sensitive and versatile detector for atmo-spheric NO2and NOxbased on blue diode laser cavity ring-down
spectroscopy, Environ. Sci. Technol., 43, 7831–7836, 2009.
1240 N. L. Wagner et al.: Diode laser-based cavity ring-down instrument for NO3, N2O5, NO, NO2and O3
Fuchs, H., Ball, S. M., Bohn, B., Brauers, T., Cohen, R. C., Dorn, H.-P., Dub´e, W. P., Fry, J. L., H¨aseler, R., Heitmann, U., Jones, R. L., Kleffmann, J., Mentel, T. F., M¨usgen, P., Rohrer, F., Rollins, A. W., Ruth, A. A., Kiendler-Scharr, A., Schlosser, E., Shillings, A. J. L., Tillmann, R., Varma, R. M., Venables, D. S., Villena Tapia, G., Wahner, A., Wegener, R., Wooldridge, P. J., and Brown, S. S.: Intercomparison of measurements of NO2
concentrations in the atmosphere simulation chamber SAPHIR during the NO3Comp campaign, Atmos. Meas. Tech., 3, 21–37, doi:10.5194/amt-3-21-2010, 2010.
Jones, C. L. and Seinfeld, J. H.: The oxidation of NO2to nitrate –
day and night, Atmos. Environ., 17, 2370–2373, 1983.
King, M. D., Dick, E. M., and Simpson, W. R.: A new method for the atmospheric detection of the nitrate radical (NO3), Atmos.
Environ., 34, 685–688, 2000.
Langridge, J. M., Ball, S. M., Shillings, A. J., and Jones, R. L.: A broadband absorption spectrometer using light emitting diodes for ultrasensitive, in situ trace gas detection, Rev. Sci. Instrum., 79, 123110, doi:10.1063/1.3046282, 2008.
Osthoff, H. D., Brown, S. S., Ryerson, T. B., Fortin, T. J., Lerner, B. M., Williams, E. J., Pettersson, A., Baynard, T., Dube, W. P., Ciciora, S. J., and Ravishankara, A. R.: Measurement of atmo-spheric NO2by pulsed cavity ring-down spectroscopy, J.
Geo-phys. Res., 111, D12305, doi:10.1029/2005JD006942, 2006. Osthoff, H. D., Pilling, M. J., Ravishankara, A. R., and
Brown, S. S.: Temperature dependence of the NO3 absorp-tion cross secabsorp-tion above 298 K and determinaabsorp-tion of the equi-librium constant for NO3+ NO2−N2O5at atmospherically rel-evant conditions, Phys. Chem. Chem. Phys., 9, 5785–5793, doi:10.1039/b709193a, 2007.
Plane, J. M. C. and Nien, C. F.: Differential optical-absorption spectrometer for measuring atmospheric trace gases, Rev. Sci. Instrum., 63, 1867–1876, 1992.
Platt, U., Perner, D., Winer, A. M., Harris, G. W., and Pitts, J. N.: Detection of NO3in the polluted troposphere by differen-tial optical-absorption, Geophys. Res. Lett., 7, 89–92, 1980. Platt, U. F., Winer, A. M., Bierman, H. W., Atkinson, R., and Pitts
Jr., J. N.: Measurement of nitrate radical concentrations in conti-nental air, Environ. Sci. Technol., 18, 365–369, 1984.
Pollack, I. B., Lerner, B. M., and Ryerson, T. B.: Evaluation of ul-traviolet light-emitting diodes for detection of atmospheric NO2
by photolysis - chemiluminescence, J. Atmos. Chem., 65(2–3), 111–125, doi:10.1007/s10874-011-9184-3, 2011.
Rothman, L. S., Gordon, I. E., Barbe, A., Benner, D. C., Bernath, P. E., Birk, M., Boudon, V., Brown, L. R., Campargue, A., Champion, J. P., Chance, K., Coudert, L. H., Dana, V., Devi, V. M., Fally, S., Flaud, J. M., Gamache, R. R., Goldman, A., Jacquemart, D., Kleiner, I., Lacome, N., Lafferty, W. J., Mandin, J. Y., Massie, S. T., Mikhailenko, S. N., Miller, C. E., Moazzen-Ahmadi, N., Naumenko, O. V., Nikitin, A. V., Or-phal, J., Perevalov, V. I., Perrin, A., Predoi-Cross, A., Rins-land, C. P., Rotger, M., Simeckova, M., Smith, M. A. H., Sung, K., Tashkun, S. A., Tennyson, J., Toth, R. A., Vandaele, A. C., and Vander Auwera, J.: The HITRAN 2008 molecular spectroscopic database, J. Quant. Spectrosc. Ra., 110, 533–572, doi:10.1016/j.jqsrt.2009.02.013, 2009.
Ryerson, T. B., Huey, L. G., Knapp, K., Neuman, J. A., Parrish, D. D., Sueper, D. T., and Fehsenfeld, F. C.: Design and initial char-acterization of an inlet for gas-phase NOymeasurements from
aircraft, J. Geophys. Res.-Atmos., 104, 5483–5492, 1999. Ryerson, T. B., Williams, E. J., and Fehsenfeld, F. C.: An efficient
photolysis system for fast-response NO2measurements, J.
Geo-phys. Res.-Atmos., 105, 26447–26461, 2000.
Ryerson, T. B., Trainer, M., Angevine, W. M., Brock, C. A., Dissly, R. W., Fehsenfeld, F. C., Frost, G. J., Goldan, P. D., Holloway, J. S., Hubler, G., Jakoubek, R. O., Kuster, W. C., Neuman, J. A., Nicks Jr., D. K., Parrish, D. D., Roberts, J. M., Sueper, D. T., Atlas, E. L., Donnelly, S. G., Flocke, F., Fried, A., Pot-ter, W. T., Schauffler, S., Stroud, V., Weinheimer, A. J., Wert, B. P., Wiedinmyer, C., Alvarez, R. J., Banta, R. M., Darby, L. S., and Senff, C. J.: Effect of petrochemical industrial emis-sions of reactive alkenes and NOx on tropospheric ozone
for-mation in Houston, Texas, J. Geophys. Res., 108, ACH8-1-24, doi:10.1029/2002jd003070, 2003.
Schuster, G., Labazan, I., and Crowley, J. N.: A cavity ring down/ca