Gregory J Podgorski
1, Mayank Bansal
2and Nicholas S Flann*
2Address: 1Biology Department and Center for Integrated Biosystems, Utah State University, Logan UT, USA and 2Computer Science Department,
Utah State University, Logan UT, USA
Email: Gregory J Podgorski - [email protected]; Mayank Bansal - [email protected]; Nicholas S Flann* - [email protected] * Corresponding author
Abstract
Background: A significant body of literature is devoted to modeling developmental mechanisms that create patterns within groups of initially equivalent embryonic cells. Although it is clear that these mechanisms do not function in isolation, the timing of and interactions between these mechanisms during embryogenesis is not well known. In this work, a computational approach was taken to understand how lateral inhibition, differential adhesion and programmed cell death can interact to create a mosaic pattern of biologically realistic primary and secondary cells, such as that formed by sensory (primary) and supporting (secondary) cells of the developing chick inner ear epithelium.
Results: Four different models that interlaced cellular patterning mechanisms in a variety of ways were examined and their output compared to the mosaic of sensory and supporting cells that develops in the chick inner ear sensory epithelium. The results show that: 1) no single patterning mechanism can create a 2-dimensional mosaic pattern of the regularity seen in the chick inner ear; 2) cell death was essential to generate the most regular mosaics, even through extensive cell death has not been reported for the developing basilar papilla; 3) a model that includes an iterative loop of lateral inhibition, programmed cell death and cell rearrangements driven by differential adhesion created mosaics of primary and secondary cells that are more regular than the basilar papilla; 4) this same model was much more robust to changes in homo- and heterotypic cell-cell adhesive differences than models that considered either fewer patterning mechanisms or single rather than iterative use of each mechanism.
Conclusion: Patterning the embryo requires collaboration between multiple mechanisms that operate iteratively. Interlacing these mechanisms into feedback loops not only refines the output patterns, but also increases the robustness of patterning to varying initial cell states.
Published: 31 October 2007
Theoretical Biology and Medical Modelling 2007, 4:43 doi:10.1186/1742-4682-4-43
Received: 24 May 2007 Accepted: 31 October 2007
This article is available from: http://www.tbiomed.com/content/4/1/43
© 2007 Podgorski et al; licensee BioMed Central Ltd.
Background
Pattern formation is a defining feature of biological devel-opment. Many mechanisms account for the emergence of complex patterns within a group of initially equivalent cells, including lateral inhibition, differential adhesion, programmed cell death, cell migration, differential growth, and asymmetric cell division [1]. A rich literature describes computational models of each of these pattern-ing processes and explores how these mechanisms can generate the patterns observed during development [2,3]. These modeling studies have offered invaluable insights. However, the vast majority of earlier computational mod-els have explored the role of individual patterning mech-anisms, whereas within the embryo these mechanisms collaborate to pattern tissues. Although many details of the timing and coordination of patterning mechanisms remain to be determined, it is clear that during develop-ment cellular patterns arise from the integration of multi-ple patterning mechanisms, not from the exclusive use of one [1]. For example, in the development of the mamma-lian retina, axonal outgrowth, cell rearrangements, lateral inhibition and cell death all contribute to the creation of the regular pattern of retinal ganglion cells [4]. Similarly, in the development of the Drosophila eye, cell migration, lateral inhibition and multiple rounds of cell death must be coordinated to create the stunningly regular ommatid-ial pattern [5,6]. The development of serotonergic neu-rons in the ventral nerve cord of Drosophila requires the collaboration of cell selection, asymmetric division and apoptosis [7]. As a final example, cardiac development requires coordination of cell proliferation and apoptosis to create the embryonic outflow tract, cardiac valves, the conducting system and the coronary vasculature [8].
Some modeling studies have investigated the potential for multiple, coordinated patterning mechanism to create complex cellular patterns during development. In this work, a cellular pattern refers to the distribution of cell types in space. An early example of cellular pattern forma-tion modeling is the work of Honda and Yamanaka [9] who examined the relationship between cellular growth and division in the formation of the polygonal cellular pattern of the avian oviduct epithelium. Another notable example is the work of Marée and Hogeweg [10] that investigated how individual cells of Dictyostelium discoi-deum organize to form the fruiting body. Their model beautifully simulated this complex morphogenetic proc-ess, and it required the joint operation of differential adhesion, cell differentiation, changes in cell rigidity, and the response of cells to a paracrine signaling molecule. The Maree-Hogeweg model provided the first clear insight into how the later stages of morphogenesis are achieved in this organism.
Eglen and Willshaw [4] examined the ability of lateral inhibition to create mosaic patterns of on- and off-center retinal ganglion cells that matched the regularity of bio-logical mosaics in the cat retina. In contrast to many ear-lier studies, these investigators modeled arrays of irregularly-shaped cells rather than simulating cells as per-fect hexagons. Beginning with an imperper-fect pattern of two cell types, they discovered that lateral inhibition alone was insufficient to create mosaics with the regularity seen in nature. They also found that cell death acting in isola-tion on the initial imperfect pre-pattern did not generate the regular pattern observed in the cat retina. Eglen and Willshaw hypothesized that lateral inhibition and cell death act sequentially to pattern the on- and off-center ganglion cells of the mammalian retina.
More recently, Izaguirre et al. [11] developed a multiple model software package for simulating morphogenesis. They termed this model CompuCell and used it in a pilot study to simulate vertebrate limb development. In this study, Izaguirre et al. [11] utilized modules that involve differential adhesion, reaction-diffusion, cell differentia-tion, and cell division. This work has recently been extended to understand chick wing development [12]. Taken together, these models demonstrate the necessity of multiple interacting mechanisms to accurately reproduce the development of complex components.
Finally, Salizar-Ciudad et al. [1][13] explored the develop-ment of mammalian teeth through a modified reaction-diffusion model. In this model, which considers epithe-lium and underlying mesenchyme, a diffusing activator and inhibitor create differentiated, non-growing enamel knot signaling centers in the epithelium. Epithelial cells and mesenchyme outside enamel knots grow in response to a signal originating from the knots. The unique feature of this model is that the growth of non-knot cells, which drives morphogenesis, alters the reach of the growth sig-nal. In this way, the mechanisms of pattern formation (growth dependent on the concentration of the knot-cen-tered signal) and morphogenesis are coupled in a dynamic feedback loop that produces the tooth.
We are interested in learning how regular mosaic patterns of two different cell types can form in epithelial sheets. These patterns are common in the embryo and are seen in such systems as the Drosophila neurectoderm [14,15] and eye [5], butterfly and moth wing scale cells and surround-ing epithelial cells [16], insect sensory bristle cells and non-sensory epithelial cells [17], and sensory hairs and supporting cells of the vertebrate inner ear [18,19] (see Figure 1).
mechanisms. Previous studies have only partially explored the outcome of interactions between known pat-terning mechanisms or the possible outcome of feedback among mechanisms such as lateral inhibition, cell rear-rangement driven by differential adhesion, and pro-grammed cell death. In a recent review of developmental patterning, Salazar-Ciudad et al. [1] distinguish between morphostatic and morphodynamic strategies of pattern-ing. In the morphostatic strategy, which is the basis of many existing models, an initial inductive mechanism is followed by a morphogenetic mechanism. Induction and morphogenesis operate independently and do not over-lap in time. Induction involves intercellular signaling and morphogenetic mechanisms, as considered by Salazar-Ciudad et al. [1], include directed mitosis, differential growth, apoptosis, migration, and differential adhesion. In contrast, a morphodynamic strategy involves simulta-neous operation of inductive and morophogenetic mech-anisms to create pattern. One example of a morphodynamic mechanism is the combination of lateral inhibition, an inductive mechanism that involves signal-ing through membrane-bound molecules, with pro-grammed cell death, a morphogenetic mechanism. In modeling this combination, lateral inhibition is used to establish cell fates and is followed by programmed cell death to refine a pattern of two cell types. This sequence is then repeated until a crisp pattern of cell types is achieved. In contrast to a morphostatic approach, as pattern emerges in a morphodynamic process, pattern elements acquire new signaling properties and in so doing influ-ence the final form the pattern will take. The process is both iterative and dynamic.
In this work, we explore how the interplay between three widely-utilized patterning mechanisms – lateral inhibi-tion, differential adhesion, and programmed cell death – can generate regular, mosaic patterns seen in development using biologically-realistic cells that dynamically change their shape and contact patterns. We find that combining all three processes into a network with feedback loops produces regular mosaics that are not achieved when lat-eral inhibition, differential adhesion, or programmed cell death operate independently or in simpler networks. Moreover, as these mechanisms are coupled, the robust-ness of pattern formation to alterations in cell-cell adhe-sive strength is increased. We compare the output of our models to the mosaic pattern of sensory and supporting cells of the developing chick basal papilla as reported by Goodyear and Richardson [18]. The power of this compu-tational approach is that it allows exploration of the limits of individual pattern formation mechanisms and an examination of the potential offered by combining inde-pendent mechanisms in a variety of ways. This may inform thinking about the possible ways patterning mech-anisms are deployed and coordinated to create mosaic patterns during development.
Methods
Implementation of the models
The five models explored in this work are shown in Figure 2 and Figure 3. Each model employs one or more of three biologically-relevant pattern formation mechanisms: lat-eral inhibition, differential adhesion and programmed cell death. The input to each model is a 2D sheet of 100– 400 irregularly-shaped cells expressing a random amount
Basilar papilla at E9 and E12
Figure 1
of each of two proteins (Notch and Delta) that mediate lateral inhibition.
Model 0 is a morphostatic model that executes lateral inhibition until a fixed point (no change in expression levels of Notch and Delta) and represents an extension of Collier et al. [22] to a natural arrangement of cells.
Model 1 is a morphostatic model that first uses lateral inhibition to determine cell fate, followed by cell rear-rangement driven by differential adhesion.
Model 2 is a morphodynamic extension of Model 1, where lateral inhibition and differential adhesion form a feedback loop in which cell rearrangement and cell signal-ling are interlaced.
Model 3 is a morphostatic model that investigates the effect of lateral inhibition first determining cell fate, fol-lowed by a feedback loop of programmed cell death and rearrangement driven by differential adhesion.
Model 4 is a morphodynamic extension of Model 3, in which lateral inhibition is interlaced with programmed cell death and rearrangement.
Morphostatic computational models
Figure 2
Models were terminated at quiescence, with quiescence defined differently depending upon component mecha-nisms in each model. Models 1 and 2 were run until the cell defect rate (see below) showed no trend over 30 model iterations. Models 3 and 4 were run until no cell death occurred over 30 model iterations.
The implementation of each pattern forming mechanism and the method used to generate the random input pat-terns as the starting point of each model is described below.
Differential adhesion
Differential adhesion was simulated using the Cellular Potts Model (CPM) [21]. A principle advantage of this model is that global rearrangements within sheets of cells are emergent properties of local interactions between sim-ple sub-cellular components. Each cell is represented as a set of contiguous lattice sites. Cell-cell contacts occur through adjacent lattice sites of different cells. In outline, the cells within the two-dimensional array have defined adhesive properties for each other and the surrounding medium. Cells may form new contacts and move with restrictions in size and in shape. All cell rearrangement is driven by a process of stochastic energy minimization.
The CPM is described by a Hamiltonian equation that estimates the total energy of a particular arrangement of cells. This equation is:
The first term estimates the total surface energy between
all contacting cells and by summing over
all adjacent lattice sites and where ; the
sec-ond term implements an area constraint on cells where aσ
is the actual area (the count of lattice sites, which may range between 64 and 144) of a cell σ, and Aσ is σ's target
area. In these simulations, a lattice site represents approx-imately a 600 nm × 600 nm square, cells have diameters of approximately 8 μm and the total area of simulation is approximately 25, 600 μ2, based on dimensions given in
[18].
Two cell types and the medium are considered in the CPM model implemented here. These are represented as τσ = p
for primary cells, τσ = s for secondary cells, and τ = m for
the medium. The area constraint is only applied to pri-mary and secondary cells. A Jτ, τ' matrix implements the
relative surface tensions between the three types (primary cell, secondary cell, and medium), with J values inversely
H J a A
z z
z z
= ′ + −
′
∑
τσ ,τσ∑
σ σ σ, ( )
2
σz σz′ Jτσz,τσz′
z z′ σz ≠σz′
Morphodynamic computational models
Figure 3
related to cell-cell or cell-medium adhesion. In experi-ments that examined the trajectory of mosaic pattern quality as each model ran, J values were fixed at: Jp, p = 21,
Js, s = 8, Js, p = 11, Jp, m = 21 and Js, m = 21, similar to values used for the "checker board" mosaic rearrangement exper-iments reported by Graner and Glazier [21]. In experi-ments that investigated the robustness of the models under varying homotypic adhesive strengths, Js, s and Jp, p
were varied between 1 ≤Js, s, Jp, p ≤ 21, Js, p = 11 and Js, m = Jp,
m = 21.
Low energy cell arrangements are determined by repeat-edly copying the state of one lattice site to an adjacent lat-tice site for latlat-tice sites belonging to different cells. Let ΔH
be the change in energy resulting from the potential copy of one lattice site state. Then, if ΔH < 0, the state change is always accepted, and if ΔH = 0, the state change is accepted with probability 0.5. Otherwise the state change
is accepted with probability , where T is the temper-ature, representing the agitation of the cells [21].
The CPM is used to create the random input pre-pattern for each of the 5 models and is then used repeatedly after lateral inhibition or programmed cell death in models 1– 4 (see Figure 2 and Figure 3). The input pre-pattern is gen-erated starting from a regular square grid of 20 × 20 cells, each composed of 12 × 12 lattice sites. The target area Aσ
of each cell is set to 144 ± q, where q is a normally distrib-uted variable with a standard deviation of 12. The square grid is then annealed for 1000 Monte Carlo steps (MCS) at T = 10 (see [21] for more details), then 10 MCS at T = 0. The differential adhesion step in models 1–4 is imple-mented as 100 MCS at T = 5 followed by 10 MCS at T = 0.
Lateral inhibition
Some early work implemented lateral inhibition using a strategy where a single randomly chosen cell is assigned a primary identity and its neighbors are assigned a second-ary identity. This method is repeated until all cells are assigned [20]. Collier et al. [22] developed a more realistic model based on protein expression levels and cell-cell membrane signaling. They unitized perfectly hexagonal cells of fixed size. Our model extends this work to natu-rally shaped cells of varying size. For each cell, σ, let Pd(σ) be the dimensionless expression of protein Delta, where 0
≤Pd(σ) ≤ 1.0, and let Pn(σ) be the dimensionless expres-sion of Notch, where 0 ≤Pn(σ) ≤ 1.0. Initially all cell pro-tein values are set from a uniform random distribution [0.5, 1.0]. This modeling of protein expression at the cell level (see Merks and Glazier [23]), rather than at the lat-tice site level, is appropriate since cell-cell signalling occurs only across contacting membranes. The interaction
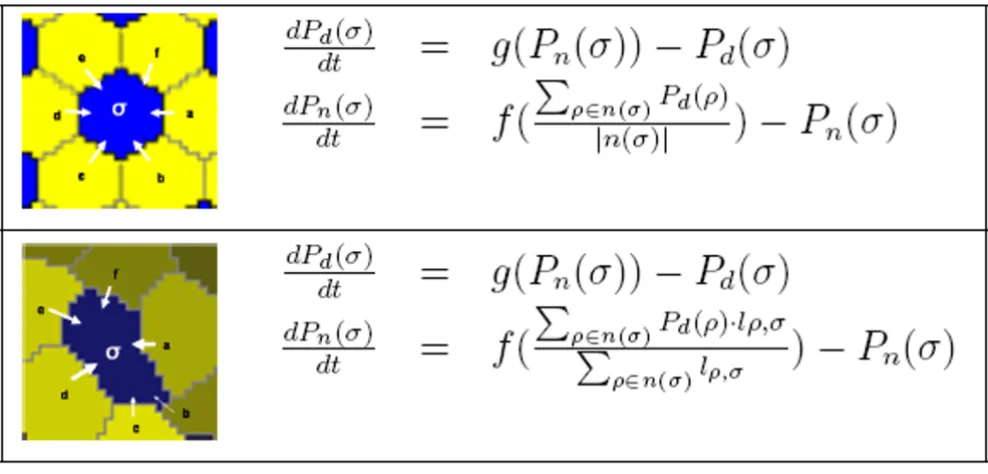
between adjacent cells is modeled as coupled differential equations shown in Figure 4.
The expression of Pn implements cell-cell contact signal-ling, where each cell can sense the expression levels of Pd
of its immediate neighbors via their common mem-branes. In Collier et al. [22] cells were modeled as an exact hexagonal mesh, implying that the influence of each neighbor is equal. In naturally arranged cells, the influ-ence of a neighbor cell ρon the expression of Pn(σ) is pro-portional to the length of the membrane shared between
σand ρ. A longer membrane means increased Pn(σ)
pro-duction as shown in the differential equations of Figure 4. The length of the common membrane between σand ρ,
lρ, σ, is re-computed and cached following each cell
rear-rangement driven by a CPM-anneal.
Lateral inhibition is run by numerically solving the differ-ential equations using the Runge-Kutta method (with dt = 0.05) until a fixed point is reached where the average update error (the average difference in the protein values between iterations) is ≤ 10-8 per cell. Once lateral
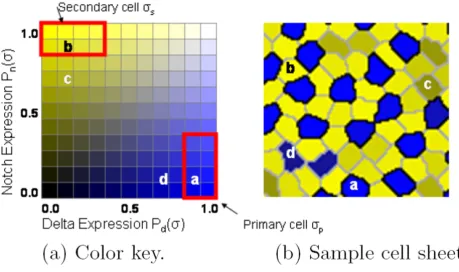
inhibi-tion is terminated, the type of each cell is determined by inspecting values of Notch and Delta as illustrated in Fig-ure 5. A cell σbecomes secondary if Pn(σ) ≥ 0.8 and Pd(σ)
≤ 0.4. A cell becomes primary if Pd(σ) ≥ 0.8 and Pn(σ) ≤ 0.4. The default type for the cells is primary.
Programmed cell death
Programmed cell death occurs in Models 3 and 4 when cells autonomously determine that they are defective according to criteria discussed below. In cases where the mosaic contains two or more defect cells, only one of the cells is randomly selected to die at each iteration of the model. One cell is picked each model iteration to simplify the model and to avoid the need to introduce additional parameters. The space occupied by the dead cell is con-verted to medium and neighboring cells rearrange by dif-ferential cell adhesion to fill the space as illustrated in Figure 6.
Izaguirre et al. [11] modeled cell death by shrinking the target area of the dying cell. Potential complications of this method are the need to set a rate of target area reduc-tion, and the fact that the shrinking cell maintains its orig-inal adhesive properties, thus drawing in surrounding cells. Modeling cell death by transforming the dead cell to medium may be a more realistic method of simulating death by apoptosis. Each iteration of cell death in the Models is followed by a fixed annealing period of 100 MCS. Models with cell death terminate after 30 iterations of differential adhesion (each 100 MCS) with no cell death.
e
H T
Evaluating the regularity of natural mosaics
Mosaic pattern development processes have evolved to produce a regular mosaic of primary cells that provide effi-cient sensory coverage for the eye [2,5,24], insect sensory bristles [17], vertebrate inner ear [18,19] and for structural uniformity, such as in the butterfly and moth wing scales [16]. In this study, mosaic regularity is evaluated based on two measures: the percentage of defect cells and the spa-tial regularity of the the primary cells.
Mosaic defects
Cell death is used in Models 3 and 4 to improve the spatial regularity of primary cells by selectively removing cells that disrupt the regular mosaic. Two principal questions are: (i) Which cells disrupt the spatial regularity con-structed by lateral inhibition? and (ii) Is there a biologi-cally feasible way in which such a defect cell could self-select and choose to die?
Ideally, developmental processes will produce a mosaic of regularly spaced primary cells, each surrounded by a sin-gle ring of secondaries. Such a regular array would be both efficient, in that the minimum number of primary cells are employed, and complete, in that the area of the
mosaic would contain no gaps and be completely covered by sensory cells. Using an array of hexagonal cells, Collier et al. [22] analyzed the system of coupled differential equations implementing lateral inhibition and identified exactly three possible homogeneous solutions (repro-duced in Figure 7), which we term solution type i, ii, or iii. If the mosaic consisted of a uniform population of only one of the solutions, a perfectly regular mosaic would result. However, due to random initial conditions and only local computation, the final mosaic consists of a mix-ture of all three solutions. This results in irregularities, even when modeling with uniform hexagonal cells. More-over, with naturally shaped cells, an additional solution exists, in which two primary cells can touch when the shared membrane is short, termed solution type iv and illustrated in Figure 5(b).
With naturally shaped cells, lateral inhibition will pro-duce a mosaic consisting of a randomly distributed mix-ture of all four possible solutions. In this work, we identify two solutions as disrupting the ideal pattern of a regular mosaic. First, solution type i where secondary cells only touch one primary (see Figure 7) will tend to push pri-mary cells apart and create gaps, thereby reducing
cover-Lateral inhibition model
Figure 4
Lateral inhibition model. Comparison between the lateral inhibition models of Collier et al. [22] that employed hexagonal cells and the models used in this work with naturally shaped cells. In both models, Pd(σ) (Delta) is driven to the opposite of
Pn(σ) (Notch) within each cell, while cell-cell communication across contacting membranes regulates Pn(σ). The length of the
common border between σand ρis lρ, σ, which is the count of all 8-connected lattice sites between and ρ, and σ, and n(σ) returns the set of cells that are direct neighbors of σ.
g x
x f x x
x
( )
( ), ( ) ( )
=
+ = +
1
1 2 1
2
age. Second, solution type iv where primary-primary contacts will result in primary cells that are too close, thereby reducing efficiency. We propose that cell death and diffierential adhesion are utilized to eliminate cells from these two solution types, leaving a regular mosaic consisting of a mixture of only solution types ii and iii.
We define a defect cell as either a primary cell of solution type iv or a secondary cell of solution type i. This defini-tion is supported by observadefini-tions of biological mosaics, in particular by work of Goodyear and Richardson [18] (see Figure 1). Consider that at embryonic day 9, approxi-mately 10% of secondary cells are of solution type i and 3% of primary cells were of solution type iv. In contrast, at embryonic day 12, no type i secondary cells or type iv primary cells were observed.
For the model to be biologically feasible, there must be a way for an individual cell to self-select as a defect and ini-tiate programmed cell death. This determination can be made locally because a secondary cell which touches only one primary tends to express a non-saturated level of Notch (Pn(σ) ≤ 0.8), while a secondary cell that touches two or three primary cells tends to express Notch at a
sat-urated level (Pn(σ) > 0.8). Such a defect cell is marked c in Figure 5. Similarly, due to mutual inhibition, a primary cell touching another primary will express a lower level of Delta compared with primary cells that contact only sec-ondary cells. Such a cell is marked d in Figure 5. This local computation contrasts with the model of cell death described in [4] in which the decision to die was made globally, using criteria such as choosing the smallest or largest cell in the sheet. Significantly, Notch-mediated sig-naling is known to control apoptosis [25]. The model's use of low Notch levels to identify and trigger the death of defect cells is consistent with findings that inhibition or down-regulation of Notch induces apoptosis in murine erythroleukemia cells [26,27].
Measuring spatial regularity
Measures of spatial regularity include the regularity index [28] (sometimes referred to as the conformity ratio) and packing factor [29]. These measures were found by Eglen and Willshaw [4] to provide some discriminatory power in evaluating mosaics formed with and without cell death. However, the recent survey in da Fontoura Costa et al. [30] found that neither measure provided the needed sen-sitivity to discriminate between regular and irregular
syn-Cell protein expression levels
Figure 5
thesized data and between center and peripheral agouti (Dasyprocta agout) retinal photoreceptor mosaics.
We evaluated the regularity index, packing factor and hex-agonality index [30] to determine their sensitivity in dis-criminating between mosaics formed by all five models. We found that none of these measure is sufficiently sensi-tive to capture changes in regularity due to presence of defect cells. We developed a new regularity measure called the Voronoi Regularity Index (VRI) that exhibits high sen-sitivity in evaluating the mosaics produced by the models. To calculate VRI, a Voronoi tessellation is computed [31,32] over the center point (the centroid of the cell's lat-tice sites) of each primary cell. Let D be the set of distances between the center of each Voronoi cell and its vertices, then the VRI is the ratio of the mean of D divided by the standard deviation of D. VRI ranges from ∞ for perfect reg-ularity to near 0 for no regreg-ularity.
Results
We explored the effectiveness of the five models (Models 0 through 4 illustrated in Figure 2 and Figure 3) to create a regular two-dimensional mosaic pattern. In the first study, we compared the output of the models to the devel-opment of the mosaic of sensory (hair cells) and
support-ing cells of the chick basilar papilla reported by Goodyear and Richardson [18]. In the second study, we considered the robustness of the models under varying cell-cell adhe-sion values.
Model performance simulating chick basilar papilla The performance of each model was evaluated based on how well it simulated the mosaic of sensory and support-ing cells of the chick basilar papilla. In this part of the study, the cell-cell and cell-medium adhesive strengths were fixed. We chose a set of J values similar to those used in Graner and Glazier [33]. These values result in negative surface tension between primary and secondary cells, and favor formation of mosaic patterns through differential adhesion. The values were Js, s = 8, Jp, s = 11, Jp, p = Jp, m = Js, m
= 21, giving surface tension values of γp, s = -4.5, γp, m = 17.0, γs, m = 10.5 (calculation of surface tension from J val-ues is given in [33]).
The baseline for model performance was the mosaic pat-tern created by one round of lateral inhibition (Model 0). The output of Model 0 is the input pattern for Models 1– 4.
Images showing cell death
Figure 6
Images showing cell death. When the defect cell (checkered) dies, it becomes medium. As the remaining cells are annealed, cell adhesion causes the void to be filled, near-by cells to shift position and new cell-cell contacts are created and lengthened.
Lateral inhibition solutions
Figure 7
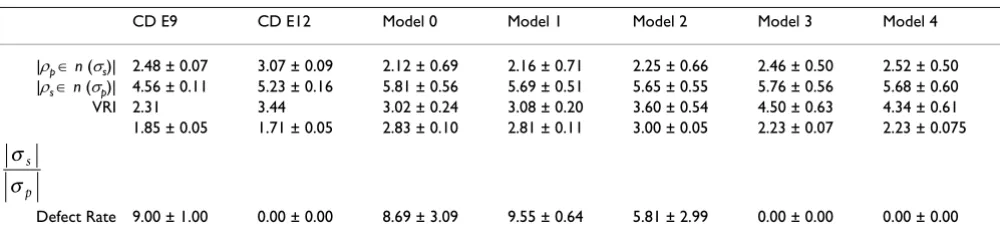
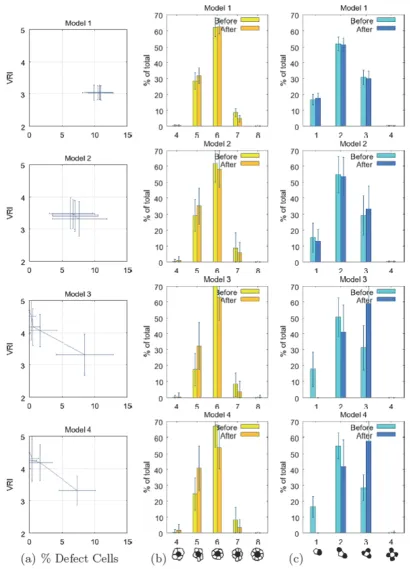
Five measures were made during and at the completion of each run of the models: the primary cell Voronoi regular-ity index (VRI), the number of secondary cells contacted by each primary cell, the number of primary cells con-tacted by each secondary cell, the ratio of secondary to pri-mary cells, and the cell defect rate. Table 1 summarizes values of these measures and compares them with those measured in the chick basilar papilla by Goodyear and Richardson [18]. In the chick basilar papilla, shown in Figure 1, supporting cells correspond to secondary cells and sensory cells correspond to primary cells. Figure 8 shows example mosaics generated by the 5 models. Figure 9(a) shows the trajectory of VRI and defect rate during each model run, Figure 9(b) shows the distributions of the number of secondary cells around each primary cell and Figure 9(c) shows the number of primary cells around each secondary cell. Each model was run between 48 and 256 times. These results are considered below.
Trajectory of models
Model 1, which uses multiple rounds of differential adhe-sion to drive cell rearrangements, yielded no improve-ment in primary cell mosaic regularity (VRI) and a slight increase in defect rate during the model run. Model 2 showed a slight improvement in defect rate. In contrast, Models 3 and 4, which utilize death to eliminate defect cells, showed a clear trend in the improvement of VRI as defect cells die. There was a high degree of variation in both cell defect rate and VRI in runs of all four models. The trend for improvement in both measures was clear in Models 3 and 4, and though both model outputs display a high degree of variability, the improvement in cell defect rate and VRI for these two models was statistically signifi-cant based on a standard two-tailed t-test, with p < 0.05.
We also analyzed the VRI and defect rate in the published images of Goodyear and Richardson [18] that show pri-mary and secondary cells of the central distal region of the chick basilar papilla between embryonic day 9 (E9) and day 12 (E12) (see Figure 1). The mosaic of hair and sup-porting cells emerges and is refined during this period of development. Between E9 and E12, the cell defect rate decreases from 9.00 ± 1.00 to 0.00 ± 0.00 and the VRI increases from 2.31 to 3.44 (Table 1). If E9 is considered to be the equivalent of the starting point of the models (i.e., Model 0), then the output patterns of Models 1 and 2, which contain residual defect cells, do not effectively simulate basilar papilla pattern development. This implies that lateral inhibition and differential adhesion are insufficient to explain the refinement of the primary cell mosaic in the chick basilar papilla observed by Good-year and Richardson [18].
The VRI of primary cell mosaics generated by all the mod-els is higher than that observed for basilar papilla at E9 (see Table 1). There is a modest increase in VRI in Models 1 and 2 (1.02- and 1.19-fold, respectively). There is an identical 1.49-fold increase in the VRI between E9 and E12 in the chick basilar papilla and in Model 3. The increase in VRI achieved in Model 4 is very similar (1.44-fold).
Cell contact patterns
In the hair cell/supporting cell mosaic of chick basilar papilla and in the four experimental models tested here, there is a trend toward an increased number of primary cells that are contacted by each secondary cell (Figure 9(c) and Table 1 row |ρp ∈n(σs)|), especially in Models 3 and 4. Goodyear and Richardson [18] observed a statistically significant increase in number of primary cells
surround-Table 1: Comparison of models
CD E9 CD E12 Model 0 Model 1 Model 2 Model 3 Model 4
|ρp ∈n (σs)| 2.48 ± 0.07 3.07 ± 0.09 2.12 ± 0.69 2.16 ± 0.71 2.25 ± 0.66 2.46 ± 0.50 2.52 ± 0.50
|ρs ∈n (σp)| 4.56 ± 0.11 5.23 ± 0.16 5.81 ± 0.56 5.69 ± 0.51 5.65 ± 0.55 5.76 ± 0.56 5.68 ± 0.60
VRI 2.31 3.44 3.02 ± 0.24 3.08 ± 0.20 3.60 ± 0.54 4.50 ± 0.63 4.34 ± 0.61
1.85 ± 0.05 1.71 ± 0.05 2.83 ± 0.10 2.81 ± 0.11 3.00 ± 0.05 2.23 ± 0.07 2.23 ± 0.075
Defect Rate 9.00 ± 1.00 0.00 ± 0.00 8.69 ± 3.09 9.55 ± 0.64 5.81 ± 2.99 0.00 ± 0.00 0.00 ± 0.00
Comparison of the central distal (CD) chick basilar papilla cell mosaic development studied in [18] with model results. |ρp ∈n(σs)| is the average
count of primary cells around each secondary cell, |ρs ∈n(σp)| is the average count of secondary cells around each primary, and is the ratio
of the number of secondary cells by the number of primary cells. Error bands are one standard deviation, based on 40 random repeats of each model.
σ σ
s p
σ σ
ing each secondary cell (|ρp ∈n(σs)|) from 2.48 ± 0.07 to 3.07 ± 0.09 in the central distal region of the papilla between E9 and E12. Of particular interest is the elimina-tion by E12 of contacts between secondary cells and only one primary cell. The same result is achieved in Models 3 and 4 through cell death.
Values of the related measure of the average number of secondary cells contacted by each primary cell (the mean of |ρs ∈n(σp)|) were similar in the basilar papilla and in the model output. The significant increase in the number of contacts observed between E9 and E12 in the chick was not observed as models became more complex. In fact, the highest mean of |ρs ∈n(σp)| was observed for Model 0.
A match of cell contact distributions between the 5 model outputs and the centeral distal (CD) and superior proxi-mal (SP) regions of the basilar papilla reported in [18] was performed by computing the average root mean squared error between each pair of distributions. The results are shown in Figure 10, which compares the distri-butions of primary cells around each secondary cell (no significant differences were found when comparing the distribution of secondary cells around each primary cell). At E9, models without cell death (Models 0, 1, and 2) best match observations reported in [18]. Only models with cell death (Models 3 and 4) have a close match to the E12 pattern, implying that cell death is necessary for the for-mation of the mosaic pattern found in the CD and the SP regions.
Robustness of models
In this part of the study, we examined the robustness of Models 1 – 4 across a range of cell-cell adhesive values. While the regulation of cell-cell adhesive values is known to be a key element of morphogenesis in many systems, it is unclear how precisely these values must be specified to permit the emergence of the required pattern. We exam-ined this issue in the second part of the empirical study.
Values of primary cell-primary cell (Jp, p) and secondary cell-secondary cell (Js, s) adhesiveness were varied across all pairs of integer values 1 ≤Jp, p, Js, s, ≤ 21. In every case, the primary cell-secondary cell adhesive value, Jp, s , was
fixed at 11 and cell-medium adhesiveness, Jp, m and Js, m, was fixed at 21. We expect that robustness is a mark of a superior system for pattern formation. We observed strong differences in the robustness of the models to changes in cell adhesive strength. These results are shown in Figures 8, 9, 10, 11.
Four measures were used to compare the performance of the different models in producing regular mosaics. Only one, primary cell VRI, could be used to compare all the models. All other measures (cell defect rate, cell state change, and death rate) allowed only pair-wise compari-sons between models. For example, because Models 3 and 4 run until no cell defects remain, the measure of cell defect rate is meaningless for these models. Similarly, cell death rate is only a valid measure for Models 3 and 4, the only ones that implement cell death. Even with a restric-tion to pair-wise comparisons, significant conclusions can be drawn about the robustness of all four models.
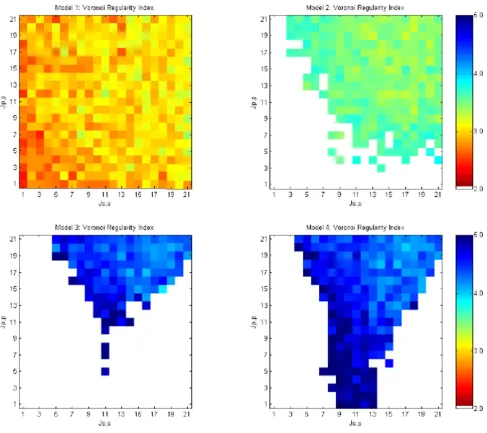
Primary cell Voronoi regularity index
As shown in Figure 11, the four models performed very differently regarding the range of adhesive values that allow production of a regular pattern of primary (sensory) cells. The morphostatic Model 1, with a single round of lateral inhibition followed by multiple rounds of cell rear-rangements, did not produce a regular mosaic relative to more complex models. The morphodynamic Model 2, where lateral inhibition and differential adhesion form a feedback loop, produced a more regular mosaic over a range of adhesive values that span roughly the upper right quadrant of the graph (i.e., approximately Jp, p and Js, s ≥ 9). These correspond to negative γp, s (see [33]) and homo-typic cell-cell adhesive strengths that are lower than the fixed heterotypic affinity of primary and secondary cells
Examples of model end state mosaics
Figure 8
Evaluation of mosaics
Figure 9
(Jp, s = 11). Outside this range of adhesive values, Model 2
became unstable with feedback between lateral inhibition and differential adhesion producing continuous changes between primary and secondary cell state (shown as white in Figure 11 and discussed below).
Model 3 is a morphostatic model that utilizes one round of lateral inhibition followed by an iterative loop of pro-grammed cell death and cell rearrangements driven by dif-ferential cell adhesion. It produced a significantly more regular mosaic than Model 2. However, Model 3 failed across significant regions of cell-cell adhesive strength due to excessive cell death. This caused the initial sheet of 400 cells to be reduced to less than 10 cells. We term this a death cascade and it occurs at values of Js, s d 7 and Jp, p ≤Jp,
s .
Model 4 is morphodynamic model where lateral inhibi-tion forms a feedback loop with programmed cell death and cell rearrangements driven by differential cell adhe-sion. It produced equally regular mosaics as Model 3, but it expanded the range of usable adhesive values into regions where Jp, p ≤Jp, s .
Cell defect rate
Models 1 and 2 are run until the defect rate stabilizes, defined when the percentage of defect cells shows no trend over 30 model iterations. Figure 12 shows the defect rate at termination of Models 1 and 2 as a function of cell adhesive strength. By comparison, the default defect rate of Model 0 is ≈ 10%, which forms the input mosaic of Model 1 and Model 2.
Model 1 has a limited range of adhesive values for which the cell defect rate improves. This range roughly spans γp, s
≤ -3 (when ≥ 14). and Jp, p ≥Js, p. In contrast,
Model 2 produced mosaics with net improvement of the default rate over a much broader range, roughly γp, s ≤ 0
(when ≥ 11) and Jp, p ≥ 5 or about 70% of the
range of homotypic cell adhesive strengths. These results demonstrate the ability of morphodynamic systems to extend the quality and robustness achieved by morphos-tatic systems that utilize the same developmental mecha-nisms. Significantly, the unstable region of homotypic cell adhesive strengths in Model 2 corresponds to the region
Js s, +Jp p,
2
Js s, +Jp p,
2
Comparison between cell connectivity patterns generated by the models and observed in the chick basilar papilla
Figure 10
of high defect rate (≥ 20%) in Model 1. Because Models 3 and 4 are run until there are no defects, they are not included in this comparison.
Instability of cell state
Models 2 and 4 revealed an emergent property with potential biological significance: instability of cell state, where cells continually switch between primary and sec-ondary states (See Figure 13). Although the endpoints of these two models differed (no trend in defect rate for Model 2 and no cell defects for Model 4), both exhibited instability in cell state determination at particular
homo-typic cell adhesive strengths. This was evident in dramatic reversals of primary and secondary cell identity. Such instability is shown in the video [34] that documents a run of Model 2. Models 2 and 4 are morphodynamic and incorporate a feedback loop between lateral inhibition and cell rearrangement. As a consequence of allowing a new round of lateral inhibition, many cells change their identity from primary to secondary and vice versa, based on the new cell contacts established by differential adhe-sion.
Voronoi regularity index for models 1 – 4 run over varying cell-cell adhesive values
Figure 11
Voronoi regularity index for models 1 – 4 run over varying cell-cell adhesive values. Mosaics with V RI ≥ 3.4
Cell defect rates for models 1 and 2 run over varying cell-cell adhesive values
Figure 12
Cell defect rates for models 1 and 2 run over varying cell-cell adhesive values. Each graph cell shows the average of 40 randomized runs. White areas for Model 2 represent unstable regions that do not produce solutions.
Cell state stability for models 2 and 4 run over varying cell-cell adhesive values
Figure 13
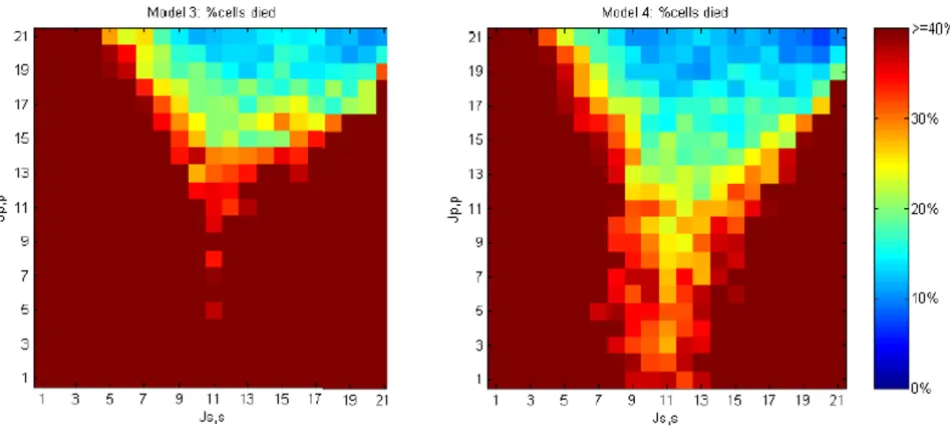
Programmed cell death
Figure 14 shows the percentage of cells that die as a func-tion homotypic adhesion in Models 3 and 4. Both models are terminated when 30 iterations result in no pro-grammed cell death and the resulting mosaic is free of any defect cells. For much of the homotypic adhesion space, high levels of cell death are required to reach termination. In substantial regions of the adhesion space almost all cells die. Such a death cascade is shown in the video in [34]. Death cascades occur when cell rearrangements after a cell death tend to create more defects. Although rela-tively high levels of programmed cell death (e.g., perhaps as high as 50% in the developing mammalian retina [5,6]) are observed, a system in which nearly all cells die is unlikely to be effective in pattern generation.
Figure 14 demonstrates that the morphodynamic Model 4 is more robust to differences in homotypic cell adhesive strength than the morphostatic Model 3. When lateral inhibition is incorporated into a loop with programmed cell death, subsequent defects caused by cell rearrange-ment can often be repaired by signalling over the new cell-cell contacts, thereby avoiding additional cell-cell death. This process enables Model 4 to terminate successfully in regions of adhesive affinity where Js, s ≈Jp, s, which result in death cascades in Model 3.
Discussion
What mechanisms are needed to create a regular two-dimensional mosaic of cells? We explored answers to this
question by examining the interplay of lateral inhibition, cell rearrangements driven by differential adhesion, and programmed cell death in creating and patterning two cell types into a regular mosaic. The performance of four experimental models that weave these patterning mecha-nisms together in different ways was assessed and com-pared with the development of a biological mosaic pattern, the regular array of sensory and supporting cells that emerges in the embryonic chick basilar papilla.
In the first part of this study, the output of four experi-mental models was compared with two mosaic patterns: the pattern generated computationally by a single round of lateral inhibition and the mosaic of sensory and sup-porting cells that emerges and is refined between embry-onic days 9 and 12 in the chick basilar papilla. Modeling studies were performed at fixed values of adhesive strength chosen through guidance from the literature [33].
In early work modeling lateral inhibition, Collier et al. [22] showed that beginning from a field of equipotent hexagonal cells, lateral inhibition alone was insufficient to generate a perfectly regular mosaic of primary and sec-ondary cells. They demonstrated that irregularity in the resulting mosaic was due to the random mixing of three alternative patterns corresponding to alternative homoge-neous steady-state solutions to the differential equations.
Cell death rates for models 3 and 4 run over varying cell-cell adhesive values
Figure 14
branes. Working with this more realistic model, we con-firmed the results of Eglen and Willshaw [4] and showed that lateral inhibition working in isolation can create an irregular mosaic like those seen at early stages of develop-ment.
Using the VRI as a measure of the primary cell mosaic reg-ularity, the average VRI of the mosaics created by lateral inhibition alone (Model 0) was 3.02, slightly less than the primary cell VRI of 3.44 observed in the E12 chick basilar papilla. Allowing iterations of lateral inhibition and cell rearrangements driven by differential adhesion (Model 2) improved primary cell regularity to 3.60. Incorporating the programmed death of cells that make defective con-tacts (Models 3 and 4), further improved primary cell reg-ularity to values (4.50 and 4.35, respectively) above that observed in the chick basilar papilla.
In their description of the development of the chick basi-lar papilla sensory and supporting cell mosaic, Goodyear and Richardson [18] argued that cell rearrangements must occur after an initial pattern is created by lateral inhibi-tion. Our results support this conclusion, but suggest that lateral inhibition and differential adhesion are insuffi-cient to explain the connectivity distribution (where no secondary cells touch a single primary) seen in the E12 stage of the basilar papilla [18]. Goodyear and Richardson [18] used a rough numerical argument based on a field of 1000 cells to discount cell death as a mechanism in the development of the basilar papilla, but they assumed that cell death was limited to the elimination of one member of a pair of contacting primary cells. In contrast, in this work cell death occurs principally in secondary cells and accounts for the observed elimination of those secondary cells that contact exactly one primary as observed in [18]. Additionally, death of secondary cells would have the effect of decreasing the secondary to primary cell ratio as the pattern refines between E9 and E12. This is exactly what Goodyear and Richardson reported. Our results imply that cell death is necessary to account for the mosaic regularity and connectivity pattern observed in the basilar papilla.
In the second part of this study, we examined the robust-ness of each model to alterations in homotypic cell affin-ity. Others have explored how cell rearrangements are affected by varying levels of affinity between two different cell types and the surrounding medium [21,35]. However, to our knowledge, this study is the first to investigate how
than the average affinity of primary-primary and second-ary-secondary interactions, which in turn is less than the strength of primary-secondary interactions (i.e., (Jp, p >
> Js, p). In contrast, when Jp, p < <Js,
p, like cells tend to aggregate. The ability of each model to
generate mosaic patterns, especially in the range of adhe-sive values unfavorable to mosaic formation, provided an assessment of the robustness of each patterning strategy. We found that the set of models performed quite differ-ently across the examined range of homotypic cell adhe-sive values.
The primary cell VRI was examined for all four experimen-tal models, and measures of the percentage of defective cell contacts, instability of cell state, and percentage of cell death required before model termination were examined in select pairs of models. Model 1, which ran only rounds of differential cell adhesion after one round of lateral inhi-bition, was the only one that provided stable solutions over the entire range of homotypic adhesive values.
Morphostatic Model 3, which ran a loop composed of cell death and differential adhesion without lateral inhibition, was notably sensitive to adhesive values. While each cell death event reduced the count of defect cells by one, sub-sequent cell rearrangements often caused additional defects, thereby creating a death cascade that terminated when only a few cells remained.
Morphodynamic Models 2 and 4, which incorporate dif-ferential adhesion and lateral inhibition into iterative loops, also failed at unfavorable homotypic adhesive val-ues because of cell state instability. In these models, lateral inhibition repaired defective cell contacts formed by dif-ferential adhesion (e.g., two primary cells touching or a secondary cell not touching a primary cell). Iterating each model leads to an unstable cycle of mosaic disruption and repair.
Of the four experimental models, Model 4, which iterates a loop of lateral inhibition, programmed cell death, and differential adhesion, provided the highest mosaic regu-larity over the broadest range of homotypic adhesive val-ues. The combination of programmed cell death and lateral inhibition was able to correct many pattern defects
(Js s, +Jp p,) 2
introduced by differential adhesion run at non-optimal values.
Conclusion
We found that lateral inhibition acting alone (Model 0) was insufficient to create a highly regular mosaic of cells of biologically-realistic shape. Adding cell rearrangement driven by differential adhesion (Model 1) to the pattern-ing strategy improved mosaic regularity. Strategies that included programmed cell death (Models 3 and 4) per-formed even better, yielding mosaic patterns more regular than those seen in the chick basilar papilla. Morphody-namic models that incorporated lateral inhibition into a feedback loop were unstable in some regions (Model 2), but when all three patterning mechanisms were utilized (Model 4), patterns became significantly more robust over a variety of homotypic cell-cell adhesion strengths. Finally, regular patterns could be generated using local computation based on units of single cells (as discussed by Merks and Glazier [23]); there was no need, as was the case in some earlier models [4], for global decisions such as choosing the nearest neighbor among a group of con-tacting cells or distinguishing the largest or smallest cell in a developmental field.
Individually, each of the patterning mechanisms exam-ined here has well documented roles in development. What is less clear is the temporal overlap and coordina-tion between these mechanisms during development. In exploring how lateral inhibition, cell rearrangements driven by differential cell adhesion, and programmed cell death can work alone or together, we found that when using cells of irregular size and shape, lateral inhibition is insufficient to create mosaic patterns with the regularity seen in nature. Coupling differential adhesion with lateral inhibition in an iterative loop raised mosaic regularity to the level observed in our target pattern, the mosaic of sen-sory and supporting cells of the chick basilar papilla. Fur-ther improvement in regularity was achieved when programmed cell death was added to the models. These results support the view that patterning mechanisms are used together in a temporally-overlapping and iterative manner in biological development.
The specification of characteristic cell adhesive values through the expression of cell surface adhesive proteins is a well established element of patterning. In examining how homotypic cell adhesion affects the patterns gener-ated by the various models, we found that a strategy that incorporates programmed cell death and lateral inhibi-tion into a loop with differential adhesion (Model 4) is robust over a broad range of adhesive values, including some values that would not allow development of a regu-lar mosaic under simpler schemes (Models 1, 2 and 3). This finding suggests that in addition to improving
mosaic regularity, patterning strategies that incorporate multiple interacting mechanisms offer the advantage of robustness in the face of poorly specified or highly varia-ble initial conditions.
Acknowledgements
We thank Dr. Richard Goodyear for allowing his images of the chick basilar papilla to be used in this work. We also thank Dr. Minghui Jiang for his help in deriving and verifying the Voronio Regularity Index, another key element of this work.
References
1. Salazar-Ciudad I, Jernvall J, Newman SA: Mechanisms of pattern formation in development and evolution. Development 2003,
130:2027-2037.
2. Held L: Imaginal Discs: The Genetic and Cellular Logic of Pattern Formation
Cambridge University Press; 2002.
3. van Ooyen A: Modeling Neural Development Cambridge, MA: MIT Press; 2003.
4. Eglen SJ, Willshaw DJ: Influence of cell fate mechanisms upon retinal mosaic formation: a modelling study. Development
2002, 129:5399-5408.
5. Frankfort B, Mardon G: R8 development in the Drosophila eye: A paradigm for neural selection and differentiation. Develop-ment 2002, 129:1295-1306.
6. Lin HV, Rogulja A: Wingless eliminates ommatidia from the edge of the developing eye through activation of apoptosis.
Development 2004, 131:2409-18.
7. Lundell MJ, Lee HK: The regulation of apoptosis by Numb/ Notch signaling in the serotonin lineage of Drosophila. Devel-opment 2003, 130:4109-4121.
8. Fisher SA, Langille BL: Apoptosis during cardiovascular devel-opment. Circ Res 2000, 87:856-864.
9. Honda H, Yamanaka H, Eguchi G: Transformation of a polygonal cellular pattern during sexual maturation of the avian ovi-duct epithelium: conmputer simulation. J Embr Expl Morph
1986, 98:1-19.
10. Maree AF, Hogeweg P: How amoeboids self-organize into a fruiting body: multicellular coordination in Dictyostelium discoideum. Proc Natl Acad Sci 2001, 98:3879-3883.
11. Izaguirre JA, Chaturvedi R, Huang C, Cickovski T, Coffand J, Thomas G, Forgacs G, Alber M, Hentschel G, Newman SA, Glazier JA: Com-puCell, a multi-model framework for simulation of morpho-genesis. Bioinformatics 2004, 20:1129-1137.
12. Poplawski NJ, Swat M, Gens JS, Glazier JA: Adhesion between cells, diffusion of growth factors, and elasticity of the AER produce the paddle shape of the chick limb. PHYSICA A 2007,
373:521. [doi: 10.1016/j.physa.2006.05.028]
13. Salazar-Ciudad I, Jernvall J: How different types of pattern for-mation mechanisms affect the evolution of form and devel-opment. Evolution and Development 2004, 6:6-16.
14. Skeath J: At the nexus between pattern formation and cell-type specification: the generation of individual neuroblast fates in the Drosophila embryonic central nervous system.
Bioessays 1999, 21:922-931.
15. Wolpert L, Beddington R, Jessell T, Lawrence P, Meyerowitz E, Smith J: Principles of Development 2nd edition. Oxford University Press; 2002. 16. Reed RD: Evidence for Notch-mediated lateral inhibition in organizing butterfly wing scales. Dev Genes Evol 2004,
214:43-46.
17. Simpson P, Woehl R, Usui K: The development and evolution of bristle pattern in Diptera. Development 1999, 126:1349-1364. 18. Goodyear R, Richardson G: Pattern formation in the basilar
papilla: evidence for cell rearrangement. J Neurosci 1997,
17:6289-6301.
19. Haddon C, Smithers L, Schneider-Maunoury S, Coche T, Henrique D, Lewis J: Multiple delta genes and lateral inhibition in zebrafish primary neurogenesis. Development 1998, 125:359-370. 20. Honda H, Tanemura M, Yoshida A: Estimation of neuroblast
numbers in insect neurogenesis using the lateral inhibition hypothesis of cell differentiation. Development 1990,
Publish with BioMed Central and every scientist can read your work free of charge
"BioMed Central will be the most significant development for disseminating the results of biomedical researc h in our lifetime."
Sir Paul Nurse, Cancer Research UK
Your research papers will be:
available free of charge to the entire biomedical community
peer reviewed and published immediately upon acceptance
cited in PubMed and archived on PubMed Central
yours — you keep the copyright
Submit your manuscript here:
http://www.biomedcentral.com/info/publishing_adv.asp
BioMedcentral mental biology. Physica A 2005, 352:113-130.
24. Cook JE, Chalupa LM: Retinal mosaics: new insights into an old concept. TINS 2000, 23:26-35.
25. Miele L, Osborne B: Arbiter of differentiation and death: notch signaling meets apoptosis. Journal of Cellular Physiology 1999,
181:393-409.
26. Shelly LLML, Fuchs C: Notch-1 prevents apoptosis in murine erythroleukemia cells and is necessary for differentiation induced by hybrid polar drugs. J Cell Biochem 1999, 73:164-175. 27. Jang MS, Haixi M, Nadia C, Leslie S, Zlobin A, Darack N, Qin JZ, Nick-oloff B, Miele L: Notch-1 Regulates Cell Death Independently of Differentiation in Murine Erythroleukemia Cells Through Multiple Apoptosis and Cell Cycle Pathways. Journal of Cellular Physiology 2004, 199:418-433.
28. Cook JE: Spatial properties of retinal mosaics: An empirical evaluation of some existing measures. Vis Neurosc 1996,
13(1):15-30.
29. Rodieck RW: The density recovery profile: a method for the analysis of points in the plane applicable to retinal studies.
Visual Neuroscience 1991, 6:95-111.
30. da Fontoura Costa L, Rocha F, de Lima SMA: Characterizing polygonality in biological structures. Phys Rev E Stat Nonlin Soft Matter Phys 2006, 73:.
31. H H: Description of cellular patterns by Dirichlet domains: The two-dimensional case. J Theor Biol 1978, 72:523-543. 32. Guibas LJ, Knuth DE, Sharir M: Randomized incremental
con-struction of Delaunay and Voronoi diagrams. Algorithmica
1992, 7:381-413.
33. Glazier JA, Graner Fmc: Simulation of the differential adhesion driven rearrangement of biological cells. Phys Rev E 1993,
47(3):2128-2154.
34. Author website [http://www.cs.usu.edu/~flann/jtbmm.html] 35. Mombach JCM, Glazier JA, Raphael RC, Zajac M: Quantitative
![Figure 7Lateral inhibition solutionsLateral inhibition solutions. The three homogeneous states for the solution of the lateral inhibition model from [22]](https://thumb-us.123doks.com/thumbv2/123dok_us/324688.1524940/9.612.61.544.539.665/lateral-inhibition-solutionslateral-inhibition-solutions-homogeneous-solution-inhibition.webp)