HOW TO EXCEL AT INTELLIGENCE ANALYSIS
Davide Barbieri
PhD, University of Ferrara (Italy)Stefania Paladini
PhD, Birmingham City University (UK) [email protected]
Abstract
Easy-to-use and commonly available software tools may significantly improve the way intelligence analysts do their job. This is especially true when quantitative assessments - which involve statistical and mathematical calculations - are required by decision makers. The possibility to chart and display results in an intuitive way will facilitate reporting and communication, minimizing ambiguities and the necessary narrative to make sense of collected information. This paper shows how to efficiently leverage MS Excel to produce elegant and accurate intelligence reports for early-warning tasks. As an example, information collected from social media is used in order to update coherently the estimates of the risk of a war between the USA and North Korea.
Keywords: Electronic spreadsheets, social media, quantitative risk assessment, Bayesian inference.
Introduction
The use of Bayesian techniques (Bayes and Price 1763) in security analysis is long established. They helped Alan Turing to break the Enigma code in WWII and the US Navy to track Soviet submarines during the Cold War. The Rand Corporation has used them extensively to assess the probability of a nuclear war. More specifically, some early attempts to quantitatively evaluate the risk of a conflict using software applications based on the rule of Bayes were made in the second half of the last century by the Central Intelligence Agency (Zlotnick 1970, Fisk 1972, Schweitzer 1976).
The technology adopted back then was expensive and not widely available, even though it had a limited working memory and processing capability. Subsequent progresses in digital electronics have determined the widespread adoption of powerful computers for personal use. Modern PCs have much larger processing and storage capacities than those of mainframe computers used forty years ago. Moreover, cheap and user-friendly software - like electronic spreadsheets that can perform advanced mathematical and statistical calculations - have been extensively acquired by non-computer scientists.
and epistemic premises for quantitative inference in the field. In addition, the same approach has been suggested for the risk assessment of violent extremisms (Barbieri and Pressman 2015).
Although Bayesian reasoning is often perceived as counter-intuitive, some successful efforts have been made to teach it to non-statisticians (Gigerenzer and Hoffrage 1995, Hoffrage and Gigerenzer 1998, Sedlmeier and Gigerenzer 2001), and in particular to intelligence professionals (Wheaton et al. 2009). The aim of this study is to evaluate the use of Microsoft Excel and the rule of Bayes for intelligence analysis for early warning tasks, in order to assess quantitatively the risk of a major conflict.
Method
The conditional probability of an event given some piece of information or evidence can be calculated using the rule of Bayes:
P(H0|E)= P(H0)P(E|H0)/P(E)
where:
- P(H0|E) is the posterior or revised probability of H0 (the starting or null hypothesis) given evidence E.
- P(H0) is the prior probability of H0, or base rate (akin to prevalence in epidemiology). It is the first
“bet”, which must be stated explicitly before evaluating any information.
- P(E|H0) is the likelihood of observing E in case H0 is true. In some cases, historical records can be used
to assess it. This is the norm in medical diagnostics, where the rate of true positives of a medical exam is known. In early warning tasks, this is not the case and it must be subjectively estimated.
- P(E) is the probability of observing E regardless of which hypothesis is true, H0 or H1 (the alternative
hypothesis). It can be calculated as P(E)= P(H0)P(E|H0)+P(H1)P(E|H1). Therefore, also P(E|H1), the
likelihood of observing E in case H1 is true, must be estimated.
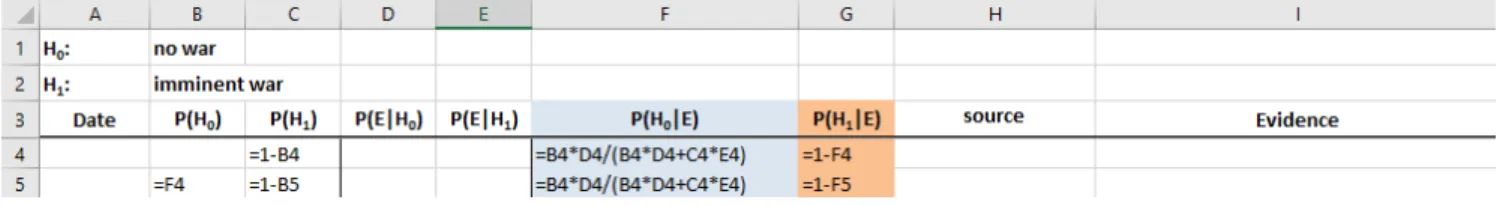
The rule of Bayes can be easily implemented in Excel. First, the two competing hypotheses must be stated explicitly in the top cells (as in Figure 1). Usually, the null hypothesis H0 is that of no war, which was the actual
situation at the beginning of this study. H1 is the alternative hypothesis of an imminent war. There are no real
caveats against using the opposite approach, with H0 corresponding to war and H1 to no war. Still, it is important
that both hypotheses are declared explicitly, in order to avoid any misunderstanding.
Figure 1. The formatted Excel spreadsheet.
Next, the row below the hypotheses must be used for labels (column names). Column A must be formatted to acquire the date of the post. Columns B to G must be formatted to acquire probabilities, that is numbers with two decimals. The last two columns, H and I, can be formatted as text, to input the information and its source. In fact, different sources could be used.
Cell B4 is left blank for the analysts to input their prior estimate. Since P(H1)=1-P(H0), cell C4 contains
“=1-B4”. D4 and E4 are left blank for the analysts to input their subjective assessments of the two likelihoods. In cell F4, the following expression has to be inserted: “=B4*D4/(B4*D4+C4*E4)”, which is the rule of Bayes. Since P(H1|E)=1-P(H0|E), G4 is “=1-F4”, so that the probabilities of both hypotheses are displayed explicitly.
Social media analysis
Twitter (www.twitter.com) is a very popular social media - commonly adopted by many politicians - and it is a primary open source of intelligence. A small set of “tweets” from US President Donald Trump can be used as an example for an early warning task. The acquired information concerns the relationships between the US and North Korea, and must be evaluated in order to quantitatively estimate the risk of an imminent war between the two countries.
After briefly discussing the possibility of a war, analysts input their prior estimates independently. Then, they are given a piece of evidence (a tweet) at a time, allowing them enough time to evaluate it and input its likelihood in case of no war and in case of imminent war. Each time, the posterior probabilities associated to both hypotheses are recalculated automatically and used as a starting point for the following evaluation.
The likelihoods of a piece of evidence do not need to be the complement of each other for the two competing hypotheses. Analysts are free to subjectively evaluate the diagnostic weight of a tweet, which could be even null in case the likelihood of observing it is the same in both cases. For example, the likelihood of a comment by the President on hurricane Irma may be the same (10% or 90%, it does not matter) in case of war and in case of no war. Such information can be deleted, because it is not relevant for the problem at hand. Instead, if P(E|H0)≠P(E|
H1), then the information is relevant, and the posterior probabilities associated to the two hypotheses change
accordingly.
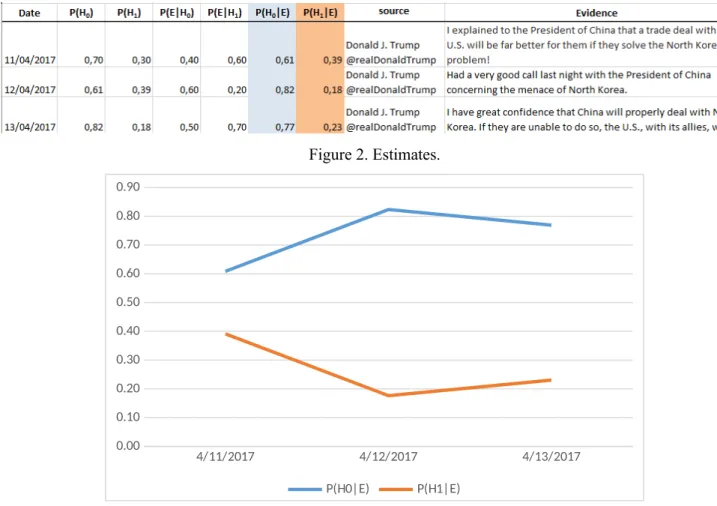
Figure 2 shows the possible evaluations of three tweets. A linear chart showing the trend of both alternative hypotheses can be added (Figure 3). Line colors must be chosen wisely, in order to ease the readability of the chart.
Figure 2. Estimates.
4/11/2017 4/12/2017 4/13/2017
0.00 0.10 0.20 0.30 0.40 0.50 0.60 0.70 0.80 0.90
P(H0|E) P(H1|E)
Discussion and conclusions
Without an electronic spreadsheet and without a good knowledge of statistics and Bayesian inference, it is not easy to calculate the conditional probability of an event given some evidence, even after its likelihood or diagnostic importance has been accurately evaluated by experienced analysts. Two well-known cognitive biases may interfere with the analysts’ work: (i) insufficient adjustment or anchoring, and (ii) the base-rate fallacy. In the first case, analysts tend to stick to their first bet P(H0), regardless of the incoming information (Epley and
Gilovich 2006). In the second, analysts evaluate the risk of an event neglecting its prior probability, possibly because of lack of statistical expertise and subsequent adoption of some heuristics (Tversky and Kahneman 1974).
The adoption of Excel can diminish the impact of these biases. If properly formatted and programmed, it can help intelligence professionals to revise their starting hypotheses coherently on the basis of their assessments. Furthermore, thanks to the chart, Excel can help government agencies to track how their analysts’ opinions evolve as additional information is collected and evaluated. Thus, managers can easily assess the work of their staff.
Nonetheless, a few issues remain. In particular, analysts may not be able to asses the temporal validity of the collected evidence, even giving for granted that the information is reliable and accurate. Usually, it is not possible to determine whether a piece of evidence is still up-to-date at the time of the final assessment, or even when the following item of intelligence is being evaluated. This problem is closely related to the statement of the alternative hypothesis, that of an “imminent” war. Since it would be useless to evaluate the possibility of a war in the long run, analysts should agree on the meaning of “imminent”.
Also the meaning of “war” must be agreed upon. In fact, different definitions may apply. Is a formal war declaration needed for a conflict to be considered as such? Is a single episode where weapons are employed sufficient to declare a state of war? Is it necessary that the attacked part retaliates or not? Is it a war or a terrorist attack if no military targets are hit?
In conclusion, Excel can be a powerful and user-friendly tool for the prediction of a global risk. In particular, it can diminish the weight of biases and ambiguities, assist analysts to state quantitatively their estimates and help decision makers to understand and monitor the situation under scrutiny. However, the weltanschauung of the analysts regarding time and war will unavoidably affect any assessment.
References
Barbieri D, Bayesian Intelligence Analysis, in Proceedings of the 19th Conference on Intelligence in the Knowledge Society, Bucharest (Romania), 18th October 2013.
Barbieri D, Pressman E, Violent Extremists Risk Assessment: A Bayesian Framework, in Proceedings of the 21st Conference on Intelligence in the Knowledge Society, Bucharest (Romania), 16th October 2015.
Bayes T, Price, An Essay towards solving a Problem in the Doctrine of Chances, Philosophical Transactions of the Royal Society, London, 53(0): 370–418, 1763.
Epley N, Gilovich T. The anchoring-and-adjustment heuristic: why the adjustments are insufficient. Psychol Sci. 2006 Apr;17(4):311-8.
Fisk C, The Sino-Soviet border dispute: A comparison of the conventional and Bayesian methods for intelligence warning. Studies in Intelligence, 1972, 16(2):53-62.
Gigerenzer G, Hoffrage U, How to Improve Bayesian Reasoning Without Instruction: Frequency Formats,Psychological Review, 102(4), 1995, 684–704.
Sedlmeier P, Gigerenzer G. Teaching Bayesian reasoning in less than two hours. J Exp Psychol Gen. 2001 Sep;130(3):380-400.
Tversky A and Kahneman D, Judgment under Uncertainty: Heuristics and Biases, Science New Series, Vol. 185, No. 4157 (Sep. 27, 1974), pp. 1124-1131.
Wheaton KJ, Lee J, Deshmukh H, Teaching Bayesian Statistics to Intelligence Analysts: Lessons Learned, Journal of Strategic Security, Number 1 Volume 2, No. 1: February 2009.