O R I G I N A L A R T I C L E
Bending strength and internal bond strength of wood-based
boards subjected to various exposure conditions
Hideaki Korai1•Yoichi Kojima2•Shigehiko Suzuki2
Received: 13 January 2015 / Accepted: 10 June 2015 / Published online: 5 August 2015 ÓThe Japan Wood Research Society 2015
Abstract Phenol–formaldehyde resin-bonded
particle-board (PF particle-board), methylene diphenyl diisocyanate resin-bonded particleboard (MDI board), aspen oriented strand board (aspen board), Scots pine oriented strand board (pine board), methylene diphenyl diisocyanate resin-bonded medium-density fiberboard (F-MDI board), and melamine– urea–formaldehyde resin-bonded medium-density fiber-board (F-MUF fiber-board)—six fiber-board types overall—were subjected to high relative humidity (90 %, 20°C) or cyclic humidity of high/low relative humidity (90/45 %, 20°C) for 5 years. The PF board and aspen board showed reduction in bending strength [modulus of rupture (MOR)] and internal bond strength (IB); however, the MDI board, pine board, F-MDI board, and F-MUF board showed almost no reduction. Furthermore, the boards were sub-jected to outdoor exposure and Test B (boiling for 2 h) from the Japanese Industrial Standard (JIS); the results showed large reduction in the MOR and IB of the PF board and aspen board. In contrast, outdoor exposure did not greatly reduce the MOR and IB of the F-MUF board and F-MDI board. Although the IB of the F-MUF board reduced after the JIS Test B because of using low-dura-bility resin, the IB retention was as high as 87.8 % for 5-year outdoor exposure.
Keywords Wood-based boardDurability
DeteriorationOutdoor exposureAccelerated aging test
Introduction
Outdoor exposure tests are used to assess the durability of wood-based boards (boards). In North America, outdoor exposure tests have been conducted on boards [1–3]. However, in Japan, these tests have rarely been conducted [4]. Therefore, outdoor exposure tests started in 2004 as part of a project organized by the Research Working Group on Wood-based Panels from the Japan Wood Research Society. The boards used were particleboard, oriented strand board (strandboard), and medium-density fiberboard (fiberboard). Our research group [5–12], Kojima et al. [13–16], and Sekino et al. [17] recently reported the results.
In our previous studies [5,6], the degree of deterioration in the strength of boards subjected to outdoor exposure varied according to the board type. Particleboard and strandboard swelled because of the penetration of rainwater through their coarse surfaces [5]. Swelled boards were vulnerable to biodeterioration, which caused large reduc-tion of the strength [5]. However, the strength of fiberboard only slightly reduced because the smooth surface of the fiberboard prevented the penetration of rainwater [6].
Rainwater is considered to be a major factor responsible for the deterioration of boards [5]; however, boards are rarely subjected to a large amount of rainwater over a long period. The most serious deterioration conditions for boards in actual use are long-time exposure to high relative humidity or long-time exposure to cycles of high and low relative humidity. Long-time exposure to high relative humidity causes swelling of the boards, which destroys their bonding points [18, 19]. Furthermore, long-time exposure to cycles of low and high relative humidity causes repeated swelling and shrinking, which also destroys their bonding points [20].
& Hideaki Korai korai@ffpri.affrc.go.jp
1 Forestry and Forest Products Research Institute,
Tsukuba 305-8687, Japan
2 Faculty of Agriculture, Shizuoka University,
In this study, these exposure conditions were reproduced in the laboratory, and the bending strength [modulus of rupture (MOR)] and internal bond strength (IB) of boards subjected to these conditions for 5 years were analyzed. Both strengths combined are hereafter referred to as board strength or strength. The boards used were particleboards, strandboards, and fiberboards.
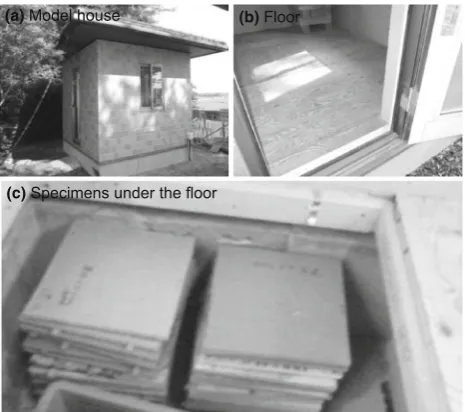
Three exposure conditions were tested: (1) 5-year exposure to high relative humidity of 90 % at 20°C (high humidity), (2) 5-year exposure to cycles of low relative humidity of 45 % and high relative humidity of 90 % at 20°C (cyclic humidity), and (3) a more practical condition of 5-year exposure of the board under the floor of a model house, as shown in Fig.1(floor). This is a significant study because there are few reports on the strength reduction of boards subjected to these conditions for a long time of 5 years.
The boards were also subjected to outdoor exposure in Tsukuba (36°020N, 140°050E), Japan, to compare these conditions employed in this study [5]. Moreover, Test B from Japanese Industrial Standard (JIS Test B) was used as an accelerated aging test [21, 22]. The effects of high humidity, cyclic humidity, and floor conditions, as well as the outdoor exposure in Tsukuba and JIS Test B on the strength reduction of boards were analyzed.
Materials and methods
Test boards
Two types of particleboard were used that differed in terms of the binder: one used phenol–formaldehyde resin (PF board), and the other used methylene diphenyl diisocyanate resin (MDI board). Moreover, two types of strandboard were used that differed in terms of tree species: aspen (Populus tremula) (aspen board) and Scots pine (Pinus sylvestris) (pine board). Furthermore, two types of fiber-board were used that differed in terms of the binder and usage: 9-mm-thick structural fiberboard using methylene diphenyl diisocyanate resin (F-MDI board) and 12-mm-thick fiberboard using melamine–urea–formaldehyde resin (F-MUF board). All boards were commercial products. Further details about the boards are listed in Table1. For each type of board, 30–40 boards measured 910 mm91823 mm were cut into specimens measuring 300 mm9300 mm.
Exposure conditions
For each type of board, the twelve specimens that were selected randomly without any coating on their cut edges were subjected to the following conditions:
1. High humidity: this condition involved exposure to relative humidity of 90 % and temperature of 20°C for 5 years. The twelve specimens were subjected to this condition, and two specimens each were collected after 1-, 2-, 3-, and 5-year exposure.
2. Cyclic humidity: this condition involved exposure to low relative humidity of 45 % and temperature of 20°C for 3 months, followed by exposure to high relative humidity of 90 % and temperature of 20°C for 3 months. The process was repeated (one cycle was equal to 6 months) for 10 cycles (5 years). The 12 specimens were subjected to this condition, and two specimens each were collected after 2, 4, 6, and 10 cycles. Moisture contents were measured after low relative humidity process for 3 months and high relative humidity process for 3 months.
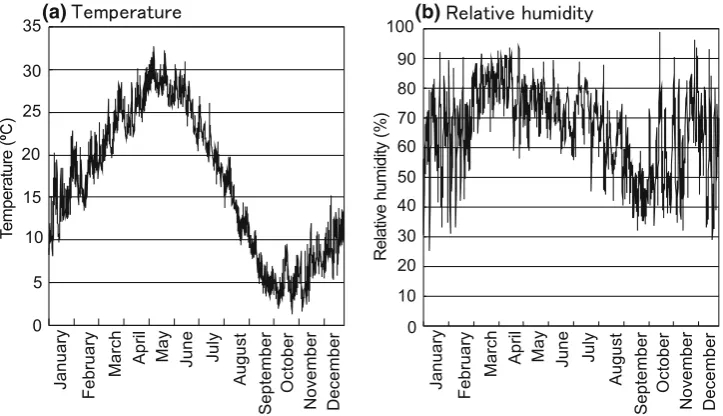
3. Floor: this condition involved leaving the boards under the floor of a model house (Fig.1) in Tsukuba, Japan for 5 years (from March 1, 2005, to March 1, 2010). Figure2 shows the temperature and relative humidity changes, respectively, that occurred over 1 year (from April 1, 2005, to March 31, 2006) in boards left under the floor. During this period, the lowest and highest temperatures were 1.3°C in the winter and 32.8°C in the summer, respectively. The relative humidity was high from March to July and then reduced from July to September. From January to February and from October to December, the relative humidity was distributed over a wide range (30–90 %). The temper-ature and relative humidity were estimated to have fluctuated similarly throughout the 5 years. The 12 specimens were subjected to this condition, and two specimens each were collected after 5 years.
(a) Model house (b) Floor
(c) Specimens under the floor
The boards were also subjected to outdoor exposure in Tsukuba for 5 years (from February 2004 to March 2009). The cut edges of the specimens were coated with enamel paint, which acted as a waterproofing agent. The twelve specimens were subjected to the south at an angle of 90° [5]. In Tsukuba from 2004 to 2009, the mean temperature was 14.3°C, the annual precipitation was 1399 mm, and the annual sunshine duration was 1963 h. Two specimens of each board were collected after 1-, 3-, and 5-year exposure and tested. Further details on outdoor exposure are given in the references [5,7].
The JIS Test B (boiling for 2 h and subsequent water soaking for 1 h at room temperature), which is used for measuring wet MOR [21,22] was conducted as an accel-erated aging test. Generally, in compliance with the JIS Test B, the specimens are not dried before the MOR test; however, in this study, the specimens were dried at 60°C for 24 h before conducting the MOR and IB tests [14,15].
Property tests
The specimens measuring 300 mm9300 mm collected after each exposure were conditioned in a room at temper-ature of 20 °C and relative humidity of 65 % for approxi-mately 1 month. The mass of the specimens was measured to calculate the mass loss under various exposure condi-tions. The mass loss is calculated by the following equation:
Mass loss (%) = m0m1 m0
100
wherem0andm1are the air-dried mass before and after the exposure test, respectively.
Specimens measuring 280 mm950 mm were removed from the specimens measuring 300 mm9300 mm to be used for the MOR test. After this test, specimens measuring 50 mm950 mm were removed from the MOR specimens to
Table 1 Abbreviations and initial properties of boards
Abbreviations Board type Binder Initial density (g/cm3) Initial thickness (mm) Raw material
PF board PB PF 0.75 12.6 Wood waste
MDI board PB MDI 0.80 12.0 Wood waste
Aspen board OSB PF 0.63 12.1 Aspen
Pine board OSB PF 0.67 11.5 Scots pine
F-MDI board MDF MDI 0.71 9.0 MLH and wood waste
F-MUF board MDF MUF 0.76 12.1 MLH and wood waste
PBparticleboard,OSBoriented strand board (strandboard),MDFmedium-density fiberboard (fiberboard),PFphenol–formaldehyde resin,MDI methylene diphenyl diisocyanate resin,MUFmelamine–urea–formaldehyde resin,MLHmixed light hardwoods
(a) (b)
be used for the IB test. The trimming of MOR and IB speci-mens has been reported in previous studies [5,7]. The MOR and IB tests were conducted in compliance with JIS standards [21,22]. The MOR was calculated from the specimen thick-ness after conditioning. Eight and thirteen specimens were cut out from two specimens measuring 300 mm9300 mm for the MOR and IB tests, respectively. The thickness of the specimens measuring 50 mm950 mm was measured to calculate the thickness change prior to the IB test. As the initial thickness of the specimens measuring 50 mm950 mm used for the IB test was not measured before the exposure test, the initial thickness of these specimens was estimated from the mean thickness of the specimens measuring 300 mm9300 mm prior to the exposure test. The thickness change is calculated by the following equation:
Thickness changeð Þ ¼% t1t0
t0
100
wheret0andt1are the air-dried thickness before and after the exposure test, respectively.
Prior to the IB test, all harsh surfaces (approximately 3 mm in depth) of the specimens resulting from outdoor exposure were smoothed using a sander to measure the bonding strength at the core of the board. The MOR of the strandboards was measured parallel to the grains. Four and eight specimens were used for the JIS Test B for measuring MOR and IB, respectively. Thirty specimens each were used for measuring the initial values of MOR and IB. The MOR and IB retentions were calculated using the follow-ing equation:
MOR (or IB) retention (%)
¼ Value after various exposure tests Value before various exposure tests100
The retention that exceeded 100 % was recorded as 100 %.
Results and discussion
Effects of high humidity, cyclic humidity, and floor on strength reduction of board
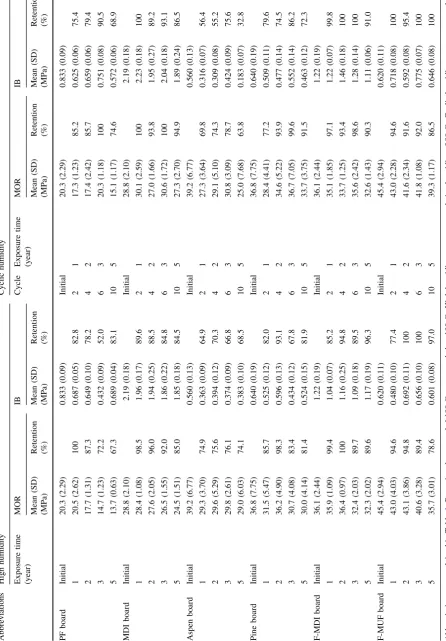
Table2lists the MOR and IB of boards subjected to high humidity and cyclic humidity. Because one cycle was equal to 6 months, the 2-, 4-, 6-, and 10-cycle specimens were subjected for 1, 2, 3, and 5 years, respectively, and are expressed as such. The MOR and IB retentions of the aspen board subjected to high humidity or cyclic humidity for 1 and 2 years were lower than those of other boards. 2-year high humidity and 2-year cyclic humidity reduced MOR and IB only slightly, except for the aspen board.
Prolonged exposure time (for 5 years) to high humidity and cyclic humidity significantly reduced the MOR and IB of the PF board and aspen board. Furthermore, the MDI board and pine board also showed reduction in the MOR and IB for 5 years; however, the reduction shown by these boards was lower than that shown by the PF board and aspen board. The F-MDI board and F-MUF board showed slight reduction in the MOR and IB for 5 years. These results showed that 5-year high humidity and 5-year cyclic humidity caused large reduction in the MOR and IB of the PF board and aspen board, but the same amount of expo-sure slightly reduced the MOR and IB of other boards.
Table3 lists the MOR and IB of boards left under the floor of a model house for 5 years. The MOR and IB retentions were low in the aspen board; however, other boards retained high MOR and IB. 5-year exposure to the floor at these temperature and relative humidity levels only slightly reduced the MOR and IB, except for the aspen board.
From these results, it can be concluded that the MOR and IB of boards subjected to these conditions for 5 years did not reduce significantly, except for the PF board and aspen board. When the boards are used under these con-ditions for a long time, the MOR and IB are presumably retained.
Strength reduction of particleboards subjected to various exposure conditions
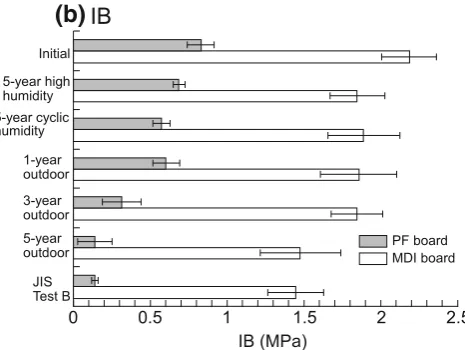
Figure3 shows the MOR and IB of particleboards sub-jected to various exposure conditions. Table4 lists the MOR and IB retentions of particleboards subjected to these conditions. Under all conditions, the MOR of the MDI board was much higher than that of the PF board. This is due to the higher IB of the MDI board, as discussed later. Moreover, both particleboards showed reduction in MOR from the initial value under almost all conditions. The MOR of both particleboards for 5-year high humidity and 5-year cyclic humidity was similar to that for 1-year out-door exposure. Furthermore, 3- and 5-year outout-door expo-sure caused large reduction in the MOR of both particleboards, which was lower than that after the JIS Test B.
particleboards for 5-year outdoor exposure reduced further and was similar to that after the JIS Test B.
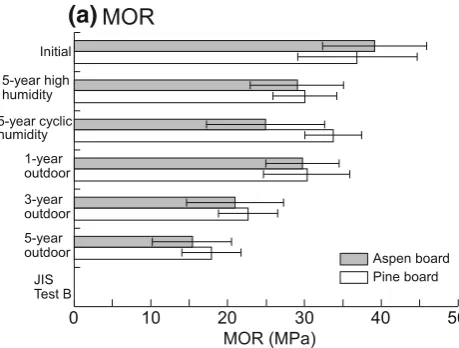
Strength reduction of strandboards subjected to various exposure conditions
Figure4shows the MOR and IB of strandboards subjected to various exposure conditions. Table4lists the MOR and IB retentions of strandboards. As for the strandboards, the MOR test was not conducted using the JIS Test B. Under almost all conditions, the MOR of both strandboards reduced as compared to the initial value. Moreover, the
MOR of both strandboards for 5-year cyclic humidity was similar to that for 5-year high humidity and 1-year outdoor exposure.
The IB of the aspen board for 5-year high humidity was similar to that for 1-year outdoor exposure; however, its IB for 5-year cyclic humidity was much lower. In contrast, the IB of the pine board was similar for 5-year high humidity and 5-year cyclic humidity, as well as 1- and 3-year out-door exposure. The IB of both strandboards reduced shar-ply for 5-year outdoor exposure and was similar to that after the JIS Test B. The raw material densities of aspen and Scots pine are 0.42 and 0.51 g/cm3, respectively [24, 25], and the board densities of aspen board and pine board are 0.63 and 0.67 g/cm3, respectively (Table 1). Further-more, the compaction ratios (board density/raw material density) of aspen board and pine board are 1.50 and 1.31, respectively. The high compaction ratio causes high thickness change because of springback [26]. The high thickness change results in the collapse of bonding points of board [19], and large voids are formed inside the board because of the high thickness change, resulting in biode-terioration inside the board, as discussed in the following sections. As a result, the IB of the pine board was higher than that of the aspen board under almost all conditions, although the initial IB of both strandboards was almost the same (no statistically significant difference).
Table 3 Modulus of rupture (MOR) and internal bond strength (IB) of boards subjected to floor condition
Abbreviations MOR IB
Mean (SD) (MPa)
Retention (%)
Mean (SD) (MPa)
Retention (%)
PF board 19.4 (4.93) 95.6 0.74 (0.08) 89.7
MDI board 29.2 (2.49) 100 2.03 (0.14) 92.8
Aspen board 28.0 (4.74) 71.4 0.359 (0.09) 64.1
Pine board 35.0 (8.66) 95.1 0.59 (0.18) 92.3
F-MDI board 35.0 (3.10) 96.9 1.33 (0.13) 100
F-MUF board 45.8 (2.98) 100 0.78 (0.13) 100
Abbreviations are explained in Table1. Retention that exceeded 100 % was recorded as 100 %. Floor, boards installed under the floor of a model house in Tsukuba, Japan, after 5 years. Numbers in the parentheses denote SD
SDstandard deviation
(a)
(b)
Fig. 3 Mean modulus of rupture (MOR) and internal bond strength (IB) of particleboards subjected to various exposure conditions. 5-year high humidity, 5-year exposure to relative humidity of 90 % at 20°C. 5-year cyclic humidity, 5-year exposure to cycles of relative humidity of 45 % at 20°C for 3 months and 90 % at 20°C for 3 months (one cycle is equal to 6 months). 1-, 3-, and 5-year outdoor, 1-, 3-, and
Factors affecting strength reduction of particleboards and strandboards
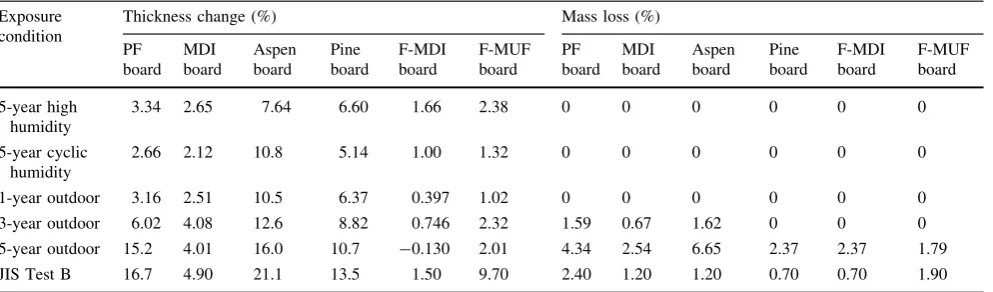
Table5 lists the moisture content of boards subjected to relative humidity of 45 and 90 % at 20°C, which ranged from 6 to 8 % and from 10 to 14 %, respectively. Table6 lists the thickness change and mass loss of the boards subjected to these conditions. When subjected to 5-year high humidity and 5-year cyclic humidity, the strandboards showed thickness change of 5–11 %, which was higher than that shown by the particleboards and fiberboards
(1–3 %). In particular, the thickness change of the aspen board for 5-year cyclic humidity was high at 10.8 %; this causes low MOR and IB because high thickness change tends to collapse the bonding points of board [19]. These results showed that exposing the boards to the moisture content range (6–14 %) for 5 years caused lower thickness change and less mass loss; thus, these conditions caused small reduction in the MOR and IB, except for the aspen board.
The thickness change of both strandboards was much higher at 16.0 and 10.7 %, respectively, for 5-year outdoor
(a)
(b)
Fig. 4 Mean modulus of rupture (MOR) and internal bond strength (IB) of strandboards subjected to various exposure conditions. 5-year high humidity, 5-year exposure to relative humidity of 90 % at 20°C. 5-year cyclic humidity, 5-year exposure to cycles of relative humidity of 45 % at 20°C for 3 months and 90 % at 20°C for 3 months (one cycle is equal to 6 months). 1-, 3-, and 5-year outdoor, 1-, 3-, and
5-year outdoor exposure in Tsukuba, Japan, respectively. JIS Test B, accelerated aging test in compliance with Test B in JIS A 5908 [21] or JIS A 5905 [22] (boiling for 2 h and subsequent water soaking for 1 h at room temperature). Abbreviations are explained in Table1.Error barsdenote standard deviations
Table 4 Modulus of rupture (MOR) retention and internal bond strength (IB) retention of boards subjected to various exposure conditions
Exposure condition
MOR retention (%) IB retention (%)
PF board
MDI board
Aspen board
Pine board
F-MDI board
F-MUF board
PF board
MDI board
Aspen board
Pine board
F-MDI board
F-MUF board
5-year high humidity
67.3 85.0 74.1 81.4 89.6 78.6 83.1 84.5 68.5 81.9 96.3 97.0
5-year cyclic humidity
74.6 94.9 63.8 91.5 90.3 86.5 68.9 86.5 32.8 72.3 91.0 100
1-year outdoor 69.2 84.4 75.8 82.2 89.7 87.6 72.9 84.9 69.5 89.6 93.1 100
3-year outdoor 48.5 68.1 53.3 61.4 79.8 70.9 38.4 84.3 56.6 84.0 81.3 100
5-year outdoor 46.5 70.6 39.1 48.5 77.1 62.0 16.9 67.6 32.8 48.5 96.7 87.8
JIS Test B 59.6 90.9 – – 100 66.0 16.9 66.2 21.4 35.9 86.9 61.3
exposure. The thickness change of the aspen board was higher than that of the pine board owing to high com-paction ratio, as discussed previously. The thickness change was higher than that for 5-year high humidity and 5-year cyclic humidity. Furthermore, 5-year outdoor exposure caused high thickness change of 15.2 and 4.01 % in the PF board and MDI board, respectively. The thickness change of both particleboards for 5-year outdoor exposure was higher than that for 5-year high humidity and 5-year cyclic humidity. The thickness change was particularly high in the PF board. These results showed that 5-year outdoor exposure had severe effects on the strength reduction of the particleboards and strandboards.
In all boards, 5-year high humidity and 5-year cyclic humidity caused almost 0 % mass loss. However, outdoor exposure caused high mass losses of the PF board and aspen board, and slight mass losses of the MDI board and pine board. The high mass loss resulted from
biodeterioration [5,27]. Therefore, biodeterioration accel-erated the strength reduction of the boards.
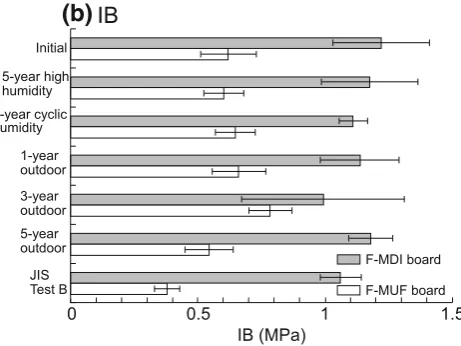
Strength reduction of fiberboards subjected to various exposure conditions
Figure5 shows the MOR and IB of fiberboards subjected to various exposure conditions. Table 4lists the MOR and IB retentions of fiberboards. Under all conditions, except for the JIS Test B and 5-year outdoor exposure, the MOR of the F-MDI board was lower than that of the F-MUF board. Both fiberboards showed slight reduction in MOR for 5-year high humidity and 5-year cyclic humidity, as well as 1-year outdoor exposure; however, they showed larger reduction for 3-year outdoor exposure.
Under all conditions, the IB of the F-MDI board was much higher than that of the F-MUF board. The IB of both fiberboards did not reduce significantly for 5-year high humidity and 5-year cyclic humidity, as well as 1-, 3-, and 5-year outdoor exposure. The IB of the F-MDI board did not reduce greatly after the JIS Test B because of using MDI resin, while the IB of the F-MUF board reduced because of using MUF resin. In general, MDI resin is much more durable than MUF resin [23]. Although the IB of the F-MUF board reduced after the JIS Test B because of using low-durability resin, the IB retention was as high as 87.8 % for 5-year outdoor exposure.
Factors of high durability in strength of fiberboards
The fiberboards showed much lower thickness change than particleboards and strandboards for 5-year outdoor expo-sure (Table6). Our previous reports have mentioned that the high durability of fiberboard against outdoor exposure
Table 6 Thickness change and mass loss of boards subjected to various exposure conditions
Exposure condition
Thickness change (%) Mass loss (%)
PF board
MDI board
Aspen board
Pine board
F-MDI board
F-MUF board
PF board
MDI board
Aspen board
Pine board
F-MDI board
F-MUF board
5-year high humidity
3.34 2.65 7.64 6.60 1.66 2.38 0 0 0 0 0 0
5-year cyclic humidity
2.66 2.12 10.8 5.14 1.00 1.32 0 0 0 0 0 0
1-year outdoor 3.16 2.51 10.5 6.37 0.397 1.02 0 0 0 0 0 0
3-year outdoor 6.02 4.08 12.6 8.82 0.746 2.32 1.59 0.67 1.62 0 0 0
5-year outdoor 15.2 4.01 16.0 10.7 -0.130 2.01 4.34 2.54 6.65 2.37 2.37 1.79
JIS Test B 16.7 4.90 21.1 13.5 1.50 9.70 2.40 1.20 1.20 0.70 0.70 1.90
Abbreviations are explained in Table1. 5-year high humidity, 5-year exposure to relative humidity of 90 %. 5-year cyclic humidity, 5-year exposure to cycles of relative humidity of 45 % at 20°C for 3 months and 90 % at 20°C for 3 months (one cycle: 6 months; 10 cycles: 5 years). 1-, 3-, and 5-year outdoor, 1-, 3-, and 5-year outdoor exposure in Tsukuba, Japan, respectively. JIS Test B, accelerated aging test in compliance with Test B in JIS A 5908 [21] or JIS A 5905 [22] (boiling for 2 h and subsequent water soaking for 1 h at room temperature)
Table 5 Moisture content of boards subjected to relative humidity of 45 and 90 % at 20°C
Abbreviations Moisture content (%)
45 % RH 90 % RH
Mean (SD) Mean (SD)
PF board 8.37 (0.10) 13.8 (0.11)
MDI board 7.83 (0.05) 12.8 (0.10)
Aspen board 7.87 (0.06) 13.7 (0.19)
Pine board 8.16 (0.10) 13.6 (0.12)
F-MDI board 6.53 (0.09) 10.5 (0.22)
F-MUF board 7.11 (0.07) 10.9 (0.08)
Abbreviations are explained in Table1. Numbers in the parentheses denote SD
is presumably because of its smooth surface, which pre-vents rainwater from penetrating and deteriorating the board [5, 6]. However, in this study, the F-MUF board showed large reduction in MOR and IB after the JIS Test B. Rainwater did not penetrate the board, but water pene-trated the board when it was immersed in boiling water for 2 h, which destroyed the bonding points and reduced its MOR and IB. MUF resin is not durable for boiling water and bonding points were destroyed. However, because the F-MDI board uses MDI resin, which is durable for boiling water [23], boiling water penetrating the board did not destroy its bonding points. Therefore, the MOR and IB of the F-MDI board did not reduce.
Conclusions
When the boards were used under mild conditions such as high humidity and cyclic humidity, their MOR and IB did not reduce, except for the PF board and aspen board. Long-time outdoor exposure (3 and 5 years) caused large reduc-tion in the MOR and IB of the PF board, MDI board, aspen board, and pine board, showing that outdoor exposure was more detrimental for these boards than high humidity and cyclic humidity. The F-MDI board retained high MOR and IB for 5-year outdoor exposure and JIS Test B. Although the IB of the F-MUF board reduced after the JIS Test B, the IB retention was as high as 87.8 % for 5-year outdoor exposure.
Acknowledgments This study was supported by a Grant-in-Aid for Scientific Research (21380108) from the Ministry of Education, Culture, Sports, Science and Technology of Japan. The authors are grateful for the grants received. The outdoor exposure test was con-ducted as part of a project organized by the Research Working Group on Wood-based Panels from the Japan Wood Research Society. The authors express their thanks to all participants in this project. Further, the authors are grateful to Mr. Kakitani of Sumitomo Forestry Co. Ltd. for creating exposure conditions for the boards in the model house.
References
1. Okkonen EA, River BH (1996) Outdoor aging of wood-based panels and correlation with laboratory aging: part 2. Forest Prod J 46(3):68–74
2. River BH (1994) Outdoor aging of wood-based panels and cor-relation with laboratory aging. Forest Prod J 44(11/12):55–65 3. Hann RA, Black JM, Blomquist RF (1962) How durable is
par-ticleboard. Forest Prod J 12:577–584
4. Suzuki S (2001) Evaluation of wood-based panel durability (in Japanese). Wood Ind 56:7–12
5. Korai H, Sekino N, Saotome H (2012) Effects of outdoor expo-sure angle on the deterioration of wood-based board properties. Forest Prod J 62:184–190
6. Korai H (2012) Durability of medium density fiberboard sub-jected to outdoor exposure (in Japanese). Mokuzai Gakkaishi 58:347–356
7. Korai H, Adachi K, Saotome H (2013) Deterioration of wood-based boards subjected to outdoor exposure in Tsukuba. J Wood Sci 59:24–34
8. Korai H, Hattori K (2013) Effects of surface coating on durability improvement of particleboard subjected to outdoor exposure (in Japanese). Mokuzai Gakkaishi 59:361–366
(a)
(b)
Fig. 5 Mean modulus of rupture (MOR) and internal bond strength (IB) of fiberboards subjected to various exposure conditions. 5-year high humidity, 5-year exposure to relative humidity of 90 % at 20°C. 5-year cyclic humidity, 5-year exposure to cycles of relative humidity of 45 % at 20°C for 3 months and 90 % at 20°C for 3 months (one cycle is equal to 6 months). 1-, 3-, and 5-year outdoor, 1-, 3-, and
9. Korai H, Saotome H, Ohmi M (2014) Effects of water soaking and outdoor exposure on modulus of rupture and internal bond strength of particleboard. J Wood Sci 60:127–133
10. Korai H, Saotome H (2014) Effects of water soaking and outdoor exposure on nail joint properties of particleboard. J Wood Sci 60:134–140
11. Korai H, Watanabe K, Nogami H, Fukino M, Fujimoto Y (2014) Simple and useful index for analyzing particleboard subjected to outdoor exposure. J Adhes Soc Jpn 50:260–267
12. Korai H, Watanabe K (2014) Effectiveness of principal compo-nent analysis for analyzing particleboard subjected to outdoor exposure. J Wood Sci 61:151–158
13. Kojima Y, Norita H, Suzuki S (2009) Evaluating the durability of wood-based panels using thickness swelling results from accel-erated aging treatments. Forest Prod J 59(5):35–41
14. Kojima Y, Suzuki S (2011) Evaluating the durability of wood-based panels using internal bonding strength results from accel-erated aging treatments. J Wood Sci 57:7–13
15. Kojima Y, Suzuki S (2011) Evaluating the durability of wood-based panels using bending properties after accelerated aging treatments. J Wood Sci 57:126–133
16. Kojima Y, Shimoda T, Suzuki S (2012) Modified method for evaluating weathering intensity using outdoor exposure tests on wood-based panels. J Wood Sci 58:525–531
17. Sekino N, Sato H, Adachi K (2014) Evaluation of particleboard deterioration under outdoor exposure using several different types of weathering intensity. J Wood Sci 60:141–151
18. Sekino N, Okuma M (1985) Performance over time of con-struction particleboard I. Fatigue behavior in bending (in Japa-nese). Mokuzai Gakkaishi 31:801–806
19. Sekino N, Okuma M (1986) Performance of construction parti-cleboard II. Bending in service as underlayment of flowers (in Japanese). Mokuzai Gakkaishi 32:163–169
20. Wu Q, Lee JN (2002) Thickness swelling of oriented strandboard under long-term cyclic humidity exposure condition. Wood Fiber Sci 34:125–139
21. JIS A 5908 (2003) JIS standard specification for particleboard. Japanese Standards Association, Tokyo
22. JIS A 5905 (2003) JIS standard specification for fiberboard. Japanese Standards Association, Tokyo
23. Korai H (2012) Improvement of acetylated fiberboard by ozonization (in Japanese). J Adhes Soc Japan 48:30–35 24. The Timber Research and Development Association (TRADA)
(1980) Timbers of the world. The Construction Press, Bath, pp 182–183
25. The Timber Research and Development Association (TRADA) (1980) Timbers of the world. The Construction Press, Bath, pp 133–134
26. Kawai S, Suda H, Sasaki H (1987) Production technology for low-density particleboard IV. Effects of particle density and compaction ratio on board properties (in Japanese). Mokuzai Gakkaishi 33:385–392