Volume 2008, Article ID 810362,9pages doi:10.1155/2008/810362
Research Article
Comparison of Image Transform-Based Features for
Visual Speech Recognition in Clean and Corrupted Videos
Rowan Seymour, Darryl Stewart, and Ji Ming
School of Electronics, Electrical Engineering and Computer Science, Queen’s University of Belfast, Belfast BT7 1NN, Northern Ireland, UK
Correspondence should be addressed to Darryl Stewart,[email protected]
Received 28 February 2007; Revised 13 September 2007; Accepted 17 December 2007
Recommended by Nikos Nikolaidis
We present results of a study into the performance of a variety of different image transform-based feature types for speaker-independent visual speech recognition of isolated digits. This includes the first reported use of features extracted using a discrete curvelet transform. The study will show a comparison of some methods for selecting features of each feature type and show the relative benefits of both static and dynamic visual features. The performance of the features will be tested on both clean video data and also video data corrupted in a variety of ways to assess each feature type’s robustness to potential real-world conditions. One of the test conditions involves a novel form of video corruption we calljitterwhich simulates camera and/or head movement during recording.
Copyright © 2008 Rowan Seymour et al. This is an open access article distributed under the Creative Commons Attribution License, which permits unrestricted use, distribution, and reproduction in any medium, provided the original work is properly cited.
1. INTRODUCTION
Speech is one of the most natural and important means of communication between people. Automatic speech recog-nition (ASR) can be described as the process of converting an audio speech signal into a sequence of words by com-puter. This allows people to interact with computers in a way which may be more natural than through interfaces such as keyboards and mice, and has already enabled many real-world applications such as dictation systems and voice controlled systems. A weakness of most modern ASR sys-tems is their inability to cope robustly with audio corruption which can arise from various sources, for example, environ-mental noises such as engine noise or other people
speak-ing, reverberation effects, or transmission channel
distor-tions caused by the hardware used to capture the audio sig-nal. Thus one of the main challenges facing ASR researchers is how to develop ASR systems which are more robust to these kinds of corruptions that are typically encountered in real-world situations. One approach to this problem is to introduce another modality to complement the acoustic speech information which will be invariant to these sources of corruption.
It has long been known that humans use available visual information when trying to understand speech, especially in
noisy conditions [1]. The integral role of visual
informa-tion in speech percepinforma-tion is demonstrated by the McGurk
effect [2], where a person is shown a video recording of
one phoneme being spoken, but the sound of a different
phoneme being spoken is dubbed over it. This often results in the person perceiving that he has heard a third interme-diate phoneme. For example, a visual /ga/ combined with an acoustic /ba/ is often heard as /da/. A video signal capturing
a speaker’s lip movements is unaffected by the types of
cor-ruptions outlined above and so it makes an intuitive choice as a complementary modality with audio.
Indeed, as early as 1984, Petajan [3] demonstrated that
the addition of visual information can enable improved speech recognition accuracy over purely acoustic systems, as visual speech provides information which is not always present in the audio signal. Of course it is important that the new modality provides information which is as accu-rate as possible and so there have been numerous studies carried out to assess and improve the performance of vi-sual speech recognition. In parallel with this, researchers have
Video signal
Feature extraction
Recognized speech Classifier
Figure1: The general process of automatic speech recognition.
modalities so that maximum benefit can be gained from their combination.
A visual speech recognition system is very similar to a
standard audio speech recognition system. Figure 1 shows
the different stages of the typical recognition process. Before
the recognition process can begin, the speech models must be constructed. This is usually performed by analyzing a train-ing set of suitable video examples, so that the model parame-ters for the speech units can be estimated. The speech models
are usuallyhidden Markov models(HMM) orartificial neural
networks(ANN). Once the models are constructed, the clas-sifier can use them to calculate the most probable speech unit when given some input video.
Visual features will usually be extracted from the video
frames using a process similar to that shown inFigure 2.
De-pending on the content of the video (i.e., whether it contains more than one speaker’s face), it may be necessary to start with a face detection stage which returns the most likely loca-tion of the speaker’s face in the video frame. The consecutive stages of face localization and mouth localization provide a cropped image of the speaker’s mouth.
The lip parameterization stage may be geometric based
or image transform based. Petajan’s original system [3] is an
example of geometric-based feature extraction which used simple thresholding of the mouth image to highlight the lip area, and then measurements of mouth height, width, and area were taken from that. Since then, many approaches have been developed which exploit our knowledge of the shape of a human mouth to fit more complex models to
speak-ers’ mouths. These methods include active contours (often
referred to assnakes) [4],deformable templates[5–10],active
shape models[11], and various other approaches [12–14]. Whereas geometric methods utilize knowledge of the structure of the human mouth to extract features which de-scribe its shape, image transform methods attempt to trans-form the image pixel values of each video frame into a new lower-dimensional space, which removes redundant infor-mation and provides better class discrimination. As with geometric-based approaches, there have also been
numer-ous studies using different image transform methods. These
methods include discrete cosine transform (DCT) [15–18],
discrete wavelet transform (DWT) [15,19], principal
com-ponent analysis (PCA) [4,15,20], and linear discriminant
analysis (LDA) [21].
In [15], Potamianos et al. give a comparison of DCT,
DWT, Walsh, Karhunen-Lo`eve transform (KLT), and PCA transforms and conclude that the DWT and DCT transforms are preferable to other transforms, such as PCA, which re-quire training. They also tested the features under several noisy video conditions including video field rate decima-tion, additive white noise, and JPEG image compression and showed that image transform-based features are quite robust
to these conditions. In this paper, we wish to carry out a com-plementary study in which we will compare the performance
of a variety of different image transform-based feature types
for speaker-independent visual speech recognition of iso-lated digits recorded in various noisy video conditions which may occur in real-world operating conditions. This work ex-tends upon our previous research on the use of geometric-based features for audio-visual speech recognition subject to
both audio and video corruptions [22].
Specifically, we will compare the performance of features extracted using the discrete cosine transform (DCT), dis-crete wavelet transform (DWT), principal component anal-ysis (PCA), linear discriminant analanal-ysis (LDA), and fast dis-crete curvelet transform (FDCT). This will be the first re-ported results of a system which uses FDCT features for visual speech recognition. The video corruptions used in our tests include video blurring, video compression, and a
novel form of video noise we call jitter which is designed
to simulate the corrupting effects of either camera
move-ment/vibration or the tilting/movement of the speaker’s head while speaking. For each of the transforms, we will
inves-tigate various parameters which could affect their
perfor-mance, such as the feature selection method for DCT fea-tures and the wavelet base and decomposition levels for DWT features. We also investigate the performance improvement gained by augmenting static visual features with their associ-ated dynamic features.
In our experiments, we will be carrying out speaker-independent isolated digit recognition tests using a large in-ternationally standard database and while these experiments will not show the absolute performance which would be achieved on all other recognition tasks or databases, they should allow judgments to be made about the expected com-parative performance of the feature types on new data.
This paper is organized as follows. InSection 2, the
im-age transform feature types used in this work are discussed.
Section 3outlines the preparation of the video data used in
experiments.Section 4contains the experimental results and
discussion. Finally inSection 5, a summary is provided of the
main findings and conclusions which can be drawn from the results.
2. IMAGE TRANSFORM TYPES
As was stated above, we will be comparing the performance
of five different image transform-based feature types. These
are DCT, DWT, PCA, LDA, and finally FDCT. The first four of these are well known in the literature so we will not de-scribe them again here. Instead, we refer the interested reader
to descriptions which can be found in [23]. However, the
FDCT is less well known, so a description is provided in the next subsection.
2.1. Fast discrete curvelet transform
The curvelet transform is a relatively new multiscale
trans-form introduced and described in detail in [24]. The
Video stream
Face localization
Mouth
localization parameterizationLip/ mouth
Visual features
Figure2: The general process of visual feature extraction.
way to represent edges and other singularities along curves
in a way that was more efficient than existing transforms,
that is, less coefficients are required to reconstruct an edge
to a given degree of accuracy. Like the wavelet transform, the curvelet transform uses frame elements indexed by scale and location, but unlike the wavelet transform it also uses direc-tional parameters. The transform is based on an anisotropic scaling principle, unlike the isotropic scaling principle of the wavelet transform.
Theoretically, therefore, such a transform may be able to
extract information about a speaker’s lip contour more effi
-ciently than the DCT or DWT. In [25], two implementations
of the curvelet transform for digital signals are described: one using unequispaced fast Fourier transforms (FFTs) and an-other using frequency wrapping. These transforms are
re-ferred to as fast discrete curvelet transforms. The MATLAB
toolkitCurvelab[26] was used to implement an FDCT (using
unequispaced FFTs) in this work.
3. EXPERIMENTAL DATA
3.1. XM2VTS database
For this work we used the XM2VTS database [27]. This
database contains 295 speakers, roughly balanced between genders. Each speaker was recorded saying all ten digits four
times in four different sessions in a quiet environment. The
data was divided into 200 speakers for training and 95 speak-ers for testing. Thus, there were 3200 training occurrences of each digit and the test data includes 15200 test tokens.
This provides sufficient data to train speaker-independent
digit models. The data is supplied as continuous digit se-quences with only sentence-level transcriptions. However, as was stated previously, for this work we decided to carry out isolated digit recognition experiments, so a forced alignment procedure was initially carried out on all utterances using the
hidden Markov toolkit (HTK) [11] in order to obtain word
boundary positions. The database is also supplied with lip tracking results, using the color-based approach described by
Ramos Sanchez [28]. These were used to localize the mouth
region of interest (ROI) in each video frame.
3.2. Video noise
Three different types of noise were considered which
repre-sent corruption likely to occur in a real-world application:
compression, blurring, and jitter (seeFigure 3).
3.2.1. Compression
Video that is being streamed over a network where band-width is constrained, or stored on a computer where storage
Figure3: From left to right: an original video frame, the same frame compressed (MPEG4 at 4 Kbps), blurred with a Gaussian filter with a standard deviation of 12, and with jitter level 12 applied.
space may be limited, is usually compressed using a codec. Most modern mobile phones are capable of recording and transmitting video recordings, and these are normally highly compressed to reduce bandwidth requirements. The MPEG4 codec was used as it is a modern and popular format, used commonly for sharing files on the Internet. Each video file
in the test set was compressed to 7 different levels of bitrate,
that is, 512, 256, 128, 64, 32, 16, 8, 4 Kbps.
3.2.2. Blurring
Image blurring represents real-world situations where the video camera loses focus on the speaker (many webcams must be manually focused) or situations where the speaker is far away from the camera. In such a situation, the portion of the video frame containing the speaker’s mouth will be very small and may have to be interpolated to a higher resolution to work with a lip feature extraction system. The test videos
were blurred using Gaussian filters with 7 different standard
deviation values, that is, 4, 8, 12, 16, 20, 24, 28.
3.2.3. Jitter
Jitter represents either camera shake, supposing the camera is not mounted securely, or problems with the accurate track-ing and centertrack-ing of the mouth when the speaker’s head is moving. In a real-world application, it is unlikely that a user would keep his head as still as the subjects in our data, so it is assumed that the tracking of the mouth ROI would not be as smooth when his head is moving. Jitter is applied by tak-ing each clean video frame and addtak-ing a random variation to the coordinates and orientation of the mouth ROI. The new resulting video gives the impression that the speakers mouth is shifting and rotating randomly at each frame inside the
ROI. Different levels of jitter are generated by scaling the
ran-dom variation. For example, jitter level 10 corresponds to a
random rotation in the range [−10◦, 10◦] and separate
ran-dom translations along thexandyaxes, both in the range
[−10, 10] pixels. Six jitter levels were used on the test video
For all 3 methods, the corruption levels used were cho-sen to produce a good range of recognition accuracies from approximately random to optimal.
4. EXPERIMENTS
The following experiments all involve speaker-independent digit recognition. The HMM models consisted of 10 states per digit, with each state represented by Gaussian mixture models with 4 mixtures. For all experiments, the models were trained using noise-free video data from 200 subjects, and tested using the data from the remaining 95 subjects.
Prior to each of the image transforms, the mouth ROI in each video frame is converted to the YUV colorspace and only the Y channel is kept, as this retains the image data least
effected by the video compression. This was cropped by a
fixed amount, subsampled, and then passed as the input to the image transforms.
4.1. Transform parameters
Some preliminary experiments were performed to deter-mine the appropriate image resolution for input to the image
transforms, and it was found that images of 16×16 pixels (as
used in [15,16]) provided slightly better performance than
32×32 pixel images, so we used the 16×16 pixel images
here.
In some previous studies using DCT features, the DC
component (i.e., the first component) is excluded [16] but
in others it is retained [15]. Preliminary experiments showed
that including the DC component gave slightly improved recognition performance, so we have included it in all our DCT-based experiments.
Further, preliminary experiments specific to the DWT-based features were carried out to identify which type of
wavelet was most effective, that is, which wavelet base and
level of decomposition are appropriate. The Haar wavelet,
two Daubechies wavelets (D4 and D6) [29], and the Antonini
wavelet [30] were examined. The two Daubechies wavelets
were selected because they had been shown to perform well
for lip reading by previous researchers [19]. The Antonini
wavelet was chosen because it is commonly used for image compression, and is well known for being used by the FBI
for compressing fingerprint images [31]. We found that
al-though there was only a small variation in the performance of these alternatives, the wavelet base and decomposition level that performed the best were those of the Daubechies
4 wavelet, with 3 levels of decomposition (filter coefficients
[0.483, 0.837, 0.224,−0.129]). Hence, this was used in all the
subsequent experiments, and is what we imply byDWTfrom
here on.
A final postprocessing step applied in feature extraction systems is feature normalization. This is especially important in speaker-independent systems where interspeaker
variabil-ity must be modeled. Many systems employmean subtraction
to achieve this normalized state, whereby the mean for each feature is calculated over the utterance, and then subtracted from that feature in every frame. This was the normalization method we employed.
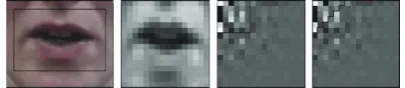
Figure4: From left to right: original lip image, subsampled 16×16 ROI, DCT coefficients with square 6×6 selection, and with triangle 6×6 selection.
4.2. Comparison of feature set selection methods
The purpose of feature selection is to extract from the coeffi
-cients generated by an image transform a new set of values which are suitable for recognition, that is, they have good class discrimination and suitably low dimensionality. The
number of coefficients is usually proportional to the
process-ing time required by a recognition system to train models or recognize data. Some feature selection methods are appro-priate for some kinds of image transform, but inapproappro-priate for others.
The simplest type of feature selection is a fixed 2D mask. The DCT and DWT transforms return a 2D matrix of
coef-ficients, and so coefficients can be selected from the parts of
those matrices which contain the most useful information. Both transforms place the lowest frequency information in the upper-left corner of the matrix, so extracting the coef-ficients within a square aligned with the upper-left corner
of the matrix (seeFigure 4) provides a set of low-frequency
coefficients suitable for recognition. The DCT coefficients,
however, are packed by ascending frequency in diagonal lines so a triangle selection may be more appropriate.
For the DCT, both square and triangular 2D masks were
compared.Figure 5shows speech recognition results in word
error rate (WER) using these feature selection methods with
DCT coefficients. At this stage only static features were used
to allow their selection to be optimized before introducing dynamic features. Each feature selection method was used to
generate different sizes of final feature vector to show the
op-timum feature vector size for each method. As expected, the triangle mask outperformed the square mask, as this includes
more of the coefficients corresponding to low frequencies.
For the DWT it does not make sense to extract
co-efficients using a triangular mask, because they are
orga-nized in squares, so only square mask selection was
con-sidered. Though the coefficients are packed into squares
whose widths and heights are 2N (whereN is an integer),
square masks of any integer size were tried for completeness.
Figure 5shows the performance the DWT coefficients with
square selection of features. The DWT coefficients were
gen-erated using the Daubechies 4 wavelet with 3 levels of
decom-position, as this was found to be optimal inSection 4.1.
The best performance result was found for a square mask
of size 8×8, which corresponds to all the detailed coefficients
of the 2nd and 3rd levels of decomposition, as well as the
ap-proximation coefficients of the 3rd. The number of 64 static
0 10 20 30 40 50
Wo
rd
er
ro
r
ra
te
(%
)
0 10 20 30 40 50 60 70 80 90
Total number of coefficients
DCT (triangle) DCT (square) DWT (square)
Figure5: Recognition performance using different feature selection methods applied to static DCT and DWT coefficients.
0 10 20 30 40
Wo
rd
er
ro
r
ra
te
(%
)
0 10 20 30 40 50 60 70
Total number of coefficients
FDCT (PCA)
FDCT (LDA)
Figure6: Recognition performance using different feature selection methods applied to static FDCT coefficients.
higher number of coefficients to achieve similar accuracy to
the other feature types.
The coefficients produced by the FDCT have a very high
dimensionality (2752) and are not organized in such a way that it would make sense to use a 2D mask such as a triangle or square. Because the FDCT is a nonlinear transformation, it is appropriate to apply one of the linear data compression transformations (PCA or LDA) in order to reduce the
high-dimensional coefficients to low-dimensional features. The
results of using both of those transformations on FDCT
co-efficients are shown inFigure 6. LDA outperformed PCA for
low numbers of coefficients (less than 20). For higher
num-bers of coefficients, PCA outperformed LDA, but the best
re-sult for any number was 21.90% for LDA with 16 coefficients,
making LDA the optimum selection method for FDCT coef-ficients.
PCA and LDA were also used as first-stage image
trans-formations (Figure 7) by using the raw mouth images
(sub-0 10 20 30 40
Wo
rd
er
ro
r
ra
te
(%
)
0 10 20 30 40 50 60 70
Total number of coefficients
PCA LDA
Figure7: Recognition performance using PCA and LDA transfor-mations of raw images to generate static features.
Table 1: Average (absolute) reduction in WER achieved using (static +Δ) features compared to (static only) features and (static +Δ+ΔΔ) features compared to (static +Δ) features.
Image transform (Static +Δ) versus (static only)
(Static +Δ+ΔΔ) versus (static +Δ)
DCT 12.9% 1.5%
FDCT 8.7% 0.8%
PCA 9.4% 0.8%
LDA 8.1% 0.6%
sampled to 16×16) as inputs instead of coefficients from
other transformations. The coefficients returned from the
PCA and LDA transformations are ordered by significance,
and so a feature set withkfeatures is formed by simply taking
the firstkcoefficients. Mirroring what was found for FDCT
coefficients, for approximately less than 20 coefficients, LDA
performed best, but for higher numbers, PCA performed best.
4.3. Dynamic features
Dynamic features provide information about the change or rate of change of the static features over time. It is well known in acoustic-based speech recognition that dynamic features provide valuable discriminative information. In this work, we wished to assess the value of dynamic features in the visual speech domain. The dynamic features we use in these exper-iments were calculated as the first and second derivatives of cubic splines constructed for each feature in each utterance.
We useΔto denote the first derivative features (amount of
change) andΔΔto denote the second derivative features (rate
of change). The final feature vector is formed by concatenat-ing the static and dynamic features.
Table2: Summary of WERs achieved on clean video using the op-timal feature vectors extracted from each image transform.
Image transform DCT FDCT PCA LDA
Selection method Triangle LDA — —
Vector size 30 18 50 18
WER (%) 12.11 14.64 13.43 13.65
discussed in the previous sections. It can be seen inTable 1
that in all cases the introduction of Δfeatures provides a
substantial average improvement in WER compared to
us-ing only static features. However, the further addition ofΔΔ
features provides only a small extra improvement whilst re-quiring a 50% increase in the feature vector size. Therefore,
we decided to use only static +Δfeatures in our next series
of experiments.
Table 2 summarizes the recognition performance achieved on clean video for each feature type using the best feature selection method for that type (as chosen in
Section 4.2) and the feature vector size (consisting of static
features augmented with their Δdynamic features) which
we found to give the best accuracy.
The overall accuracy of the recognition system is af-fected by the vocabulary size and the visual similarity of the words which are in the vocabulary. As the vocabulary size is increased, there are more units which need to be distinguished and hence be more potential for errors to be made. However, it is the visual similarity of words which causes recognition errors, so if the vocabulary of a system is increased but includes words which are much more vis-ibly distinct, then it is likely that the accuracy would im-prove rather than deteriorate. For instance, if the size of the vocabulary was only two words, then the potential for error is much reduced compared to the ten-word vocab-ulary for digit recognition. However, if the two-word vo-cabulary includes just the words “pet” and “bet,” then the accuracy of the system is likely to be very poor because these two words are virtually indistinguishable visually. By examining the confusion matrices generated in our recog-nition experiments, we can see which digits are most eas-ily recognized and which are most confusable. The confu-sion matrix for DCT features from clean video showed that the digit recognized correctly most often was “one” and the digit recognized incorrectly most often was “nine.” Specifi-cally, the most common mistake made was a “nine” being incorrectly recognized as a “six.” Although “nine” and “six”
are acoustically very different, they actually involve similar
lip movements and hence appear similar to a lip reading sys-tem.
4.4. Robustness to video corruption
The recognition performance of the optimal feature vectors for each feature type was compared using the video
corrup-tion types described inSection 3.1. For video compression
0 10 20 30 40 50 60 70 80 90 100
Wo
rd
er
ro
r
ra
te
(%
)
4 8 16 32 64 128
MPEG4 compression (kbps)
DCT FDCT
PCA LDA
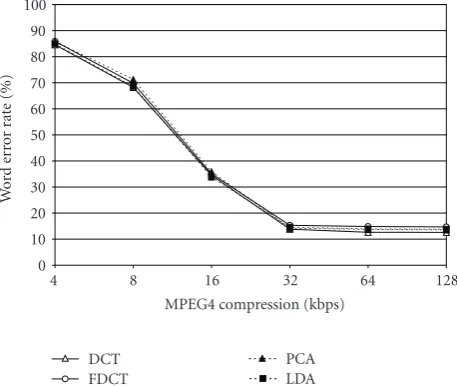
Figure8: WERs achieved using optimal feature vectors for different feature types on video data compressed at various levels of MPEG4 video compression.
(Figure 8) it can be seen that all of the feature types
per-form similarly and that they are affected in a uniform way
by increased video compression. We think that the similar-ity in performance can be explained by the fact that this kind of video compression causes corruption mainly to the temporal information in the video. The compression algo-rithm uses keyframes which means that some video frames will be stored with little loss of information, but that sub-sequent frames may repeat this information (appearing as frozen frames). Thus, a frame may appear as uncorrupted, and generate the same features as a clean frame, but those features will represent an incorrect state when being recog-nized by the HMM. This seems to indicate that in order to improve recognition rates for visual speech recognition on compressed video a new modeling and recognition ap-proach would be needed which can deal with the occurrence of skipped/frozen frames rather than a new type of visual fea-ture. The performances of all our tested systems are quite sta-ble until the bitrate drops below 32 Kbps. This would indicate a minimum reliable operating constraint on the input video for our standard HMM-based models.
For video frame blurring (Figure 9) all of the feature
types show good robustness, even at high levels where it
would be very difficult for a human to comprehend the
con-tent of the video. There is more difference between the
per-formance of the feature types here than in video compres-sion, but DCT provides the best WER, as was also true for the video compression experiments, albeit, to a lesser degree. This is possibly to be expected as feature types which em-phasize that low-frequency information (such as the DCT) should be the most robust to blurring, which essentially de-stroys high-frequency information and leaves low-frequency information intact.
In contrast, for video frame jitter (Figure 10), the DCT
0 10 20 30 40 50
Wo
rd
er
ro
r
ra
te
(%
)
4 8 12 16 20 24 28
Blurring (Gaussian standard deviation)
DCT FDCT
PCA LDA
Figure9: WERs achieved using optimal feature vectors for different feature types on video data at various levels of video frame blurring.
showing its high sensitivity and fragility to motion. PCA performs worst at the highest levels of corruption and over-all, the LDA transform performs the best with jitter, though for the highest levels, the FDCT performs the best. How-ever, the performance of all of the feature types deteriorates quickly in the presence of even moderate levels of this type of corruption, which shows the importance of robust video pre-processing methods which can make corrections for transla-tion and rotatransla-tion of the mouth ROI, similar to the rotatransla-tion
correction used in [16].
5. SUMMARY
In this paper, the performances of several image transform-based feature extraction methods were compared for visual speech recognition in clean and noisy video conditions. This included the first reported results using FDCT-based fea-tures. We have compared feature set selection methods for some of the feature types and suggested the optimal method in each case.
It was hoped that the FDCT would be able to capture important and useful information about the speakers lip contour which would not be captured by the more com-monly used DCT and DWT transforms. However, the recog-nition results in our experiments show that although the per-formance is similar, it does not provide any improvement. It may be the case that the FDCT method captures more speakerspecific information rather thanspeechinformation and therefore may be a suitable feature type for use in vi-sual speakerrecognition systems. Furthermore, in this pa-per we used the PCA and LDA transforms to select features
from the FDCT coefficients; however, alternative methods do
exist which could be used instead of these such as
select-0 10 20 30 40 50 60 70 80 90 100
Wo
rd
er
ro
r
ra
te
(%
)
0 2 4 6 8 10 12
Video frame jitter
DCT FDCT
PCA LDA
Figure10: WERs achieved using optimal feature vectors for diff er-ent feature types on video data corrupted at various levels of video frame jitter.
ing coefficients with the highest energy or variance as
sug-gested in [32] and these could perhaps provide some
im-provement.
We have also investigated the relative merit of augment-ing the features with their associated dynamic features and found that in clean recognition conditions a substantial
im-provement in recognition accuracy was gained by usingΔ
dy-namic features but that only a small additional benefit was
achieved through the introduction ofΔΔdynamic features.
However, it is possible that the main benefits of usingΔΔ
dy-namic features would be seen when testing in noisy rather than in clean conditions and this could be investigated in the future.
A series of experiments were used to test the robustness
of the feature types to different forms and levels of video
ACKNOWLEDGMENTS
The authors thank the reviewers for their helpful comments. This work was supported by the UK EPSRC under Grant EP/E028640/1 ISIS.
REFERENCES
[1] W. G. Sumby and I. Pollack, “Visual contribution to speech intelligibility in noise,”Journal of Acoustical Society of America, vol. 26, no. 2, pp. 212–215, 1954.
[2] H. McGurk and J. MacDonald, “Hearing lips and seeing voices,”Nature, vol. 264, no. 5588, pp. 746–748, 1976. [3] E. D. Petajan,Automatic lipreading to enhance speech
recogni-tion, Ph.D. thesis, University of Illinois, Urbana-Champaign, Ill, USA, 1984.
[4] C. Bregler and Y. Konig, ““Eigenlips” for robust speech recog-nition,” in Proceedings of IEEE International Conference on Acoustics, Speech, and Signal Processing (ICASSP ’94), vol. 2, pp. 669–672, Adelaide, SA, Australia, April 1994.
[5] A. L. Yuille and P. W. Hallinan, “Deformable templates,” in Active Vision, pp. 21–38, MIT Press, Cambridge, Mass, USA, 1993.
[6] M. E. Hennecke, K. V. Prasad, and D. G. Stork, “Using de-formable templates to infer visual speech dynamics,” Tech. Rep., California Research Center, Menlo Park, Calif, USA, 1994.
[7] S. Horbelt and J. Dugelay, “Active contours for lipreading— combining snakes with templates,” inProceedings of the 15th GRETSI Symposium on Signal and Image Processing, pp. 717– 720, Juan-Les-Pins, France, September 1995.
[8] M. Vogt, “Fast matching of a dynamic lip model to color video sequences under regular illumination conditions,” in Speechreading by Humans and Machines, vol. 150, pp. 399–408, Springer, New York, NY, USA, 1996.
[9] T. Coianiz, L. Torresani, and B. Caprile, “2d deformable mod-els for visual speech analysis,” inSpeechreading by Humans and Machines, vol. 150, pp. 391–398, Springer, New York, NY, USA, 1996.
[10] D. Chandramohan and P. L. Silsbee, “A multiple deformable template approach for visual speech recognition,” in Proceed-ings of the 4th International Conference on Spoken Language Processing (ICSLP ’96), vol. 1, pp. 50–53, Philadelphia, Pa, USA, October 1996.
[11] J. Luettin, N. A. Thacker, and S. W. Beet, “Active shape mod-els for visual speech feature extraction,” inSpeechreading by Humans and Machines, vol. 150, pp. 383–390, Springer, New York, NY, USA, 1996.
[12] R. Kaucic, B. Dalton, and A. Blake, “Real-time lip tracking for audio-visual speech recognition applications,” in Proceed-ings of the 4th European Conference on Computer Vision (ECCV ’96), vol. 1065, pp. 376–387, Cambridge, UK, April 1996. [13] M. Gordan, C. Kotropoulos, and I. Pitas, “Pseudoautomatic
lip contour detection based on edge direction patterns,” in Proceedings of the 2nd International Symposium on Image and Signal Processing and Analysis (ISPA ’01), pp. 138–143, Pula, Croatia, June 2001.
[14] R. Goecke, J. B. Millar, A. Zelinsky, and J. Robert-Ribes, “A de-tailed description of the AVOZES data corpus,” inProceedings of IEEE International Conference on Acoustics, Speech, and
Sig-nal Processing (ICASSP ’01), pp. 486–491, Salt Lake City, Utah, USA, May 2001.
[15] G. Potamianos, H. P. Graf, and E. Cosatto, “An image trans-form approach for HMM based automatic lipreading,” in Pro-ceedings of the International Conference on Image Processing (ICIP ’98), vol. 3, pp. 173–177, Chicago, Ill, USA, October 1998.
[16] E. Patterson, S. Gurbuz, Z. Tufekci, and J. Gowdy, “CUAVE: a new audio-visual database for multimodal humancomputer-interface research,” inProceedings of IEEE International Confer-ence on Acoustics, Speech, and Signal Processing (ICASSP ’02), vol. 2, pp. 2017–2020, Orlando, Fla, USA, May 2002. [17] P. C´ısaˇr, M. ˇZelezn´y, J. Zelinka, and J. Trojanov´a,
“Develop-ment and testing of new combined visual speech parame-terization,” inProceedings of the International Conference on Auditory-Visual Speech Processing (AVSP ’07), Hilvarenbeek, The Netherlands, August-September 2007.
[18] M. Heckmann, K. Kroschel, C. Savariaux, and F. Berthommier, “DCT-based video features for audio-visual speech recogni-tion,” inProceedings of the 7th International Conference on Spo-ken Language Processing (ICSLP ’02), pp. 1925–1928, Denver, Colo, USA, September 2002.
[19] I. Matthews, G. Potamianos, C. Neti, and J. Luettin, “A com-parison of model and transform-based visual features for audio-visual LVCSR,” in Proceedings of IEEE International Conference on Multimedia and Expo (ICME ’01), pp. 825–828, Tokyo, Japan, August 2001.
[20] L. Rev´eret, “From raw images of the lips to articulatory pa-rameters : a viseme-based prediction,” inProceedings of the 5th European Conference on Speech Communication and Technol-ogy (EuroSpeech ’ 97), vol. 4, pp. 2011–2014, Rhodes, Greece, September 1997.
[21] G. Potamianos and H. P. Graf, “Linear discriminant analysis for speechreading,” inProceedings of 2nd IEEE Workshop on Multimedia Signal Processing (MMSP ’98), pp. 221–226, Re-dondo Beach, Calif, USA, December 1998.
[22] R. Seymour, J. Ming, and D. Stewart, “A new posterior based audio-visual integration method for robust speech recogni-tion,” inProceedings of the 9th European Conference on Speech Communication and Technology (InterSpeech ’05), pp. 1229– 1232, Lisbon, Portugal, September 2005.
[23] A. K. Jain,Fundamentals of Digital Image Processing, Prentice-Hall, Englewood Cliffs, NJ, USA, 1989.
[24] E. J. Cand´es and D. L. Donoho, “Curvelets—a surprisingly effective nonadaptive representation for objects with edges,” inCurve and Surface Fitting, A. Cohen, C. Rabut, and L. L. Schumaker, Eds., Vanderbilt University Press, Nashville, Tenn, USA, 1999.
[25] E. J. Cand´es, L. Demanet, D. L. Donoho, and L. Ying, “Fast discrete curvelet transforms,” Tech. Rep., California Institute of Technology, Pasadena, Calif, USA, 2005.
[26] E. J. Cand´es, L. Demanet, and L. Ying,CurveLab Toolbox, 2005. [27] K. Messer, J. Matas, J. Kittler, J. Luettin, and G. Maitre, “XM2VTSDB: the extended M2VTS database,” in Proceed-ings of the 2nd International Conference on Audio- and Video-Based Biometric Person Authentication (AVBPA ’99), pp. 72–77, Washington, DC, USA, March 1999.
[28] M. U. Ramos Sanchez,Aspects of facial biometrics for verifica-tion of personal identity, Ph.D. thesis, The University of Surrey, Guilford, UK, 2000.
[30] M. Antonini, M. Barlaud, P. Mathieu, and I. Daubechies, “Im-age coding using wavelet transform,”IEEE Transactions of Im-age Processing, vol. 1, no. 2, pp. 205–220, 1992.
[31] C. M. Brislawn, “The FBI fingerprint image compression spec-ification,” inWavelet Image and Video Compression, chapter 16, pp. 271–288, Kluwer Academic Publishers, Dordrecht, The Netherlands, 1998.