O R I G I N A L A R T I C L E
Practical techniques for the vibration method with additional
mass: effect of specimen moisture content
Yoshitaka Kubojima1•Satomi Sonoda2•Hideo Kato1
Received: 2 May 2017 / Accepted: 1 July 2017 / Published online: 18 August 2017 ÓThe Japan Wood Research Society 2017
Abstract This work examines the effect of moisture con-tent on the accuracy of nondestructively and simply esti-mating weight, density, and Young’s modulus by a vibration test without measuring specimen weight. The resonance frequencies with and without concentrated mass were measured by longitudinal vibration and bending vibration tests. The wet specimens whose initial moisture contents were 93–134% were dried at 20°C and 65% relative humidity, and their weight, density, and Young’s modulus were estimated. The accuracy of the estimation was affected by the increase in the resonance frequency, caused by the drying process, during the vibration tests. The resonance frequency without the concentrated mass should, therefore, be measured after obtaining the reso-nance frequency with the concentrated mass. The accuracy of the estimation in the bending vibration test was higher than that in the longitudinal vibration test. This tendency can be explained by the error in the measurement of res-onance frequencies with and without the concentrated mass.
Keywords Bending vibrationLongitudinal vibration Moisture contentVibration method with additional mass Wood
Introduction
A vibration test is a simple and nondestructive method to measure Young’s modulus and can be applied to machine stress grading. Measurement of specimen density (weight) is required for this testing method; however, the weighing of each piled lumber and the removal of each beam from its timber guardrail for weighing are time-consuming and labor-intensive. Hence, a simple testing method to deter-mine Young’s modulus of lumber without measuring weight is required.
Using theories of vibration, the effect of an addi-tional mass bonded to a bar on the Young’s modulus of the bar has been previously investigated, and fre-quency equations incorporating the effect of the addi-tional mass and its position for longitudinal and bending vibrations have been developed. These fre-quency equations can be used to obtain the density and Young’s modulus values from vibration tests without weighing the specimen [1–13]. In the present study, this procedure is referred to as the ‘‘vibration method with additional mass’’.
Various test conditions must be assessed before apply-ing this method to actual cases. The position of concen-trated mass [14] and the effect of the crosser’s position of piled lumber [15] have already been studied. The moisture content of piled lumber varies, because it is difficult to perform perfect wood drying. The moisture content of beams for timber guardrails varies because of rain. Thus, the question of whether the vibration method with addi-tional mass can be applied to wet wood needs to be clari-fied. The effect of the wood moisture content on the vibration method with additional mass was investigated in this study.
This study was presented in part at the 67th Annual Meeting of Japan Wood Research Society, Fukuoka, March 2017.
& Yoshitaka Kubojima [email protected]
1 Forestry and Forest Products Research Institute, 1 Matsunosato, Tsukuba, Ibaraki 305-8687, Japan 2 Toyama Prefectural Agricultural, Forestry and Fisheries
Research Center, 4940 Kurokawa Shin, Imizu, Toyama 939-0311, Japan
Vibration method with additional mass
In the case of a slender beam, the effect of shear deflection and rotary inertia involved in the flexural vibrational deflection is negligible, and the Euler–Bernoulli elemen-tary theory of bending can be applied to the vibration.
Young’s moduli using the longitudinal and bending vibrationsEof a rectangular bar with lengthlare expressed as follows:
E¼q lxn
mn
2
ðLongitudinal vibrationÞ; ð1aÞ
E¼ l
mn 4
qA I x
2
nðBending vibrationÞ; ð1bÞ
where q, x, A, and I are the density, angular frequency (x=2pf, f: resonance frequency), cross-sectional area, and the moment of inertia of the cross section, respectively. The value ofmnis explained below.
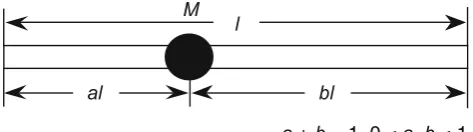
The frequency equation for the free–free longitudinal and bending vibrations with concentrated massMplaced at x=al(x: distance along the bar, 0BaB1, a ?b =1) of a rectangular bar (Fig.1) is expressed as follows [7,9]: sinmnþlmncosamncosbmn¼0ðLongitudinalÞ; ð2aÞ
cosmncoshmn1
ð Þ 1
2lmnfðcosamncoshamnþ1Þ sinbmncoshbmncosbmnsinhbmn
ð Þ
þðcosbmncoshbmnþ1ÞðsinamncoshamncosamnsinhamnÞg
¼0ðBendingÞ;
ð2bÞ
wherelis the ratio of the concentrated mass to the mass of the bar and is written as follows:
l¼ M
qAl: ð3Þ
The suffix n is the resonance mode number. Ifl=0, Eqs. (2a) and (2b) become
sinmn0 ¼0ðLongitudinalÞ; ð4aÞ
cosmn0coshmn01¼0ðBendingÞ; ð4bÞ
where the suffix 0 represents the value without the con-centrated mass.
For a bar without a concentrated mass, Eqs. (4a) and (4b) give
mn0¼npðLongitudinalÞ; ð5aÞ
m10 ¼4:730;m20¼7:853;m30 ¼10:996;
mn0 ¼
1
2ð2nþ1Þpðn[3Þ ðBendingÞ:
ð5bÞ
Since the density and Young’s modulus are the same before and after the concentrated mass is bound to a specimen, using Eqs. (1a), (1b), (5a), and (5b) results in
mn¼ fn fn0
mn0¼ fn fn0
npðLongitudinalÞ; ð6aÞ
mn¼
ffiffiffiffiffi fn fn0
s
mn0ðBendingÞ: ð6bÞ
The value oflcan be calculated by substitutingmnfrom Eqs. (6a) and (6b) into Eqs. (2a) and (2b), respectively. By substituting the calculated l, the concentrated mass, and the dimensions of a bar into Eq. (3), the weight and density can be obtained. The Young’s modulus can be calculated by substituting the density from Eq. (3) and the resonance frequency without the concentrated mass into Eqs. (1a) and (1b) [1–13]. This procedure is referred to as the ‘‘vibration method with additional mass’’.
Materials and methods
Specimens
Sitka spruce (Picea sitchensis Carr.) was used as the sample specimen in this study. Air-dried specimens 300 mm long (L, longitudinal), 30 mm wide (R, radial), and 5 mm thick (T, tangential) were placed under water and then conditioned at 20°C and 65% relative humidity (R. H.) till they attained a constant weight. Nine specimens were used and divided into 3 groups of A, B, and C.
For 3 specimens of Group A, the tests were performed directly after taking the specimen from water (0 h) and again after 3, 6, and 24 h, and when the weight of the specimen became constant at 20°C and 65% R. H. (5–12 days). When the weight of the specimen became constant at 20°C and 65% R. H., the condition of the specimen is regarded to be air-dried. For 3 specimens of Group B, the tests were performed at 0, 9, and 12 h, and the air-dried condition. For 3 specimens of Group C, the tests were performed at 0, 15, 18, and 21 h, and the air-dried condition. After finishing the test under the air-dried con-dition, the specimens were oven-dried at 105 °C. The oven-dried weight was used to calculate the moisture content of the specimen. Because repeated driving of the staple described later increases the number of holes on the
bl al
l M
a + b = 1, 0 a,b 1
RT plane of a specimen, the same specimen was not used from 0 h to the air-dried condition. The moisture content at 0 h varied from 93 to 134%.
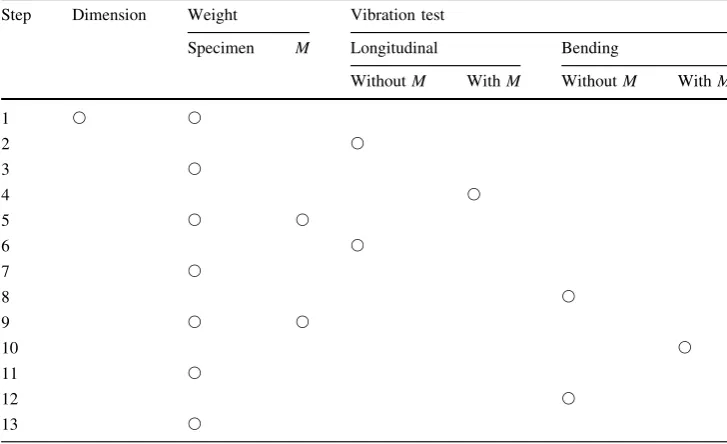
The following 13 steps shown in Table1 were applied to the specimens. All tests were conducted at 20°C and 65% R. H.
Step 1: Dimensions and weight of the specimen were measured.
Step 2: The first longitudinal vibration test without the concentrated mass was performed.
Step 3: The specimen was weighed.
Step 4: Longitudinal vibration test with the concentrated mass was performed.
Step 5: The concentrated mass and the specimen were weighed.
Step 6: The second longitudinal vibration test without the concentrated mass was performed.
Step 7: The specimen was weighed.
Step 8: The first bending vibration test without the concentrated mass was performed.
Step 9: The concentrated mass and the specimen were weighed.
Step 10: Bending vibration test with the concentrated mass was performed.
Step 11: The specimen was weighed.
Step 12: The second bending vibration test without the concentrated mass was performed.
Step 13: The specimen was weighed.
The resonance frequency will increase with the decrease in the moisture content caused by drying during vibration tests and the increase in the resonance frequency will affect the accuracy of the vibration method with additional mass.
Hence, the first and second vibration tests without the concentrated mass (steps 2 and 6 for the longitudinal vibration, and Steps 8 and 12 for the bending vibration) were conducted.
Longitudinal vibration test
To obtain the Young’s modulus, free–free longitudinal vibration tests were conducted on the specimen with and without the concentrated mass using the following procedure. The specimen was placed on a small sponge at the position of x=l/2. The longitudinal vibration was generated by tapping one RT plane of the speci-men with a wooden hammer (0.87 g). The motion of the first mode of the bar was detected by a microphone at the other RT plane. The signal was processed through a fast Fourier transform (FFT) digital signal analyzer to yield high-resolution resonance frequen-cies. A diagram of the experimental setup is shown in Fig.2.
A normal staple for a stapler shown in Fig.3 (MAX CO., LTD. MAX STAPLES NO.3-3 M, 0.057 g) was used as the concentrated mass and was driven into the specimen at x=0 on the RT plane. Two staples were used for 0–24 h and one staple was used under the air-dried con-dition. The specimen weight is smaller at the air-dried condition than the initial condition. The accuracy of the vibration method with additional mass is low for large l
[10, 14]. Hence, one staple was used for the air-dried condition, so thatlis not too large. The values oflwere 0.00195–0.00430, which were calculated using the masses of the staple and the specimen.
Table 1 Steps of vibration tests
Step Dimension Weight Vibration test
Specimen M Longitudinal Bending
WithoutM WithM WithoutM WithM
1 s s
2 s
3 s
4 s
5 s s
6 s
7 s
8 s
9 s s
10 s
11 s
12 s
13 s
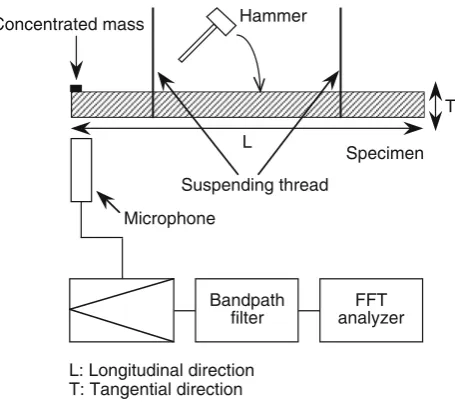
Bending vibration test
To obtain the Young’s modulus by bending, free–free bending vibration tests were conducted on the specimen with and without the concentrated mass using the following procedure. The test bar was suspended by two threads at the nodal positions of free–free vibration corresponding to its first resonance mode, and then, the bending vibration was generated by tapping the LR plane of the bar at one end using the same wooden hammer used for the longitu-dinal vibration test, while bar motion was detected by a microphone at the other end. The signal was processed through the FFT digital signal analyzer to yield high-res-olution resonance frequencies (Fig.4).
An iron plate with dimensions of 2 mm93 mm9 25 mm (1.29 g) was used as the concentrated mass and was bonded atx=0 on the LR plane of the specimen with two-sided adhesive tape. The values oflwere 0.0272–0.0649, which were calculated using the masses of the staple and the specimen.
Results and discussion
The means (standard deviations) of the density obtained using weight and volume of the specimen and the Young’s modulus using free–free longitudinal vibration without the concentrated mass were 521 (47.4) kg/m3and 17.0 (2.32) GPa, respectively, when the specimen weight became constant.
The ratios of weight, density, and Young’s modulus, estimated by the vibration method with additional mass, to those obtained by the normal method without the concen-trated mass (W/W0, q/q0, E/E0) were examined. The
weight, density, and Young’s modulus by the normal method W0,q0, and E0were obtained as follows. Weight
W0 was actual measurement. Density q0 was calculated
fromW0and volume of the specimen. Young’s modulusE0
was calculated using Eqs. (1a), (1b), (5a), and (5b). Res-onance frequency was measured without the concentrated mass. These three ratios all show the same values (W/ W0=q/q0=E/E0).
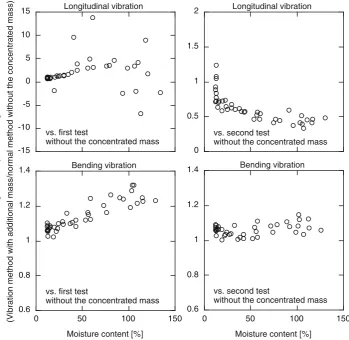
Figure5shows all results of the changes in the ratios of W/W0,q/q0, and E/E0during drying at 20°C and 65% R.
H. When the resonance frequencies without the concen-trated mass were values obtained from the first longitudinal and bending vibrations (steps 2 and 8), the ratio approached 1 as the moisture content decreased. On the other hand, the ratios were around 1 throughout the drying process when the resonance frequencies without the concentrated mass were values obtained from the second longitudinal and bending vibrations (steps 6 and 12). Therefore, the reso-nance frequency without the concentrated mass should be measured after measuring the resonance frequency with the concentrated mass.
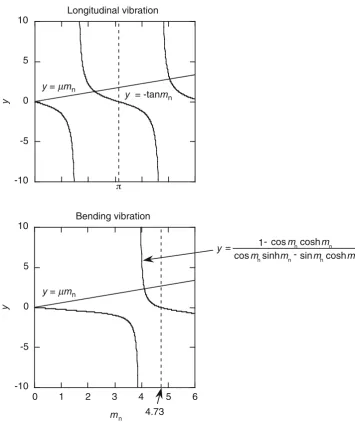
These trends were caused by the increase in the reso-nance frequency during the steps 1–13 as a result of the drying process. Equations (2a) and (2b) are as follows for a =0:
lmn¼ tanmnðLongitudinalÞ; ð7aÞ
lmn¼
1cosmncoshmn
cosmnsinhmnsinmncoshmn
ðBendingÞ: ð7bÞ
Microphone
Specimen Concentrated mass
Bandpath filter
FFT analyzer
Hammer
Sponge L
T
L: Longitudinal direction T: Tangential direction
Fig. 2 Schematic diagram of the experimental setup for the free–free
longitudinal vibration test
11.5 mm 6 mm
Fig. 3 Staple used for the longitudinal vibration test
Microphone
Specimen Concentrated mass
Bandpath filter
FFT analyzer Hammer
Suspending thread L
T
L: Longitudinal direction T: Tangential direction
Fig. 4 Schematic diagram of the experimental setup for the free–free
Here, the resonance frequency of the first mode is con-sidered. When the resonance frequency with the concen-trated massf1approaches the resonance frequency without
the concentrated mass f10, with f1\f10,m1approaches p
[Longitudinal vibration, Eq. (6a)] and 4.73 [Bending vibration, Eq. (6b)]. For these cases,lapproaches 0, and the weight of the specimen from Eq. (3) is very large, as shown in Fig.6. Whenf1[f10,m1is larger thanp(Longitudinal)
and 4.73 (Bending). For these cases,l\0 and the weight of the specimen, from Eq. (3), is less than 0, shown in Fig.6. Therefore, the accuracy of the vibration method with addi-tional mass was high when the resonance frequencies with-out the concentrated mass were values from the second longitudinal and bending vibrations (steps 6 and 12).
The ratios for the bending vibration test were nearer 1 than those for the longitudinal vibration test (Fig.5). This result can be explained by the error in measuring resonance frequencies with and without the concentrated mass, as hereafter. From Eqs. (6a) to (6b),
y¼pxðLongitudinalÞ; ð8aÞ
y¼4:73pffiffiffixðBendingÞ; ð8bÞ
where x=f1/f10, y=m1. Consequently, the following
equations are obtained. dy
dx¼pðLongitudinalÞ; ð9aÞ
dy dx¼
2:365 ffiffiffi x
p ðBendingÞ: ð9bÞ
The mean (standard deviation) of f1/f10 was 0.936
(0.0133) for steps 8, 10, and 12. Substituting this value into Eq. (9b) gives dy/dx=2.44 for bending. Thus, dy/ dx of the longitudinal vibration is by 29% greater than that of the bending vibration, which means that the error inm1of the bending vibration is smaller than that
of the longitudinal vibration. Therefore, the results of the bending vibration test are more accurate than those of the longitudinal vibration test. However, applying the bending vibration test to each piled lumber is dif-ficult, and this issue should be explored further in the future.
-15 -10 -5 0 5 10
15 Longitudinal vibration
vs. first test
without the concentrated mass
Ratios of weight, density and Young's modulus
(Vibration method with additional mass/normal method without the concentrated mass)
0 0.5 1 1.5
2 Longitudinal vibration
vs. second test
without the concentrated mass
0.6 0.8 1 1.2 1.4
0 50 100 150
Bending vibration
vs. first test
without the concentrated mass
Moisture content [%]
0.6 0.8 1 1.2 1.4
0 50 100 150
Bending vibration
vs. second test
without the concentrated mass
Moisture content [%]
Fig. 5 Ratios of weight,
density, and Young’s modulus estimated by the vibration method with additional mass to those obtained by the normal method without the
Conclusions
The resonance frequencies with and without the concen-trated mass were measured by longitudinal vibration and bending vibration tests while drying specimens in condi-tions of 20°C and 65% R. H. and weight, density, and Young’s modulus were estimated. The following results were obtained:
1. The accuracy of the estimation was affected by the increase in the resonance frequency during the vibra-tion tests because of drying.
2. The resonance frequency without the concentrated mass should be measured after the measurement of the resonance frequency with the concentrated mass. 3. The accuracy of the bending vibration test estimation
was higher than that of the longitudinal vibration test. This was explained by the error caused by measuring
resonance frequencies with and without the concen-trated mass.
Acknowledgements This study was supported by JSPS KAKENHI
Grant number JP15K07522.
References
1. Chai GB, Low KH (1993) On the natural frequencies of beams carrying a concentrated mass. J Sound Vib 160:161–166 2. Low KH, Lim TM, Chai GB (1993) Experimental and analytical
investigations of vibration frequencies for center-loaded beams. Comput Struct 48:1157–1162
3. Low KH (1994) An equivalent-center method for quick fre-quency analysis of beams carrying a concentrated mass. Comput Struct 50:409–419
4. Skrinar M, Umek A (1994) The influence of an added mass to a change of eigenfrequencies. J Mech Eng 11:443–450
-10 -5 0 5 10
Longitudinal vibration
y
-10 -5 0 5 10
0 1 2 3 4 5 6
Bending vibration
y
mn
y = µmn
4.73
y = -tanmn
y = µmn
y= 1- cosmncoshmn cosmnsinhmn- sinmncoshmn
Fig. 6 Effect of resonance
5. Skrinar M (2002) On elastic beams parameter identification using eigenfrequencies changes and the method of added mass. Comput Mater Sci 25:207–217
6. Kubojima Y, Tonosaki M, Yoshihara H (2003) Effect of the additional mass applied at an end of a wooden beam on its flexural vibrational properties. Wood Ind 58:370–372
7. Kubojima Y, Tonosaki M, Yoshihara H (2005) Effect of additional mass on Young’s modulus of a wooden beam. J Test Eval 33:278–282 8. Tu¨rker T, Bayraktar A (2008) Structural parameter identification of fixed end beams by inverse method using measured natural frequencies. Shock Vib 15:505–515
9. Kubojima Y, Suzuki Y, Tonosaki M (2014) Effect of additional mass on the apparent Young’s modulus of a wooden bar by longitudinal vibration. BioRes 9:5088–5098
10. Kubojima Y, Sonoda S (2015) Measuring Young’s modulus of a wooden bar using longitudinal vibration without measuring its weight. Eur J Wood Wood Prod 73:399–401
11. Matsubara M, Aono A, Kawamura S (2015) Experimental iden-tification of structural properties of elastic beam with
homogeneous and uniform cross section. Trans JSME. doi:10. 1299/transjsme.15-00279
12. Kubojima Y, Kato H, Tonosaki M, Sonoda S (2016) Measuring Young’s modulus of a wooden bar using flexural vibration without measuring its weight. BioRes 11:800–810
13. Matsubara M, Aono A, Ise T, Kawamura S (2016) Study on identification method of line density of the elastic beam under unknown boundary conditions. Trans JSME. doi:10.1299/trans jsme.15-00669
14. Sonoda S, Kubojima Y, Kato H (2016) Practical techniques for the vibration method with additional mass Part 2: experimental study on the additional mass in longitudinal vibration test for timber measurement. In: CD-ROM Proceedings of the World conference on timber engineering (WCTE 2016)