O R I G I N A L A R T I C L E
Improved Ma¨ule color reaction provides more detailed
information on syringyl lignin distribution in hardwood
Daichi Yamashita1•Satoshi Kimura2,3•Masahisa Wada1,3•Keiji Takabe1
Received: 14 August 2015 / Accepted: 21 December 2015 / Published online: 8 February 2016
ÓThe Japan Wood Research Society 2016
Abstract The traditional Ma¨ule color reaction was improved by use of tris(hydroxymethyl) aminomethane-hydrochloride acid (Tris–HCl) buffer coupled with a fluo-rescence microscope. The purple-red color of Ma¨ule-trea-ted hardwood was more stable with the novel treatment than with traditional treatment. In addition, Ma¨ule-treated wood samples had a characteristic fluorescence when excited with blue (460–495 nm) light. Examination of white birch (Betula platyphylla) showed that syringyl-rich and guaiacyl-rich cell walls emitted red and yellow fluo-rescence, respectively. Measuring the fluorescence spectra of hardwood and softwood powders after treatment with the new Ma¨ule reagents showed that hardwood powder containing syringyl lignin emitted a red fluorescence, whereas softwood powder containing guaiacyl lignin emitted a green fluorescence when excited with blue light. In conclusion, this improved technique has many advan-tages compared with the traditional Ma¨ule color test.
Keywords Ma¨ule color testLigninFluorescence Color reaction
Introduction
The cell walls of wood consist of three main components: cellulose, hemicellulose, and lignin. Lignin accounts for 20–35 % of the dry weight of cell walls, and provides wood with hardness, hydrophobicity, and resistance to biochemical invasion. Lignin is a hetero-polymer and contains three types of unit, called as syringyl, guaiacyl, andp-hydroxyphenyl units. The amount of lignin and ratio of these units in cell walls result from cell differentiation and affect the chemical or physical properties of the cell wall. Therefore, the ability to predict lignin distribution and the unit ratio in the cell walls of woody plants is important. Because microscopic analysis provides useful informa-tion on the existence and distribuinforma-tion of cell wall compo-nents, many methods for microscopic examination have been developed to detect lignin. Lignin typically absorbs ultraviolet (UV) light; thus, a UV microscope is a powerful tool for its detection [1]. Some chemical reagents can provide information on the existence of lignin. For exam-ple, potassium permanganate (KMnO4) is often used to investigate cell wall lignification by transmission electron microscopy [2]. Staining with acriflavine [3] or safranine [4] can permit the detection of lignin because fluorescent coloration can indicate the concentration ratio of lignin and cellulose. However, these staining methods cannot be used to identify specific structure of lignin. Other methods have been used to detect specific structures in lignin. The Wiesner reaction (phloroglucinol-HCl reaction) can be used to detectO-4-linked coniferyl and sinapyl aldehydes in lignin [5]. The Ma¨ule color test, which is performed by Part of this report was presented at the IAWPS International
Symposium on Wood Science and Technology 2015, Tokyo, March 2015.
& Keiji Takabe
kjtakabe@kais.kyoto-u.ac.jp
1 Division of Forest and Biomaterials Science, Graduate
School of Agriculture, Kyoto University, Kyoto 606-8502, Japan
2 Laboratory of Biomass Morphogenesis and Information,
Research Institute for Sustainable Humanosphere, Kyoto University, Kyoto 611-0011, Japan
3 Department of Plant and Environmental New Resources,
College of Life Sciences, Kyung Hee University, 1, Seocheon-dong, Giheung-ku, Yongin-si,
sequential treatment with potassium permanganate, hydrochloride, and aqueous ammonia, is one of the most useful methods for detecting lignin. This method produces purple-red emissions with hardwood samples, and has been widely used to distinguish hardwoods from softwoods. Meshituka and Nakano [6–8] reported that the purple-red color is due to 3-methoxy-o-quinone structures generated from syringyl lignin. Iiyama and Pant [9] suggested thatb -ether cleavage under permanganate oxidation can liberate the syringyl groups and generate the Ma¨ule color that is emitted. These reports show that the Ma¨ule treatment is effective for detecting syringyl lignin. However, the Ma¨ule reaction has several flaws including rapid color fading, leaching of colored lignin into aqueous ammonia, and swelling or breaking of tissue samples. Thus, although it is a useful technique, many improvements are needed.
In this study, we compared the traditional method, which uses aqueous ammonia, with this new Ma¨ule tech-nique, which uses tris(hydroxymethyl)aminomethane–hy-drochloride acid (Tris–HCl) buffer, to develop color and examine the fluorescence of wood samples excited with blue light.
Materials and methods
Samples
The specimens used in this study were sapwoods of white birch (Betula platyphylla), Japanese cedar (Cryptomeria japonica), and Japanese oak tree (Quercus crispula).
The white birch was harvested at the Tohoku Research Center of Forestry and Forest Products Research Institute. Twentylm thick transverse and radial sections of the white birch were prepared with a sliding microtome. In addition, the birch sample was embedded in methacrylate resin and the 1lm thick transverse section was cut for an UV microscope. Embedding in the methacrylate resin was carried out as followed. The small pieces of samples were dehydrated with ethanol-graded series. The dehydrated samples were substituted in absolute acetone, then in methacrylate resin (n-butyl methacrylate: methyl methacrylate=7:3, containing 1.5 % of benzyl peroxide as initiator), and polymerized at 50°C for overnight in gelatin capsule. After preparing sections, the resin was dissolved with acetone. For measuring fluorescence spec-tra, wooden powder was obtained from birch using Willey mill (1024 J-A, Yoshida Seisakusho Co., Ltd, Japan). The powder was sieved into*177 lm in diameter.
The oak trees were harvested at the Field Science Education and Research Center of Kyoto University in the Ashiu Forest Research Station on July 25, 2014, and were used for the observation of cambium and differentiating
xylem. Specimens were obtained at breast height of the tree, and fixed with 2.5 % paraformaldehyde containing 50 mM KPB and 0.4 M sucrose. After fixation, the samples were washed in distilled water and stored in 30 % ethanol until subsequent analysis. Forty lm thick transverse sec-tions of Japanese oak tree were obtained using a freezing microtome. In addition, thin transverse sections were obtained from the sample embedded in LR White resin. The sections were prepared as serial sections that thickness was 5 and 3lm alternately. Embedding in LR White resin was conducted by washing the sample for 30 min with 50 mM potassium phosphate buffer and four times with 0.4 M sucrose. Next, specimens were dehydrated with an ethanol-graded series. The dehydrated specimens were substituted in 25, 50, and 75 % LR White resin for 24 h for each step, and then embedded in 100 % LR White resin.
The Japanese cedar was harvested at Kyoto, Japan. Wooden powder obtained as the same way for birch was used for measuring fluorescence spectra of Ma¨ule-treated softwood.
Ma¨ule treatment
Traditional Ma¨ule samples were treated with 1 % KMnO4 aqueous solution for 5 min, washed with distilled water three times, treated with 1 N hydrochloric acid for 30 min, and then washed with distilled water. To generate a color reaction, 28 % aqueous ammonia was added to the sections mounted on glass slides and covered with cover slips. For samples treated using the new Ma¨ule method, Tris–HCl buffer (pH 8, 1 M) was used instead of aqueous ammonia to generate color.
Microscopic observation
Twenty lm thick Ma¨ule-treated birch sections were pho-tographed under a light or fluorescence microscope (LX71; Olympus, Japan). Fluorescence was excited by blue light (460–495 nm) and observed at a wavelength [510 nm using a filter cube (U-MWIB filter cube; Olympus, Japan). The observation was done within 15 min following color development. To examine the speed of color fading, birch samples were photographed 0–10, 30–40, and 60–70 min after color development. These experiments were repeated at least three times. The sections obtained from other part in the same log were also examined for confirmation. Then, 1 lm thick transverse sections of resin-embedded birch were observed under a UV microscope (UMSP-80; Carl Zeiss, Germany) with absorbance at 280 nm for observing lignin distribution in vessels.
treated at same time and photographed within 15 min after treatment finished. These experiments were repeated at least 3 times in different days. For detecting the fiber that secondary cell wall formation started, the section that had 3lm thickness following next 5lm thickness section was photographed under a polarizing microscope (BHA-751P, Olympus, Japan). Three pairs of serial sections obtained from three different blocks were examined.
Measurement of visible light absorption spectra using new Ma¨ule regents
In total, 20 mg of 20lm thick transverse sections of birch was treated with traditional Ma¨ule or new Ma¨ule reagents
in 1 mL sample tubes. The samples were centrifuged (20,0009g, 1 min) between each step. After developing color, visible light absorption spectra of supernatant were measured with a UV–visible light spectrometer (UV-1600; Shimadzu, Japan).
Measurement of fluorescence spectra after Ma¨ule reaction
After wood powders of birch or cedar treated with tradi-tional or new Ma¨ule reagents were centrifuged to obtain precipitates, moist samples were set on a frost glass sample holder, which is usually used in X-ray diffractometry. Fluorescence spectra were measured after excitation at
480 nm using a fluorescence spectrometer (RF-5300PC; Shimadzu, Japan).
Results and discussion
Effects of changing reagents and observation methods
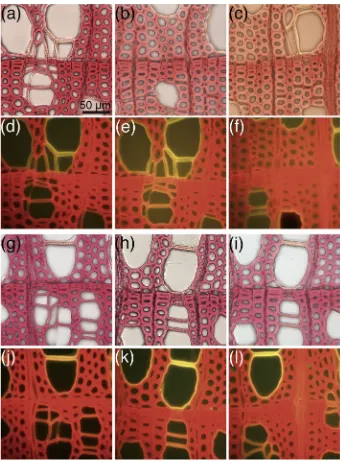
The transverse sections of white birch sapwood treated using the traditional or new Ma¨ule treatment showed similar purple-red color under white light (Fig.1). Regarding color fading, we found that the purple-red color developed with traditional Ma¨ule reagents faded within 30–60 min (Fig.1b) and that the reagents were red after 60 min, whereas purple-red colors developed with new Ma¨ule reagents did not fade, even after 60 min and the reagents were not colored (Fig.1h, i). The change in reagents resulted in resistance to fading over time. Figure2 shows the visible light absorption of colored Ma¨ule reagents obtained as supernatants from 20 mg of birch transverse sections. The purple-red color of the Ma¨ule reaction has the maximum absorption spectrum at 520 nm. The absorption of the new Ma¨ule reagent was less than half of that found for the traditional Ma¨ule reagent at 520 nm. These results show that the new reagent extracted less visible-colored lignin from the cell wall.
When Ma¨ule-treated white birch was observed under blue light (460–495 nm), cell walls showed characteristic fluorescence (Fig.1d–f, j–l). The cell walls of wood fibers, ray, and axial parenchyma emitted a red fluorescence, whereas the vessel cell wall emitted a yellow to red fluo-rescence. Figure3shows the photograph of the area around the annual ring boundary in white birch section after Ma¨ule
treatment. The fluorescence colors in the vessel cell walls were yellow in earlywood and became more reddish in latewood. Takabe et al. [10] reported that the proportion of guaiacyl units in vessel secondary walls is high for early-wood and lower in lateearly-wood. Therefore, the difference in colors for vessel cell walls indicates that the ratio of the syringyl to guaiacyl (S/G ratio) is lower for earlywood and higher for latewood. In addition, the pit membranes in the vessel cell walls showed a green fluorescence color, which was different from the yellow fluorescence of the vessel secondary cell walls. This suggests that S/G ratio of lignin in pit membranes differs from that found in the vessel secondary wall. When the thin section of white birch was observed under a UV microscope, the pit membrane had higher absorbance than the other cell walls (Fig.4), which suggests that the pit membrane has a larger amount of lignin, or a higher ratio of guaiacyl lignin. Thus, the green color in the pit membrane of this birch sample might be due to a very high proportion of guaiacyl lignin. This method provided other valuable information. Tylosis had a green fluorescence in some vessels, although cell walls of the vessel emitted a red fluorescence in the thin innermost layer (Fig.5).
The radial section of birch following Ma¨ule treatment is shown in Fig.6. When the section was observed with blue light excitation, the inter-vessel cell walls showed a heterogeneous fluorescence (Fig.6b), which was not clar-ified by light microscopy (Fig.6a). The cell walls of
400 450 500 550 600 650 700
0
5
10
15
20
wave leangth (nm)
absorbance (abs/sample−ng)
Tris−HCl
NH3
Fig. 2 The visible light absorbance of colored reagents after the traditional Ma¨ule treatment (red lineaqueous ammonia) and the new Ma¨ule treatment (black line Tris–HCl buffer); 520 nm is the maximum adsorption of lignin after Ma¨ule treatment
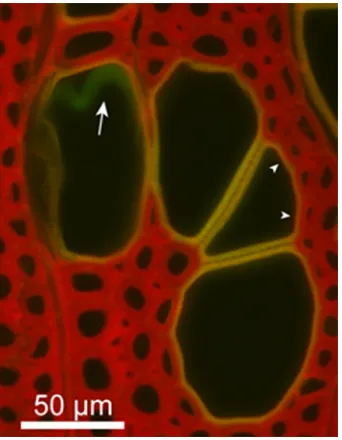
vessels mainly had a yellow fluorescence, whereas inter-vessel cell walls emitted a green fluorescence particularly around the vessel perforation. The pit membrane demon-strated a green fluorescence (Fig.6c, arrow) that was similar to that shown in Fig.3. This suggests that vessel cell walls have a guaiacyl-rich area, and their lignification can be heterogeneous.
Fluorescence spectra of Ma¨ule-treated wood powders
For the purpose of defining the wavelength of fluorescence color in Ma¨ule-treated samples, fluorescence spectra were
measured. The fluorescence spectra of birch and cedar powders are shown in Fig.7. Both wood powders treated with aqueous ammonium showed a green fluorescence, which peaked at 540 nm when the specimens were excited by blue light (480 nm). After traditional or new Ma¨ule treatment, birch wood samples showed a red fluorescence that peaked at 635 or 645 nm, respectively. These small differences in maximum peak wavelength might have occurred due to the difference in pH of the two reagents. The yellow fluorescence was not observed in spectra obtained from wood powders, whereas the microscopic observation showed a yellow color in vessel cell walls. It should be noted that this spectrum was an average of spectra from various kinds of cell walls, and vessel cell walls containing guaiacyl lignin were only a small part of the sample. On the other hand, the spectra of Japanese cedar, in which lignin was mostly composed of guaiacyl units, had a maximum peak at 550 nm after Ma¨ule treat-ment, whereas the untreated sample peaked at 540 nm due to autofluorescence. The fluorescence at 540 and 550 nm is Fig. 4 Ultraviolet (UV) microscopic photograph of the birch vessel
wall. Pit membrane (arrow) and tylosis cell walls (arrowhead) had higher UV adsorptions than the vessel cell walls.Ffiber,Vvessel
Fig. 5 Vessel walls of birch treated with new Ma¨ule reagents and photographed with blue light excitation. Tylosis showed a green fluorescence (arrow), although the innermost layer of the vessel cell wall showed a red fluorescence (arrowhead)
yellow-green. Hence, syringyl lignin shows a red cence and guaiacyl lignin shows a yellow-green fluores-cence. The yellow fluorescence in the vessel cell walls of birch wood might be due to a mixture of red and green fluorescence.
Application to samples that are difficult to analyze
The new Ma¨ule methods improved the observation of lig-nin, and emitted colors reflecting the difference of lignin. Figure8 shows light and fluorescence microscopic pho-tographs of transverse sections (40lm thick) of Japanese oak, including the cambial zone after new Ma¨ule treatment. The guaiacyl-rich cell walls have a brownish color after standard Ma¨ule treatment. With this new treatment, the cambial zone and cell-enlarging zone showed a brownish color when observed under white light. Therefore, infor-mation on the distribution of guaiacyl lignin could not be obtained from this picture (Fig.8a). However, when the same section was observed under a fluorescence micro-scope, the cell walls in secondary wall formation showed a yellow-green florescence and became reddish following cell wall formation (Fig.8b). Thus, this new method can detect the accumulation of syringyl lignin after the accu-mulation of guaiacyl lignin. Therefore, the new method coupled with fluorescence microscopy can be used to confirm the existence of lignin, similar to that found using UV adsorption. However, our new method has useful advantages such as simultaneously being able to visually assess syringyl and guaiacyl lignin distributions, while distinguishing false brown color emissions that result from permanganate oxidation.
This method can also be used to observe lignin distri-bution in thin, resin-embedded sections. The semi-thin (5lm thick) transverse section obtained from Japa-nese oak embedded in LR White resin was treated with new Ma¨ule reagents and emitted a weak red fluorescence when observed under a fluorescence microscope (Fig.9). It was difficult to observe the lignin distribution under white light because the cell walls were pale pink (data not shown). Resin-embedded semi-thin sections enabled us to observe the cell wall formation under a polarizing micro-scope. Because the outer layer of the secondary wall (S1) has birefringence, the start of S1formation can be detected under a polarizing microscope, because the microfibril orientation is parallel to the transverse plane. The fibers in the S1-forming stage did not show a red or yellow-green fluorescence. As secondary wall formation proceeded, the cell wall began to emit a green fluorescence in 6–8 cells beyond the S1forming cell and became a reddish fluores-cence after 9–10 cells. This indicates that lignification in secondary walls starts with an accumulation of guaiacyl lignin lagging behind S1formation, followed by accumu-lation of syringyl lignin in a few cells following those that begin guaiacyl lignin accumulation.
540nm
635nm
645nm
540nm
547nm
500 550 600 650 700
Intensity (a.u.)
wave length (nm)
(a)
(b)
(c)
(d)
(e)
(f)
Conclusions
Using a Tris–HCl buffer instead of ammonia in the Ma¨ule reaction results in similar color development as that found using the traditional method. In addition, this new method is resistant to color fading with time. Moreover, evaluation after blue light excitation (around 480 nm) improves the observation of lignification and lignin distribution, because
syringyl lignin emits red fluorescence (around 640 nm) and guaiacyl lignin fluoresces yellow-green (*550 nm). Our method provides visual information on the heterogeneous distribution of lignin in hardwoods. The analysis of woody anatomy would be improved using this novel Ma¨ule method.
Acknowledgments This work was supported by the Grant-in-Aid for JSPS Fellows (26–11122).
References
1. Scott JAN, Procter AR, Fergus BJ, Goring DAI (1969) The application of ultraviolet microscopy to the distribution of lignin in wood. Description and validity of the technique. Wood Sci Technol 3:73–92
2. Bland DE, Foster RC, Logan AF (1971) Mechanism of per-manganate and osmium tetroxide fixation and distribution of lignin in cell wall ofPinusradiata. Holzforschung 25(5):137–143 3. Donaldson L, Hague J, Snell R (2001) Lignin distribution in coppice poplar, linseed and wheat straw. Holzforschung 55(4):379–385
4. Bond J, Donaldson L, Hill S, Hitchcock K (2007) Safranine fluorescent staining of wood cell walls. Biotech Histochem 83(3–4):161–171
5. Pomar F, Merino F, Ros Barcelo´ A (2002)O-4-Linked coniferyl and sinapyl aldehydes in lignifying cell walls are the main targets of the Wiesner (phloroglucinol-HCl) reaction. Protoplasma 220:17–28
6. Meshitsuka G, Nakano J (1977) Studies on the mechanism of lignin color reaction XI. Ma¨ule color reaction (7). Mokuzai Gakkaishi 23:232–236
7. Meshitsuka G, Nakano J (1978) Studies on the mechanism of lignin color reaction XII. Ma¨ule color reaction (8). Mokuzai Gakkaishi 24:563–568
8. Meshitsuka G, Nakano J (1979) Studies on the mechanism of lignin color reaction XIII. Ma¨ule color reaction (9). Mokuzai Gakkaishi 25:588–594
9. Iiyama K, Pant R (1988) The mechanism of Ma¨ule colour reac-tion Introducreac-tion of methylated syringyl nuclei into softwood lignin. Wood Sci Technol 22:167–175
10. Takabe K, Miyauchi S, Tsunoda R, Fukazawa K (1992) Distri-bution of guaiacyl and syringyl lignins in Japanese beech (Fagus crenata): variation within an annual ring. IAWA Bull 13:105–112
Fig. 8 Transverse sections (40lm thick) of Japanese oak including the cambium zone after being treated using the new Ma¨ule method