www.j-sens-sens-syst.net/5/221/2016/ doi:10.5194/jsss-5-221-2016
© Author(s) 2016. CC Attribution 3.0 License.
Design, characterization, and modeling of
microcirculation systems with integrated oxygenators
Mathias Busek, Stefan Gruenzner, Tobias Steege, Florian Schmieder, Udo Klotzbach, and Frank Sonntag
Fraunhofer IWS, Dresden, Germany
Correspondence to:Mathias Busek ([email protected])
Received: 22 February 2016 – Revised: 17 May 2016 – Accepted: 24 May 2016 – Published: 24 June 2016
Abstract. Here, we describe a microfluidic system for hypoxia assays on human cell culture models. These sys-tems are developed to replace or reduce animal testing in biomedical basic research. The presented system uses a gas-permeable membrane as a gas–liquid interface and a micropump for media actuation to influence the oxygen content in two cell culture chambers. To apply well-defined hypoxic conditions to the cells, a good understanding of the mass transport phenomena is necessary. Therefore, a complete network model of the microfluidic system is presented. This model is validated by means of micro-particle image velocimetry (µPIV) and optical oxygen measurement with fluorescence lifetime detection. Finally, the impact of several process parameters, e.g., the gas permeability of the pump, is discussed using the developed model.
1 Introduction
In the human body, oxygen supply is a key factor influenc-ing cell vitality and growth. An oxygen restriction is called hypoxia and induces several changes in cell metabolism. For example, the release of hypoxia inducible factors (HIF) dur-ing hypoxia influences inflammatory processes, e.g., affect-ing tumor growth (Eltzschig and Carmeliet, 2011) or wound healing (Kalucka et al., 2013). A deeper understanding of those processes is therefore of particular interest in medi-cal basic research. Currently, two types of hypoxia assays are widely used: animal models with genetically modified mice (McColm et al., 2004) or static human cell culture mod-els (Richter et al., 2013). Both have several advantages and disadvantages. Animal models, on one hand, feature a com-plete living system with several organs interacting with each other. Unfortunately, recent publications showed that, for ex-ample, substances tested as non-toxic for animals may be harmful for humans in the clinical trials (Knight, 2008). Hu-man cell culture systems, on the other hand, give the op-portunity to observe those processes in human tissue, but the interactions between several organs are not considered. Perfused microfluidic 3-D cell cultivation systems may over-come these issues and should mimic in vivo-like conditions much better than static cell cultivation platforms or animal
models by integrating different human micro-organoids in a closed, artificial microvascular system (Baker, 2011). Based on a microfluidic platform for cell cultivation with integrated micropumps, valves, and reservoirs (Marx et al., 2012) a multilayer-based system was recently developed (Sonntag et al., 2015). The aim is to transfer pharmaceutical and cosmetic substance testing from the animal to this so-called multi-organ chip (MOC). Several human tissue were successfully cultivated within this system, e.g., liver (Maschmeyer et al., 2015), skin (Ataç et al., 2013), and kidney (Schimek et al., 2015). In the present study, an additional oxygenator element is implemented in the microfluidic platform, allowing auto-mated and reproducible hypoxia assays on the chip.
2 Design
layer-by-Figure 1.(a)Exploded view of the microfluidic system;(b)microfluidic layout indicating micropump, oxygenator, and measurement spots (A, B) as well as upstream and downstream valves (α,β);(c)picture of microfluidic system with mounted reservoirs.
layer manufacturing technology of laser-cut polymer foils (Sonntag et al., 2015). The mentioned fluidic actuators are pneumatically driven systems. Therefore, a flexible mem-brane has to be integrated in the microfluidic system, which can be easily displaced with pressure rates up to 100 kPa. A commercially available silicone foil (SILPURAN®FILM 2030, Wacker Chemie AG) with a thickness of 200 microns and high gas permeability is perfectly suited for this applica-tion. In Fig. 1a an exploded view of the microfluidic system with the pneumatic part and mounted reservoirs on top, the elastomeric membrane in the middle and the fluidic part at the bottom is shown.
The complete system is mounted in a cell culture support with two connection elements which include the pneumatic ports. In Fig. 1b the developed microfluidic layout is shown. It features a micropump for fluid actuation and several valves to control the liquid stream. The system can be operated as a flow-through system by closing the bypass valve and open-ing the inlet and outlet valves. Furthermore, a closed circuit operation is possible by opening the bypass valve and closing the inlet and outlet valves, which limits the circulating vol-ume to around 75 µL. Two cell cultivation chambers, A and B (with oxygen sensing spots), are integrated; each is equipped with an upstream and downstream valve (α, β) to control the perfusion to the segment. In previous fluidic designs, the oxygen entry was only performed by the gas-permeable elas-tomeric pump membrane. So the pump acted as a combined flow source and oxygenator (Busek et al., 2015a). This may be problematic especially when gas bubbles are produced, as reported by Godolsky and Knapp (2013). To enhance the oxygen transport capability an additional serpentine-shaped oxygenator element was placed at the center of the microflu-idic system, utilizing the same gas-permeable membrane also used for fluid actuation but providing a much higher gas ex-change areaAO2. The process gas is flushed above the
mem-brane in counterflow to the liquid stream with a flow of sev-eral L min−1to prevent oxygen depletion over the length of the oxygenator. Finally, in Fig. 1c a picture of the bonded sys-tem with mounted reservoirs is shown. A controlling syssys-tem based on an embedded Linux PC was developed switching up to 24 pneumatic outlets, which allows the parallel actu-ation of 8 pneumatic micropumps. Figure 2 shows a block diagram according to ISO-1912-1 (ISO, 2012).
Furthermore, the controller provides up to four electrical heating channels to ensure stable cell cultivation conditions. Several interfaces (USB, CAN, and Ethernet) allow connec-tion to laboratory automaconnec-tion and informaconnec-tion systems or di-rect sensor readout. As shown, an additional oxygenator out-put is provided which mixes two process gases, e.g., oxygen and nitrogen, to provide a controlled media oxygenation at integrated oxygenator elements.
3 Characterization
3.1 Flow measurement with micro-particle image velocimetry (µPIV)
Figure 2.Block diagram of the controlling system.
-100 0 100 200 300 400 500
0 0,4 0,8 1,2 1,6 2
Fl
o
w
v
e
lo
ci
ty
in
m
m
s
Time in s Velocity-time-curve Time averaged velocity: 43 mm s
-100 0 100 200 300 400 500
0 0,4 0,8 1,2 1,6 2
Fl
o
w
v
e
lo
ci
ty
in
m
m
s
Time in s Velocity-time-curve Time averaged velocity: 65 mm s
–1 –1
–1
–1
Figure 3.Velocity–time curve measured at the outlet of the oxygenator for different pumping frequencies (left: 1.2 Hz, right: 2.4 Hz).
(1.2 and 2.4 Hz) as well as their respective time-averaged val-ues are shown. The pump was operated with a pressure of 50 kPa during pump cycles and a pressure of−50 kPa during filling cycles.
It can be seen, that the flow is pulsatile with peak veloci-ties up to 400 mm s−1and that there are time periods where no fluid movement can be observed at all. A detailed descrip-tion and modeling of the micropump was published earlier (Busek et al., 2013). To obtain the time-averaged volumetric flow rate the measured velocity has to be integrated over the time and the channel cross sectionA:
Q=
Z
A
1
T
T
Z
0 v(t) dt
dA
=b×h×vz× h
Z
0
b
Z
0
vnorm(y, z)dydz, (1)
whereh is the channel height,b the channel width,T the duration of one pump cycle (=f−1),vz the time-averaged flow velocity at the channel center, andvnorm(y, z) the
nor-malized flow pattern in both spatial directions. In a tubular channel a parabolic flow pattern can be estimated and the surface integral ofvnorm(y, z) is 0.5. In case of a rectangular
20 40 60
0 100 200 300 400 500
Ox
yg
e
n
c
o
n
te
Time in s
20 40 60
0 100 200 300 400 500
Ox
yg
e
n
c
o
n
te
Time in s
Figure 4.Deoxygenation–oxygenation curve measured at spot B for different pump gases (left: air, right: N2).
3.2 Oxygen measurement with fluorescence lifetime detection
In presence of oxygen, the fluorescence lifetime of several fluorescent dyes is decreased due to quenching (Schmäl-zlin et al., 2005). This decay in the fluorescence lifetime can be utilized to measure the oxygen content in the cham-bers. The experimental setup was described earlier in de-tail (Schmieder et al., 2014). An oxygen sensing spot was placed in each chamber (A and B) and the fluorescence life-time was measured for several minutes. For calibration pur-pose the microfluidic system was flushed with three differ-ent process gases with varying oxygen contdiffer-ents wO2 com-pared to the volume fraction of oxygen in the atmosphere under standard conditions (φO2=20.9 vol %). Those gases were air:wO2 =100 %; reference gas:wO2=47 %; and ni-trogen:wO2=0 %. Afterwards, the microfluidic system was filled with deionized water for the oxygenation and deoxy-genation experiments. During all experiments, the oxygena-tion and deoxygenaoxygena-tion behavior of the system was char-acterized in the same manner. First pure nitrogen was ap-plied to the membrane oxygenator, until the oxygen content at the measurement spots reached a lower boundary value. Then the process gas was changed to compressed air until the oxygen content remained constant. As mentioned previ-ously the oxygenator uses the same membrane as the microp-ump. Therefore, an additional gas exchange at the membrane can be estimated as described earlier (Busek et al., 2015b). The oxygenation–deoxygenation behavior is thus not only influenced by the process gas applied to the oxygenator but also by the oxygen content of the pumping gas. This effect is shown in Fig. 4. One can see the measured oxygen con-tent plotted against pumping time for different pump gases (compressed air, nitrogen). The mass transfer takes place in several minutes. Furthermore, the used pump gas has a sig-nificant influence on the oxygenation–deoxygenation behav-ior of the system.
4 Modeling
The mass transport under pulsatile flow can be described with the dimensionless Reynolds numberReand the Strouhal numberSt(Nishimura et al., 2000). For the described
rectan-gular channel both numbers can be calculated using follow-ing formula:
Re= Q
b×ϑ St=
2π×f×h2×b
Q . (2)
With a kinematic viscosityϑof 1 mm2s−1, a frequencyf of 1 Hz, and the channel dimensions described in Sect. 3.1,Re
is 6 andStis 0.08. Both values are much lower than the crit-ical values (Recrit=1400 andStn=1.92) where turbulence, especially in cavities, can occur, which will enhance mass transport there (Nishimura et al., 2000). Therefore, the flow is laminar and can be seen as quasistatic. One can replace the pulsatile micropump by a constant flow source in the mass transport model.
4.1 Oxygenation coefficient
By keeping the process gas flow at the top of the membrane in the range of several L min−1 oxygen depletion over the length of the oxygenator does not take place because the liq-uid flow is with several µL s−1 much lower. Therefore, the oxygen source concentration is constant and the oxygenation coefficientKO2can be used to characterize the oxygenator
KO2= c(L)
cs,O2
. (3)
KO2is a function of the oxygen concentration at the oxygena-tor outletc(L) and the saturation concentrationcs,O2 which depends on the solubilityαLof oxygen in the liquid and can
be calculated as follows:
cs,O2=αL×pO2. (4)
A high oxygenation coefficient is useful to allow a fast and broad oxygenation and deoxygenation of the culture media but this should be realizable with the presented manufactur-ing technology and with pumpmanufactur-ing rates of several µL s−1.
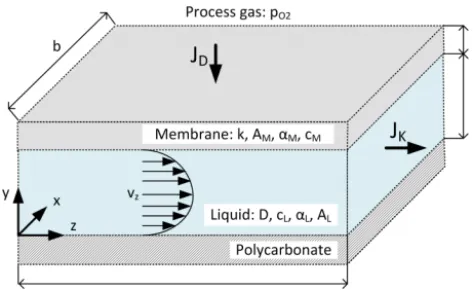
Therefore, a mathematic model describing the membrane-based oxygenator should be found. Mass transport phe-nomena in perfused systems are generally described by the convection–diffusion equation:
δc
Figure 5.Model of the oxygenator.
whereDdescribes the diffusion coefficient,vis the velocity vector, andR is the reactive term. Reaction means here the oxygen uptake of the cells. Because of the fact that there are no cells present in the oxygenator,R can be neglected. Fur-thermore, only the steady state should be considered, mean-ing that δcδt can be set to zero. Equation (5) can be further simplified when we have a look at the geometrical bound-ary conditions of the oxygenator as shown in Fig. 5. With a constant oxygen fluxJDthrough the membrane, the concen-tration gradient inxdirectionδxδc is zero. Therefore, a convec-tive mass transport occurs inzdirection and diffusion mainly occurs in y direction. Now the partial differential equation (PDE) (Eq. 5) only depends on the two Cartesian coordinates
yandz. For a fully developed laminar flow one can formulate the following PDE:
vz(z)×
δ c δ z=D
δ2c
δ y2 =4×vmax
z
h− z
h 2
×δ c
δ z. (6)
Equation (6) is similar to a first-order wall reaction (Pal-lares and Grau, 2014). If the liquid flow is simplified to a plug flow with the mean velocityvz, the velocity does not depend on the y coordinate and the error function is a practicable solution of this PDE (Bird et al., 2007):
c(y, z)=cs,O2
1−erf
y
2qDv z×z
. (7)
The mean oxygen concentration at the oxygenator outlet (cm(z=L)) can be obtained by integrating this equation over the channel heighth. Furthermore, a numerical fit for the error function with the mass transport term f(y, z)=
y
2qvzD×z and the coefficients a1
≈0.27839, a2≈0.23039,
a3≈0.00097,a4≈0.07810 (Abramowitz and Stegun, 1970)
can be used:
erf (f(y, z))≈
1− 1
1+a1×f(y, z)+a2×f2(y, z)+a3×f3(y, z)+a4×f4(y, z)4 (8)
cm(z=L)=cs,O2
1− 1
h×
h
Z
0
erf (f(y, L)) dy
. (9)
Now the oxygenation coefficient can be calculated as fol-lows: for an oxygenator with a lengthL=110 mm, a chan-nel heighth=0.25 mm, a diffusivityD≈2×10⁻³mm2s−1,
and a mean velocityvz≈30 mm s−1the oxygenation coeffi-cient isKO2≈0.38, in alignment with hollow-fiber oxygena-tors widely described in the literature (Kreulen et al., 1993; Dindore et al., 2005).
4.2 Transient oxygen transport through the membrane
Besides the perfused channel area, the oxygenator membrane has a significant influence on the oxygenation and deoxy-genation behavior of the system. When the process gas at the top of the membrane is switched, diffusion processes in the membrane will delay the oxygen exchange at the membrane– liquid interface. Starting from Eq. (5), following PDE can be assumed describing the mass transport in the membrane (no convection):
δ c
δ t =k×d× δ2c
δ y2, (10)
with the membrane thicknessdand the overall oxygen trans-port coefficientk. This factor is composed of the gas–liquid mass transfer ratekG, Land the membrane mass transfer
co-efficientkM and can be calculated as follows (Zhan et al.,
2009):
1
k =
1
ki,L
+ 1
kM
= 1
ki,L
+ d
D, (11)
where D denotes the oxygen diffusivity in the silicone.
For a 200 µm thick membrane and a diffusivity of D≈
3×10⁻³mm2s−1 and ak
i,L ≈0.04 mm s−1 (Shiku et al.,
2006)kis about 0.01 mm s−1. A solution for Eq. (11) at the membrane bottom (y=d) is analogous to Eq. (7) given with the error function
c(d, t)=cs,O2 "
1−erf 1
2 r
d
k×t !#
. (12)
In case of deoxygenation, the source concentrationcs,O2falls to zero and following formula can be assumed:
c(d, t)=cs,O2×erf 1 2
r d k×t
!
Figure 6.SimulationX model of oxygen transport in the microfluidic system.
9
Beside the described membrane oxygenator (Eq. 10, Eq. 13, Eq. 14) it includes a constant flow source (Eq. 1) with an
additional oxygenator element mimicking the gas exchange at the pump membranes. The mathematical description of the
additional oxygen entry is difficult, because the flow pattern in the micro pump is unknown. Therefore the oxygenation
coefficient of the micro pump KO2, pump was obtained from experimental results. Furthermore fluidic resistances representing
the micro channels and additional volume elements are implemented. The flowing liquid is water with the shown parameters 5
(diffusivity D, dynamic viscosity ν and saturation concentration cs). This model can now be used to compare simulated and
measured flow and oxygen values and afterwards an optimization of the fluidic layout can be obtained e.g. by coupling
SimulationX to the optimization tool OptiY (Abid et al., 2015).
4.4 Model validation
In Fig. 7 (left), the oxygen content wO2 (relatively to the atmospheric oxygen volume fraction 20.9 . %) at spot B
10
is shown. The plot shows the calculated values (with the network model and the parameters shown in Fig. 6) and the
measured wO2 values. Similar to the experimental setup described earlier the oxygenator was initially operated with pure
nitrogen for deoxygenation and after around 300 seconds the process gas was changed to air. The modelled results fit the
experimental data with a root mean square deviation of 0.86 %. Therefore the presented model is suitable to simulate the
oxygen transport by the oxygenator and the micro pump within the system. 15
Fig. 7: left: Comparison between modelled and measured oxygen content for deoxygenation with nitrogen and oxygenation with compressed air; right: Impact of pump oxygenation coefficient on oxygenation-deoxygenation behaviour (calculated)
4.5 Impact of pump oxygenation coefficient
The impact of different process parameters on the oxygenation and deoxygenation curves is of great interest, because it 20
shows the best way to manipulate the oxygen content in the cell culture chambers. As mentioned earlier, the parasitic oxygen
entry by the pump is unknown. It is therefore important to examine the influence of this parameter on the
oxygenation-deoxygenation-behaviour of the system. In Fig. 7 (right) this effect is shown for four different pump oxygenation
coefficients KO2, pumpcalculated with the developed network model of the microfluidic system.
50 60 70 80 90 100
0 100 200 300 400 500
Ox
y
g
en
c
o
n
te
n
t
in
%
Time in s
Measured
Modelled
20 40 60 80 100
0 100 200 300 400 500
Ox
y
g
en
c
o
n
te
n
t
in
%
Time in s
kO2=0.1
kO2=0.15 kO2=0.2
kO2=0.25 kO2=0.3
Figure 7.Left: comparison between modeled and measured oxygen content for deoxygenation with nitrogen and oxygenation with com-pressed air; right: impact of pump oxygenation coefficient on oxygenation–deoxygenation behavior (calculated).
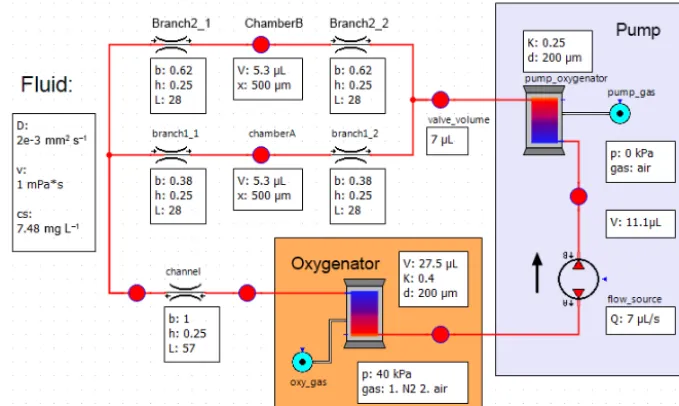
4.3 Network model of the complete microfluidic system
All presented parts of the modeling are included in the mi-crofluidic library for the network simulation tool Simula-tionX (Busek et al., 2015a) using the model description lan-guage Modelica (Fritzson and Engelson, 1998). A complete model of the microfluidic system can be developed as shown in Fig. 6.
Besides the described membrane oxygenator
(Eqs. 10, 13, 14), it includes a constant flow source (Eq. 1) with an additional oxygenator element mimicking the gas exchange at the pump membranes. The mathematical description of the additional oxygen entry is difficult, because the flow pattern in the micropump is unknown. Therefore, the oxygenation coefficient of the micropump
KO2,pump was obtained from experimental results. Further-more, fluidic resistances representing the microchannels and additional volume elements are implemented. The flowing liquid is water with the shown parameters (diffusivity D, dynamic viscosityν, and saturation concentrationcs). This model can now be used to compare simulated and measured
flow and oxygen values and afterwards an optimization of the fluidic layout can be obtained, e.g., by coupling SimulationX to the optimization tool OptiY (Abid et al., 2015).
4.4 Model validation
4.5 Impact of pump oxygenation coefficient
The impact of different process parameters on the oxygena-tion and deoxygenaoxygena-tion curves is of great interest, because it shows the best way to manipulate the oxygen content in the cell culture chambers. As mentioned earlier, the para-sitic oxygen entry by the pump is unknown. It is therefore important to examine the influence of this parameter on the oxygenation–deoxygenation behavior of the system. In Fig. 7 (right) this effect is shown for four different pump oxygena-tion coefficientsKO2,pumpcalculated with the developed net-work model of the microfluidic system.
5 Conclusion and outlook
The aim of this work was to develop a microfluidic system for hypoxia assays in human cell cultures to replace or re-duce animal testing in basic medical research. The presented system uses a gas-permeable membrane as a gas–liquid in-terface and a micropump for media actuation to influence the oxygen content in two cell culture chambers. To apply well-defined hypoxic conditions to the cells, a good understand-ing of the mass transport phenomena is necessary which is why a complete model of the microfluidic system was devel-oped. The flow in the microchannels was measured with a µPIV setup and used as constant flow source in the model. Afterwards the oxygenation and deoxygenation behavior of the system was characterized by applying different process gases to the oxygenator and observing the fluorescence de-cay time in both measurement chambers. A good correlation between measured and calculated oxygen concentrations was achieved, which means that the developed model is suited to calculate the oxygen transport in the microfluidic system. Fi-nally, the impact of the parasitic oxygen entry by the pump was followed up using the developed model. In further in-vestigations the influence of other process parameters, e.g., the process gas pressure should be examined. Moreover, the model can be coupled to an optimization tool to refine the de-sign of the microfluidic system in terms of needed oxygena-tion coefficients, etc. Later on an oxygen consumer, e.g., a high-density 3-D cell culture model, has to be implemented in the microfluidic system. A mathematical model with dif-ferent reaction kinetics is already integrated in the simulation tool. Together with the here-presented oxygenator model it could be used to calculate the steady-state oxygen concen-tration for different oxygen consumption rates or even cell growth as presented in the literature (Ma et al., 2007).
The Supplement related to this article is available online at doi:10.5194/jsss-5-221-2016-supplement.
Acknowledgements. The authors want to express great ap-preciation to the Free State of Saxony and the European Union (SAB project “UNILOC”) as well as to the BMWi (ZIM project “SimFluNet”) for the financial support. The authors also thank the ITI GmbH for their support with the SimulationX platform and the development of the microfluidic library.
Edited by: U. Weimar
Reviewed by: two anonymous referees
References
Abid, H. J., Chen, J., and Nassar, A. A.: Equivalent Air Spring Suspension Model for Quarter-Passive Model of Passenger Ve-hicles, International Scholarly Research Notices, 2015, 1–6, doi:10.1155/2015/974020, 2015.
Abramowitz, M. and Stegun, I. A.: Handbook of mathematical func-tions: With formulas, graphs, and mathematical tables, Dover books on mathematics, Dover Publications, New York, USA, XIV, 1046, 1970.
Ataç, B., Wagner, I., Horland, R., Lauster, R., Marx, U., Tonevit-sky, A. G., Azar, R. P., and Lindner, G.: Skin and hair on-a-chip: in vitro skin models versus ex vivo tissue main-tenance with dynamic perfusion, Lab Chip, 13, 3555–3561, doi:10.1039/c3lc50227a, 2013.
Baker, M.: Tissue models: a living system on a chip, Nature, 471, 661–665, doi:10.1038/471661a, 2011.
Bhatia, S. N. and Ingber, D. E.: Microfluidic organs-on-chips, Na-ture biotechnology, 32, 760–772, doi:10.1038/nbt.2989, 2014. Bird, R. B., Stewart, W. E., and Lightfoot, E. N.: Transport
phenom-ena, Rev. 2nd ed., J. Wiley, New York, xii, 543–582, 2007. Busek, M., Polk, C., Albrecht, T., Marx, U., König, J., and Sonntag,
F.: Automated Micro-PIV measurement in Lab-on-a-Chip sys-tems, Biomed. Tech., 57, 927–930, doi:10.1515/bmt-2012-4064, 2012.
Busek, M., Nötzel, M., Polk, C., and Sonntag, F.: Characterization and simulation of peristaltic micropumps, J. Sens. Sens. Syst., 2, 165–169, doi:10.5194/jsss-2-165-2013, 2013.
Busek, M., Gruenzner, S., Schmieder, F., and Rudolph, A., Hof-mann, K., Grätz, U., and Sonntag, F.: Design and Regulation of Complex Microfluidic Systems with SimulationX, 18th ITI Sym-posium 2015, 2015a.
Busek, M., Hofmann, K., Grätz, U., Rudolph, A., Grünzner, S., Schmieder, F., and Sonntag, F.: Regulating microfluidic-based cell culture systems with the use of network models, Bionection 2015, 2015b.
Dindore, V. Y., Brilman, D., and Versteeg, G. F.: Hollow fiber mem-brane contactor as a gas–liquid model contactor, Chem. Eng. Sci., 60, 467–479, doi:10.1016/j.ces.2004.07.129, 2005. Eltzschig, H. K. and Carmeliet, P.: Hypoxia and inflammation, New
Engl. J. Med., 364, 656–665, doi:10.1056/NEJMra0910283, 2011.
ISO: Fluid power systems and components – Graphical symbols and circuit diagrams – Part 1: Graphical symbols for conventional use and data-processing applications, 2012.
Kalucka, J., Ettinger, A., Franke, K., Mamlouk, S., Singh, R. P., Farhat, K., Muschter, A., Olbrich, S., Breier, G., Katschinski, D. M., Huttner, W., Weidemann, A., and Wielockx, B.: Loss of ep-ithelial hypoxia-inducible factor prolyl hydroxylase 2 accelerates skin wound healing in mice, Mol. Cell. Biol., 33, 3426–3438, doi:10.1128/MCB.00609-13, 2013.
Knight, A.: Systematic reviews of animal experiments demonstrate poor contributions toward human healthcare, Reviews on recent clinical trials, 3, 89–96, 2008.
Kreulen, H., Smolders, C. A., Versteeg, G. F., and van Swaaij, W.: Microporous hollow fibre membrane modules as gas-liquid con-tactors. Part 1. Physical mass transfer processes, J. Membrane Sci., 78, 197–216, doi:10.1016/0376-7388(93)80001-E, 1993. Lindken, R., Rossi, M., Grosse, S., and Westerweel, J.:
Micro-Particle Image Velocimetry (microPIV): recent develop-ments, applications, and guidelines, Lab Chip, 9, 2551–2567, doi:10.1039/B906558J, 2009.
Ma, C. Y. J., Kumar, R., Xu, X. Y., and Mantalaris, A.: A com-bined fluid dynamics, mass transport and cell growth model for a three-dimensional perfused biorector for tissue engi-neering of haematopoietic cells, Biochem. Eng. J., 35, 1–11, doi:10.1016/j.bej.2006.11.024, 2007.
Marx, U., Walles, H., Hoffmann, S., Lindner, G., Horland, R., Sonntag, F., Klotzbach, U., Sakharov, D., Tonevitsky, A., and Lauster, R.: “Human-on-a-chip” developments: a translational cutting-edge alternative to systemic safety assessment and effi-ciency evaluation of substances in laboratory animals and man?, ATLA-Altern. Lab. Anim., 40, 235–257, 2012.
Maschmeyer, I., Hasenberg, T., Jaenicke, A., Lindner, M., Lorenz, A. K., Zech, J., Garbe, L.-A., Sonntag, F., Hayden, P., Ayehunie, S., Lauster, R., Marx, U., and Materne, E.-M.: Chip-based human liver–intestine and liver–skin co-cultures – A first step toward systemic repeated dose substance testing in vitro, Eur. J. Pharm. Biopharm., 77–87, doi:10.1016/j.ejpb.2015.03.002, 2015. McColm, J. R., Cunningham, S., Wade, J., Sedowofia, K., Gellen,
B., Sharma, T., McIntosh, N., and Fleck, B. W.: Hypoxic oxy-gen fluctuations produce less severe retinopathy than hyperoxic fluctuations in a rat model of retinopathy of prematurity, Pediatr. Res., 55, 107–113, doi:10.1203/01.PDR.0000099772.66376.02, 2004.
Nishimura, T., Oka, N., Yoshinaka, Y., and Kunitsugu, K.: Influence of imposed oscillatory frequency on mass transfer enhancement of grooved channels for pulsatile flow, Int. J. Heat Mass Tran., 43, 2365–2374, doi:10.1016/S0017-9310(99)00311-7, 2000.
doi:10.1016/j.ijheatmasstransfer.2013.10.040, 2014.
Richter, S., Qin, N., Pacak, K., and Eisenhofer, G.: Role of hypoxia and HIF2αin development of the sympathoadrenal cell lineage and chromaffin cell tumors with distinct catecholamine pheno-typic features, Advances in pharmacology (San Diego, CA), 68, 285–317, doi:10.1016/B978-0-12-411512-5.00014-2, 2013. Schimek, K., Sonntag, F., Lauster, R., and Marx, U.: A
four-organ-chip for interconnected long-term co-culture of human intestine, liver, skin and kidney equivalents, Lab Chip, 15, 2688–2699, doi:10.1039/C5LC00392J, 2015.
Schmälzlin, E., van Dongen, J. T., Klimant, I., Marmodée, B., Steup, M., Fisahn, J., Geigenberger, P., and Löh-mannsröben, H.-G.: An optical multifrequency phase-modulation method using microbeads for measuring intracellular oxygen concentrations in plants, Biophys. J., 89, 1339–1345, doi:10.1529/biophysj.105.063453, 2005.
Schmieder, F., Grünzner, S., Winkelmann, C., and Sonntag, F.: Hol-low fiber-based Lab-on-a-chip perfusion system with integrated fluorescence-based oxygen monitoring, 2nd International Con-ference on Microfluidic Handling, 8–10 October 2014, Freiburg, Germany, 2014.
Shiku, H., Saito, T., Wu, C.-C., Yasukawa, T., Yokoo, M., Abe, H., Matsue, T., and Yamada, H.: Oxygen Permeability of Surface-modified Poly(dimethylsiloxane) Characterized by Scanning Electrochemical Microscopy, Chem. Lett., 35, 234– 235, doi:10.1246/cl.2006.234, 2006.
Sommer, C.: Die Größenabhängigkeit der Gleichgewichts-geschwindigkeit von Partikeln beim Transport in Mikrokanälen., Promotion, Fachbereich Physik, TU Darmstadt, Darmstadt, Germany, 2014.
Sonntag, F., Grünzner, S., Schmieder, F., Busek, M., Klotzbach, U., and Franke, V.: Multilayer based lab-on-a-chip-systems for sub-stance testing, in: SPIE LASE, edited by: Klotzbach, U., Washio, K., and Arnold, C. B., San Francisco, CA, United States, 7 Febru-ary 2015, SPIE Proceedings, SPIE, 93510C, 2015.