R E S E A R C H
Open Access
Government resource contributions to the
private-not-for-profit sector in Uganda:
evolution, adaptations and implications for
universal health coverage
Aloysius Ssennyonjo
1, Justine Namakula
1, Ronald Kasyaba
2, Sam Orach
2, Sara Bennett
3and Freddie Ssengooba
1*Abstract
Background:A case study was prepared examining government resource contributions (GRCs) to private-not-for-profit (PNFP) providers in Uganda. It focuses on Primary Health Care (PHC) grants to the largest non-private-not-for-profit provider network, the Uganda Catholic Medical Bureau (UCMB), from 1997 to 2015. The framework of complex adaptive systems was used to explain changes in resource contributions and the relationship between the Government and UCMB. Methods:Documents and key informant interviews with the important actors provided the main sources of qualitative data. Trends for GRCs and service outputs for the study period were constructed from existing databases
used to monitor service inputs and outputs. The case study’s findings were validated during two meetings
with a broad set of stakeholders.
Results: Three major phases were identified in the evolution of GRCs and the relationship between the Government and UCMB: 1) Initiation, 2) Rapid increase in GRCs, and 3) Declining GRCs. The main factors affecting the relationship’s evolution were: 1) Financial deficits at PNFP facilities, 2) advocacy by PNFP network leaders, 3) changes in the
government financial resource envelope, 4) variations in the “good will” of government actors, and 5) changes
in donor funding modalities. Responses to the above dynamics included changes in user fees, operational costs of PNFPs, and government expectations of UCMB. Quantitative findings showed a progressive increase in service outputs despite the declining value of GRCs during the study period.
Conclusions: GRCs in Uganda have evolved influenced by various factors and the complex interactions between government and PNFPs. The Universal Health Coverage (UHC) agenda should pay attention to these factors and their interactions when shaping how governments work with PNFPs to advance UHC. GRCs could be leveraged to mitigate the financial burden on communities served by PNFPs. Governments seeking to advance UHC goals should explore policies to expand GRCs and other modalities to subsidize the operational costs of PNFPs.
Keywords:Government subsidies, Primary health care, Private-not-for-profit, Non-state providers, Universal health coverage, Uganda, Complex adaptive systems
* Correspondence:[email protected]
1Department of Health Policy, Planning and Management, Makerere University School of Public Health, P.O Box 7072, Kampala, Uganda Full list of author information is available at the end of the article
Background
The universal health coverage (UHC) agenda, as framed under Sustainable Development Goal (SDG) 3, seeks to keep health care services affordable while expanding coverage to reach those most in need, as well as increase the quality and diversity of interventions to promote well-being and healthy lifestyles [1,2]. In countries such as Uganda, these goals have helped to focus the reorganization of health care service delivery systems on meeting the health needs of the population and creating sustainable financing mechanisms [3,4]. The Ministry of Health (MoH) serves as the steward of the Ugandan health system, working closely with other line ministries, such as the Ministry of Finance, Planning and Economic Development (MoFPED) and local governments. Over the years, Uganda has developed a mixed health system with government and private sectors making contribu-tions to the delivery of health services. Uganda’s public health care system is decentralized. At district level, health care is delivered by community health workers, three types of health centres (HCs), and general hospi-tals under the stewardship of local governments. Semi-autonomous regional and national referral hospi-tals provide specialized care [5]. The private sector is diverse, encompassing private not-for-profit (PNFP) pro-viders, private for-profit health propro-viders, and traditional and complementary medical practitioners [6]. The public
system—mostly financed by government and donor
funds—is the dominant provider of health services in the country, but the PNFP sector has also emerged as a prominent contributor [7,8].
The Uganda National Minimum Health Care Package (UNMHCP) is the basic package of health care services required to be provided by both the public and private sectors (MoH 2010). The Uganda demographic and health surveys indicate that the private sector overall provides between 60 and 70% of the frontline health ser-vices; of this, the PNFP sub-sector provides 42% of the total [9, 10]. In terms of infrastructure, PNFPs operate 40% of hospitals and 22% of lower-level health facilities [11]. According to a situation analysis prepared by the MoH, the workforce in the PNFP sector constitutes nearly a quarter of the total health workforce in the country, about 9000 professionals [12].
Studies have shown that the Ugandan population seeks care in complex ways, moving among PNFPs, govern-ment facilities, and other service providers, and that the PNFP sector is trusted and perceived to provide satisfac-tory quality [13,14]. Systematically engaging with PNFPs to provide health services has the potential to play a major role as Uganda embarks on an ambitious agenda to move towards UHC.
The main sources of health care financing in Uganda are government revenue, private funds (voluntary
prepayment and out-of-pocket expenditures) and
donor grants/loans accounting for 15%, 38% and 47% respectively of the total health expenditure in 2012 [15]. Public funds used to pay for health services in public facilities are typically not directly linked to specific outputs or outcomes [15]. Since 1997, in an attempt to increase access to services, the government has also supported the PNFP sector. These govern-ment resource contributions (GRCs) include financial and non-financial support. Financial GRCs are pri-marily Primary Health Care (PHC) grants (that cover operational costs for health centers, hospitals and training schools), as well as medicines and wage sub-ventions. Other resources provided include equipment contributions (such as ambulances and diagnostics) and staff training [10, 16, 17].
The goal of the current study was to document and analyze GRCs to PNFPs in Uganda from 1997 to 2015; it sought to understand the processes, mecha-nisms and dynamics that explain the evolution of GRCs and to analyze how government-PNFP relation-ships have adapted over time. This paper addresses two questions: 1) What have been the trends in key service outputs and GRCs to the PNFP sector from 1997 to 2015?, and 2) What explains the evolution of the PHC grants (the predominant form of GRC) and adaptations by both the government and the PNFP sector over the years?
Theoretical approach
This study utilized complex adaptive systems (CAS) theory to explain how the complex changes that oc-curred in the broader context and trends in PHC grants elicited adaptations by government and PNFPs [18, 19]. CAS theory asserts that a “systems environ-ment” comprises interrelating agents that can self-organize, adapt and learn from experience [18]. Sev-eral studies have effectively used CAS theory to understand complex phenomena such as dual prac-tice, immunization services and neonatal mortality in Uganda [20–22] and the development of rural health systems in China [23]. CAS is suited to understanding complex problems characterized by a multiplicity of interacting agents, changes in the context and shifting patterns of interaction [24].
between the government and PNFPs over three distinct phases.
Methods
This case study examines GRCs (particularly the PHC grants) to the PNFP sector in Uganda between 1997, when PHC grants were initiated, and 2015. It focuses on the case of the Uganda Catholic Medical Bureau (UCMB) net-work. UCMB was selected because it is the largest PNFP network of facilities and training schools in Uganda; it also has a well-established data archive that enabled the trend analysis of GRCs and service outputs over time. In addition to UCMB, the PNFP sector also includes the Uganda Protestant Medical Bureau (UPMB), the Uganda Orthodox Medical Bureau (UOMB) and the Uganda Muslim Medical Bureau (UMMB) [26].
Quantitative analysis of trends in PHC grant alloca-tions and service outputs were combined with qualita-tive analysis of key informant interviews (KIIs) and relevant documents to explain systems dynamics and de-velop CLDs. The case study’s observations and conclu-sions were validated by experienced current and former actors in both PNFPs and government.
Interview data
Data were collected in four of Uganda’s 112 districts pur-posively selected because they contain the highest number of accredited UCMB health facilities: greater Mukono, Kampala, Arua, and greater Gulu. These districts also host regional/diocesan coordination offices for the UCMB. A total of 39 interviews were conducted in 2016 with key in-formants, including representatives of the central govern-ment (MoH and line ministries) and district authorities, representatives from other Medical Bureaus, development partners, and facility managers (see Table1). Interviewees were purposively selected based on their current or
previ-ous roles in government and the national and
sub-national health care landscape. Respondents’ roles ranged from managing the disbursement of funds to grant
administration, coordination and service delivery. All re-spondents were asked to provide written consent to par-ticipate in the study and for audio recording of interviews. An interview guide developed for the study covered sev-eral domains including: explanations for the trends in GRCs, main adaptations made by both government and the PNFPs, effects of the adaptations, and recommenda-tions for future improvements. All interviews were conducted in English, recorded, and then transcribed verbatim.
Document review
A literature search conducted for resources related to the relationships between the government and PNFPs, particularly with respect to the PHC grants, resulted in 36 documents. Most of these came from the UCMB ar-chives, supplemented with additional documents recom-mended by key informants. Each selected document was reviewed using a matrix that included: document de-scription (e.g., title, source, language, publication status, intervention context), scope (national or sub-national), and thematic focus (evolution of GRCs, players, pro-cesses, dynamics and mechanisms, and adaptations within PNFPs and government).
Secondary quantitative data
Secondary data were extracted from UCMB databases on the following service delivery outputs: out-patient de-partment attendance, admissions, in-patient days, deliv-eries, ante-natal care attendance, and immunization. These data were used to study trends in service delivery outputs between 1997 and 2015. Data on PHC grant al-locations was extracted from a comprehensive database on PHC allocations from MoFPED from 1997 to 2015 maintained by UCMB.
Ethical clearance
Ethical clearance was granted by the Higher Degrees, Research and Ethics Committee of the Makerere
Table 1KII participants at national and sub-national levels
Level Category Institutions or offices represented Number
National/central Government MoH, MoFPED, Ministry of Local Government (MoLG), and National Medical Stores (NMS) 8
PNFP UCMB Secretariat in Kampala, Diocesean health coordinator in Kampala and Joint Medical Stores (JMS), other PNFP bureaus particularly Uganda Protestant Medical Bureau(UPMB) and Uganda Moslem Medical Bureau(UMMB)
8
Development partners World Bank, Doctors with Africa (CUAMM), Association of Volunteers in International Service (AVSI) Foundation
6
Sub-national/ district Government District Health Officers (DHOs), Chief Administrative Officers (CAOs), Local Council (District) councilors
5
PNFP Diocesan Health Coordinators 3
Facility Managers 9
University School of Public Health, the Uganda National Council for Science and Technology (UNCST) and the WHO Ethics Review committee.
Data analysis
Interview transcripts were coded in Atlas.ti (v. 7.0). Query reports (lists of quotations that relate to the given theme) were generated and analyzed using thematic ana-lysis and concepts from CAS theory. The anaana-lysis was organized around: context for PHC grants, mechanisms (explanations), outcomes, and how the relationships be-tween PNFPs and government actors evolved over time.
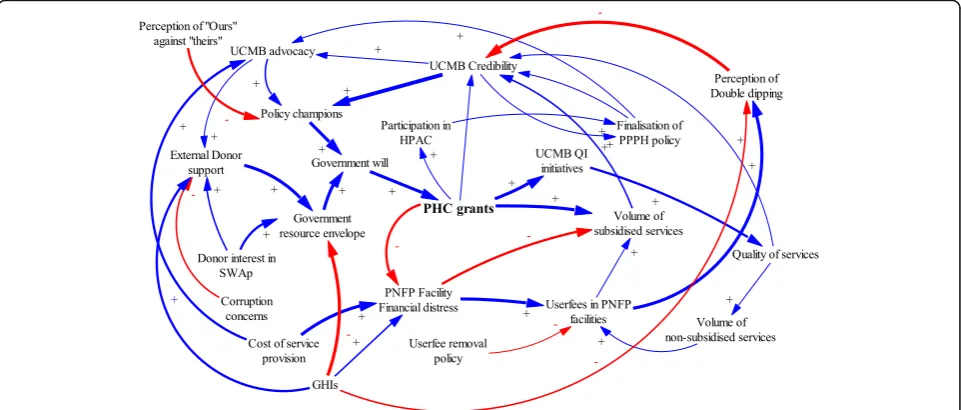
Causal loop diagrams (CLD) were developed using Vensim PLE Plus [27] to illustrate iterative interactions among contextual factors, events, actors, PHC grant dis-bursements, and adaptations in the relationships be-tween the government and PNFP providers. The CLDs were refined through an iterative process by the authors, and subsequently validated at stakeholder meetings. These processes were complementary and helped gener-ate the most plausible relationships, interactions and feedback loops. Standard notation proposed by Vensim (2017) was used in the study. A positive arrow (+) was used where a change in factor X caused factor Y to change in the same direction. A negative arrow (−) was used where a change in factor X caused an opposite change in factor Y. Some interactions cause reinforcing feedback loops in which an increase in X causes more of Y, which in turn leads to more of X. Similarly, negative feedback loops exist where variables influence each other in opposite directions. The thickness of the arrow de-notes the researchers’ estimation of the relative signifi-cance of the relationship.
Quantitative data from UCMB databases were
exported into Excel for analysis. For PHC grant dis-bursements, the absolute amounts were adjusted for in-flation using 2010 as the base year.
Results
Trends in government grants to PNFPs and selected service outputs
Figure 1 depicts the percentage share of allocation to PNFPs as a proportion of the government health care budget. A decline is observed starting in 2006.
Figure2 shows trends in PHC grant disbursements to UCMB facilities for the period 1997–2015. In real terms, PHC grant disbursement can be divided into three phases: 1) initiation (1997–2000), 2) increase (2000– 2005), and 3) decline (2006–2015). In the three-year ini-tiation phase (between 1997 and 2000), PHC grants ranged from 1.8 to 2.0 billion Uganda shillings each year in real terms (1USD = 2177.56 Ugandan Shillings, with 2010 as base year). This was followed by a sharp increase from 8.67 billion to 19.34 billion shillings between 2001 and 2005. The trends indicate a decline in PHC grants in real terms after adjusting for inflation from 18.88 to 7.43 billion shillings from 2006 to 2015 respectively.
The increase phase began when allocations for UCMB (and other PNFP providers) expanded during the period from 2000 to 2005 During this time, PHC grant alloca-tions expanded from only financing hospitals to also in-cluding lower level health centers and training schools affiliated to PNFPs [28]. As shown in Fig.3, PHC grants enabled the PNFP sector to contribute to UHC objec-tives by reducing user fees, increasing service outputs and utilization of services, and increasing the population served. Interviewees confirmed that during this period many facilities provided subsidized services and ex-panded free services, especially for HIV treatment and immunization. One PNFP respondent said:
“HIV patients come here in large numbers....When the government funds came in, we were able to give those drugs free or buy drugs using government funds. Now patients are able to come here to access the HIV clinic
and other clinics…without pay….It [PHC grant] is subsidizing the bill.”P10: KII_ National level_ PNFP.
As illustrated in Fig.3, service outputs, including out-patient visits and maternal deliveries, have gradually in-creased over the study period. This presents a contrast to the declining real value of PHC grants disbursed since 2005.
Phase 1: Initiation (1997–2000)
Figure4 shows the factors that influenced the initiation of PHC grants and the adaptions made by government and PNFP networks during this period.
The key factors that led to the initiation of PHC grants were internal factors among PNFPs and a favorable con-text for government financing of health services.
Document reviews and narratives from interviews in-dicated that prior to this phase, the 1990s were charac-terized by financial distress among PNFPs. Many PNFP facilities had relied heavily on donor and missionary funding from Europe in the 1990s, this external funding to PNFPs“had stopped,” “dwindled,” or “dried up.” This was partly due to political transitions in Europe: loss of power by political parties that had supported the provision of foreign aid to missionaries operating in countries like Uganda [29]. Likewise, the end of the civil Fig. 2PHC Grant disbursements to UCMB network in absolute terms and values adjusted for inflation
conflict in Uganda in the 1980s reduced the allocation of foreign aid from European-based missionaries that sup-ported PNFP providers. These reductions in financing threatened the survival of PNFP facilities. In response, hospital managers started actively lobbying and putting pressure on the government to provide financial support in order to“save”PNFP facilities. Interviewees indicated that the attention of the government was increased when advocates used terms like “hard-to-reach,” and “ under-served by government” to describe their patient popula-tions, and by threats of hospital closures. In one instance, a participant reported that:
“the keys to a certain PNFP hospital were brought to the MoH to threaten the closure of a hospital if funding from the government was not provided” […] P11: KII_ Former Administrator_National level_ Government.
This coincided with a favorable context for increased government funding. The government resource envelope was increasing as a result of the adoption of a Sector-Wide Approach (SWAp) to financing government services; further, debt relief for Highly Indebted Poor Countries (HIPC) was conditioned on financing health and other development sectors [30]. Under SWAp [8,17] all stakeholders, including government, donors and the private sector, were encouraged to identify priority sector programs, such as in the area of health, and to pool re-sources to address problems.
SWAp also created avenues for PNFP providers to par-ticipate formally in policy development processes, such as sector advisory committees. PNFP providers used these government structures to lobby for funding. The
financial challenges identified within the PNFP sector were high on the policy agenda for MoH and SWAp in the initiation phase.
Champions for health in the government reportedly enabled the MoH to initiate support to PNFP providers. Discussions at the validation meetings for this study in-dicated that Dr. Chrispus Kiyonga, the Minister of Health at the time and a strong ally of PNFP providers, had previously served as the Minister of Finance and thus, well informed about government-wide revenues, funding horizon and the feasibility of providing subsidies to the PNFP sub sector.
Key policy documents from the time—such as the gov-ernment decentralization policy, the National Health Policy I (1999–2009) [31] and the first health sector stra-tegic plan from 2000 [32]—both brought to the fore and demonstrated policy makers’ understanding that the government was not able to reach all areas due to lim-ited resources. Particularly in remote rural areas, part-nering with non-government providers was essential to providing health care services.
means of justifying PHC subsidies from Government. The UCMB network revised its mission in 1999 to signal renewed commitment to professionalization [35].
Phase II: Increase in PHC grants (2001–2005)
The period from 2001 to 2005 was characterized by a marked increase in health funding from the government. The health budget as a percentage of the overall govern-ment budget increased from 6% in 1999 to 10% in 2004 [36]. Figure5 illustrates dynamics during this phase, in which PHC grants were significantly increased.
The increase in available resources was enabled by HIPC debt relief, SWAps and new funding from Glo-bal Health Initiatives (GHIs). The HIPC debt relief program increased government revenue by reducing loan repayment. GHIs, such as the Global Fund to Fight AIDS, TB and Malaria and the U.S. President’s Emergency Plan for AIDS Relief (PEPFAR), began in this period and dramatically increased resources avail-able to the government for key disease-specific health programs [37, 38].
Increasing government resources enabled several re-forms. New policies included designating PNFP facilities as sub-district health headquarters and referral points [39]. Poverty eradication programs, such as the Poverty Eradication Action Plan (PEAP), were started [36–39]. As one interviewee described, health programs were seen as integral to poverty eradication:
“When Uganda’s debt was forgiven…the country preferred [to use] the money for poverty eradication [programs]. Making PHC grants‘conditional’made it look like the funds were really targeting the poor.” P26: KII_ Former Administrator_ National level_.
The abolition of user fees in public health facilities was considered a major government reform; it featured as a plank in political platforms during the ongoing transition to a multi-party system of government [7, 40]. Some respondents attributed the increase in government budget allocations to the need to compensate both pub-lic health facilities and PNFPs for the income lost from rescinding user fees. Other drivers of the funding in-creases included continued advocacy by PNFPs in health policy fora such as the Health Policy Advisory Commit-tee (HPAC) [17, 41] and continued support from sector leadership.
The reforms created both opportunities and challenges for the PNFPs. Direct opportunities included increases in PHC grant allocations for PNFPs and new opportun-ities for advocacy. However, a challenge reportedly arose from the mismatch between government expectations and the resource needs of the PNFP sector.
“[…]We are giving you money to cater for the poor, [but] when you are charging [user fees], you leave the poor ones out[…].Since we are giving you supplementary funding, you should reduce on your user fees, because they are a burden and affect health seeking behaviors.”P11: KII_ Former Administrator_ National level_.
During this phase, the guidelines for PHC grants were expanded to emphasize reaching poor and hard-to-reach populations with health care services. The PNFPs responded to user fee abolition in the public sector by reducing their fees. They also conducted costing studies to ascertain the cost of delivering services [42]. The abo-lition of user fees in public health facilities generated a
widespread perception that PNFPs also ought to provide free services while maintaining high quality standards [43]. Removing user fees at government facilities report-edly caused patients to shift from PNFPs to government facilities. This negatively affected service volume and in-creased PNFPs’ risk of financial deficits. Interview and meeting narratives indicated that this created another new dimension for advocacy: PNFPs asked the govern-ment to increase their subsidies as they could not lower fees beyond certain levels and remain functional.
During this time (2001–2005), inadequate and variable quality of health services provided by PNFPs was a major concern for both the MoH and the PNFP bureaus. Many PNFP facilities did not meet the prescribed stan-dards for staffing and service mix. Some PNFP facilities were operating without licenses and tended to hire less-qualified staff than public facilities [41, 44, 45]. These concerns prompted professionalization efforts among the PNFPs. UCMB was a front-runner in build-ing institutional structures to support its network. It created a self-regulation system that included annual ac-creditation of facilities. The main incentive for compli-ance was eligibility to receive a PHC grant [46–49].
Phase III: Decline (2006–2015)
In the mid-2000s, however, the trend of increasing sup-port to PNFPs reversed. Major explanatory factors were declines in government budgets and changes in leadership at the MoH. Figure6illustrates dynamics during the de-cline phase in PHC grants and general PNFP support.
In the mid-2000s, major leadership changes oc-curred at the MoH. The new MoH leadership held a different vision for PNFP support. At the local gov-ernment level, leaders also contested govgov-ernment
funding of PNFP providers. These changes coincided with new constraints on the government’s resource envelope due to the abandonment of the SWAp [50–52]. Further, concerns about corruption were prevalent among donors [53–56] at this time. Exter-nal development partners withdrew funds from the government budget and away from the health sector more broadly, reducing the monies available for PHC grants. Many donors “rationalized” moving their health-related aid away from the government to agencies that were associated with a perception of being relatively less prone to corruption including PNFPs. For instance, the Danish development agency DANIDA stopped funding the government’s National Medical Stores (NMS) and moved all its aid for medicines to the PNFP-owned Joint Medical Stores (JMS). The United States Agency for International Development (USAID) similarly shifted to funding the JMS instead of the NMS. The stakeholders that attended the validation meetings reported that these actions reflected a “divorce” by donors away from government budget contributions.
The growth of GHIs continued during this phase, lead-ing to donor subsidization of HIV services, vaccinations, and malaria interventions. These initiatives benefitted both government and PNFP facilities, but they reduced the pressure on the government to provide direct sup-port to PNFPs using PHC grants [57]. GHIs also started working directly with the PNFP sector, bypassing gov-ernment. The UCMB became one of the fund-holders for PEPFAR programs in Uganda [10,16,58]. GHI fund-ing streams increased pressure on PNFPs to provide free services for HIV, TB and malaria clients but failed to fully appreciate the costs incurred by the PNFP sector
[13,46]. PNFP providers were perceived to have contin-ued recieving financial support from charitable sources, especially from abroad.
Lack of transparency regarding the costs to PNFP pro-viders of service provision and the volume of donations contributed to unfavorable perceptions of PNFP facilities. The PNFP sector was accused of“multiple dipping,”that is, getting money from three sources—government, patients and donors—for each service. This was perceived as unfair, especially by public facilities that were neither charging user fees nor getting charitable donations [10,16,59,60].
Some respondents echoed a common argument that the government should shift its financing to public facil-ities, which are burdened by increased demand for qual-ity health services and yet receive less money compared to the PNFPs:
“There was a perception that the PNFPs had more money than the government and so people failed to understand why the government [had to] keep giving money to PNFP…They literally ignored the whole partnership objectives.”P28: KII_ Former Administrator _PNFP.
All these developments culminated in a decline in ac-tual amounts allocated by the central government to the PNFP sector. Some interview narratives also indicated that some district-level governments diverted funds ori-ginally allocated for PNFPs to finance other priorities.
Several responses aimed at addressing the problems related to trust and probity. All PNFP bureaus em-braced the use of government planning and information systems during this phase. The internal accreditation system created by the bureaus was strengthened to comply with MoH guidelines [10, 16, 26, 46, 48, 57]. PNFPs increased transparency and accountability by providing timely performance reports on outputs to district governments and the MoH; they also invested in tracking and reporting financial resource contribu-tions from all sources (fees, grants and donacontribu-tions). In-formation sharing with government at district level and the MoH was institutionalized. All annual sector per-formance reports now reflect the contributions of the PNFP sector; these also document financial contribu-tions that the PNFP sector receives from government, user fees and donations [61–64].
PNFPs have continued their ongoing advocacy to in-crease their share of the government health budget [26]. In response to ever-increasing costs of service provision, and reduced contributions from government sources, many PNFPs have increased charges for ser-vices. Raising charges remains a point of contention and mistrust, particularly between PNFPs and the com-munities they serve.
“Because it [PHC grant] was not enough and yet not increasing, it created the temptation of wanting to increase the fees so as to enable us to bridge the financing gap in the hospital…but in so doing…in some cases this reduces the number of patients when the services became unaffordable and therefore inaccessible.”P21: KII_ Administrator_ Facility_ District level_ Government.
Reduction in the volume of subsidized services have been reported because of reduced PHC grants to PNFPs. Many PNFPs have adopted vigorous resource mobilization efforts from alternative sources to sustain services. HIV programs for example have served as al-ternative sources of funds for PNFPs to compensate for the reduction of PHC grants from the government [65, 66]. Thanks to their autonomy, and their coverage of the rural poor, PNFPs have continued to attract donor funds to fill gaps left by reduced PHC grants.
Discussion
The UHC agenda requires context-specific evidence on topics such as how quality health services can be ex-tended to communities in need. In a pluralistic health system like Uganda’s, where the public and private sec-tors co-exist and each plays a critical role in service provision, policies to offset costs of or subsidize private service provision are important. This paper describes how GRCs, in the form of PHC grants, contributed to increasing service coverage by subsidizing PNFPs. Through a complex adaptive systems lens, this study demonstrates the adaptations made by each party in the government-PNFP relationship.
Over the period from 1997 to 2015, the relationship between government and PNFPs has undergone three major phases: 1) initiation, 2) increase and 3) decline in funding through PHC grants. This study mentions a number of adjustments made by the government and the UCMB network in particular to respond to changes in PHC grants while sustaining service provision, espe-cially for the poor. The dynamics of this relationship provides lessons that can be applied to PNFPs more broadly. These will be vital in shaping policies to scale up GRCs to PNFPs and in addressing the challenges likely to be encountered during implementation.
led to several positive responses among PNFPs, including increased professionalization, improved management cap-acities. Additionally, trend analysis showed that reductions in PHC grants led to increases in user fees charged by PNFPs.
Since 1997, government policy has existed to provide subsidies to the PNFP sector; however, contributions from government remained low relative to the oper-ational costs of the PNFPs [17, 26, 42, 61, 65]. At the peak of government subsidies to PNFPs, in the early 2000s, its contribution was estimated to cover about 35% of operational costs for lower-level facilities and be-tween five and 10 % of costs among hospitals in the PNFP sector [16]. Meanwhile, the costs of providing care continue to escalate, driving PNFPs to charge increasing fees for services. Increased wages in the public sector workforce created pressure to increase private sector sal-aries as well; the introduction of high cost technologies have also added to the burden. PNFPs have passed on the cost burden to the communities they serve [67].
Over the period of this case study, PNFPs increased the volume of services delivered. This is attributable to the increased number of PNFP providers, decreased user fees and donor grants for HIV, TB and malaria services. Results-based financing has also become a popular way for donors to mitigate the operational costs incurred by PNFPs and reduce the cost burden on communities [68]. Other benefits were stimulated by PHC grants to PNFPs. These included expansion of their networks, improving compliance with standards, and increased ef-ficiency. However, adherence to standards costs money, propelling a vicious cycle of cost and user fee increases for all services, except those with vertical funding, such as HIV and TB that had to be provided free [69].
Lessons learned from the dynamics that influenced PHC grants
Changes in the “good will” of the government towards PNFPs was one major factor underlying fluctuations in PHC grants. Policy champions in government and advo-cacy by PNFP managers for more funding for PNFPs have been key in sustaining PHC grants over time. The current Public Private Partnership for Health policy [70] and continued engagement of PNFPs in HPAC [26] pro-vide opportunities for further advocacy. However, PNFP providers need to engage further with strategic stake-holders beyond the MoH, such as the MoFPED and Parliament. Advocacy is also required at lower levels, such as with leaders at district and community levels. PNFP providers need to develop a common advocacy agenda and to generate and use evidence to demonstrate their contributions to health sector goals. As noted in the study, generating good data on service utilization levels and resource contribution trends are a necessary
first step in dealing with the perception problem of PNFP providers being considered non-transparent. For instance, several responses have been triggered within the UCMB network in response to PHC grants. Im-proved compliance with the standards of practice has been reported over the years; a requirement for acces-sing PHC funding is meeting minimum requirements for accreditation. Between 2008 and 2015, UCMB and other PNFP bureaus have worked to ensure that their facilities meet the standards [57]. In addition, they have moni-tored changes in user fees and experimented with alter-native fee structures, such as flat fees, to reduce cost uncertainty among the communities they serve [42]. PHC support reportedly led to more efficient use of re-sources. Over time, increasing client loads has reduced operating costs among some PNFP providers. This line of thinking suggests that because of the low client turn-out during the period before the receipt of PHC grants, PNFP facilities were operating with excess capacity in terms of supplies, personnel and infrastructure, making operational costs high.
Donor support modalities, such as HIPC debt relief initiatives, played a critical role in boosting government resources in early 2000s [30]. Pro-poor aid programs can be designed to advance a more holistic approach to health systems [71]. However, off-budget support and less flexible aid such as that provided by GHIs may not contribute to improving the government’s relationship with PNFPs [3,36,37]. Evidence shows that the relation-ship can be disrupted when donors bypass the govern-ment to work directly with the private sector, which may or may not include PNFPs. SWAps improved coordin-ation and alignment of donor support with ncoordin-ational pri-orities [37], and should be strengthened.
Study limitations
identify factors in the relationship between bureaus and government. Further, a study with more regional vari-ation would shed more light on equity concerns. Conclusions
Government resource contributions to the PNFP sub-sector in Uganda have gone through three main phases since 1997. Although the trend in GRCs to PNFPs declined in real terms towards the end of the study period, service out-puts continued to increase. To sustain the growth in service outputs, UCMB and other PNFPs have increasingly resorted to mobilizing financial contribution from communities by increasing user fees. As the agenda for UHC takes center stage, contributions of resources from government to PNFPs should be revisited; financial allocations should be increased and strategic purchasing arrangements established that create explicit performance expectations for govern-ment funds.
PNFPs also need to develop strategies to limit oper-ational costs, particularly as new and expensive technolo-gies are introduced and wages for health workers increase. Deliberate and sustained engagement and advocacy by PNFPs at national and district levels are required to en-sure that partnerships between government and PNFPs make meaningful and documented contributions to UHC goals. PNFPs can play a particularly important role in serving rural areas not reached by the public system. Policy and program design for UHC by government, de-velopment partners and GHIs alike should recognize and leverage the PNFP sector’s extensive network of infra-structure and human resources.
Acknowledgements
We acknowledge support from Drs. Zubin Cyrus Shroff and Ligia Paina in administration, conceptualization of the study and demonstration of how to use causal loop diagrams. Our thanks also go to the team that collected the data. Special thanks go to Ms. Monica Luwedde and Mr. Charles Kirumira of UCMB, who contributed to the extraction and analysis of the quantitative data. The symposium in 2017 organized by the SPEED project and financed by the European Union provided an additional opportunity to validate the study findings with a broader community of stakeholders. Finally, we thank Anya Guyer for her help with editing the final manuscript.
Funding
This work was part of a larger study on the role of non-state providers in moving towards UHC, supported by the Alliance for Health Policy and Sys-tems Research, WHO, with funding from the International Development Re-search Centre (IDRC), Canada and the Rockefeller Foundation.
Availability of data and materials
The datasets used to generate the quantitative findings of this study are available on reasonable request from the Uganda Catholic Medical Bureau. The qualitative data are not publicly available due to ethical concerns that they contain information that could compromise research participant privacy/consent.
Authors’contributions
AS, JN, RK, SO & FS participated in the conceptualization, implementation and analysis phases of the study. SB contributed to refining the conceptualization and analysis of the study. AS, JN and FS wrote the first manuscript draft. OS, RK, SB reviewed and provided significant input into the manuscript.
FS and AS led the revisions of before submission. All authors reviewed and approved the final draft.
Ethics approval and consent to participate
Approval was granted by Makerere University School of Public Health, Uganda National Council for Science and Technology and WHO Ethics Research Committee. Consent was sought and granted by all study participants.
Consent for publication
Not applicable.
Competing interests
AS, FS, JN, and SB declare that no competing interests. SO and RK are the senior managers of the Uganda Catholic Medical Bureau.
Publisher’s Note
Springer Nature remains neutral with regard to jurisdictional claims in published maps and institutional affiliations.
Author details
1Department of Health Policy, Planning and Management, Makerere University School of Public Health, P.O Box 7072, Kampala, Uganda.2Uganda Catholic Medical Bureau, Uganda Catholic Secretariat, Nsambya Hill, 672 Hanlon Road, P. O. Box 2886, Kampala, Uganda.3Department of International Health, Johns Hopkins Bloomberg School of Public Health, 615 North Wolfe Street, Baltimore, MD 21205, USA.
Received: 23 January 2018 Accepted: 14 August 2018
References
1. Evans TG, Palu T. Setting priorities, building prosperity through universal health coverage. Heal Syst Reform. 2016;2(1):21–2.
2. World Health Assembly. Strengthening essential public health functions in support of the achievement of universal health coverage. Resolution WHA69.1; World Health Assembly, United Nations Geneva, Switzerland 2016. 3. MOH; Systems H, 20/20;, School MU, Public. Uganda Health System
Assessment 2011. Health systems 20/20 project, Abt associates Inc; 2012. 4. Pariyo GW, Ekirapa-Kiracho E, Okui O, Rahman M, Peterson S, Bishai DM, et
al. Changes in utilization of health services among poor and rural residents in Uganda: are reforms benefitting the poor? Int J Equity Health. 2009;8(1):39. 5. MoH. National Health Policy II. 2010.
6. MoH. Health Sector Development Plan. 2015.
7. Ssengooba F, Yates R, Oliveira-Cruz VKT. Have system reform resulted in a more efficient and equitable allocation of resources in the Ugandan health sector? In: Kirunga TC, Ssengooba FO-CV, editors. Health systems reforms in Uganda: processes and outputs. London: Health systems development program, London School of Hygiene and Tropical Medicine; 2006. 8. Kirunga CT, Musoba N, Lochoro P. Public private Partnership for Health in
Uganda:will HSSP II deliver on the expectations? Heal Policy Dev J. 2007; 5(1):48–56.
9. UBOS. Uganda National Household Survey 2005/06. Report on the socio-economic module. 2006.
10. Orach S. Remarks by civil society Organisations at the closure of the 9th joint review mission. 2008.
11. MoH. Health facility inventory 2012. Kampala: MoH; 2012.
12. MoH. Human resources for health audit report 2010. Kampala: MoH; 2010. 13. Reinikka R, Svensson J. Working for god? Evidence from a change in financing
of nonprofit health care providers in Uganda. J Eur Econ Assoc. 2010; 8(6):1159–78.
14. UBOS. National Service Delivery Survey 2015 Report. 2016.
15. Ministry of Health. Health financing strategy 2015/16–2024/24. Kampala: Government of Uganda; 2016.
16. UCMB–UPMB -UMMB. Facts and figures of the PNFPS: knowing and understanding the facility-based PNFP health sub- sector in Uganda. Kampala: UCMB–UPMB -UMMB; 2007.
17. Giusti D. Between a rock and a hard place: the commitment of Catholic Health Services to PHC. Kampala: Uganda Catholic Medical Bureau; 2005. 18. Holland JH. Adaptation in natural and artificial systems :an introductory
19. Sturmberg JP, O’Halloran DM, Martin CM. Understanding health system reform -a complex -ad-aptive systems perspective. J Ev-al Clin Pr-act. 2012;18:202–8. 20. Paina L, Bennett S, Ssengooba F, Peters DH. Advancing the application of
systems thinking in health: exploring dual practice and its management in Kampala, Uganda. Heal Res Policy Syst. 2014;12(1):41.
21. Rwashana AS. System dynamics modeling in healthcare: the Ugandan immunisation system. Int J Comput ICT Res Int J Comput ICT Res Spec Issue. 2008;1(1):85–98.
22. Rwashana AS, Nakubulwa S, Nakakeeto-kijjambu M, Adam T. Advancing the application of systems thinking in health : understanding the dynamics of neonatal mortality in Uganda. Heal Res Policy Syst. 2014;12(1):1–14. 23. Zhang X, Bloom G, Xu X, Chen L, Liang X, Wolcott SJ. Advancing the
application of systems thinking in health : managing rural China health system development in complex and dynamic contexts. Health Research Policy and Systems 2014;12(1):1–9.
24. Peters DH. The application of systems thinking in health: why use systems thinking? Heal Res Policy Syst. 2014;12(1):51.
25. Paina L, Peters DH. Understanding pathways for scaling up health services through the lens of complex adaptive systems. Heal Policy Plan. 2012;27(5): 365–73.
26. Orach Orochi S. Contribution of the PNFPs. Presentation made on behalf of PNFPs at Joint Review Mission 2014. 2014.
27. Vensim. Vensim Personal Learning Edition. 2017. Available from:http:// vensim.com/vensim-personal-learning-edition/. [cited 2017 Sep 27]. 28. Ministry of Health. Health Sector Strategic Plan 2000/01–2004/05 Midterm
Reveiw Report. Kampala: Ministry of Health; 2003.
29. Macrae J, Zwi AB, Gilson L. A triple burden for health sector reform:‘post’ -conflict rehabilitation in Uganda. Soc Sci Med. 1996;42(7):1095–108. 30. Kuteesa FN, Nabbumba R. HIPC Debt Relief and Poverty Reduction Strategies:
Uganda’s Experience. In: Teunissen J, Akkerman A, editors. HIPC Debt Relief Myths and Reality FONDAD; 2004.
31. MoH. National Health Policy. Kampala: MoH; 1999. 32. MoH. Health Sector Strategic Plan 2000/01–2004/05. 2000.
33. MoH. Primary Health Care (PHC) conditional grants to districts. Annual update 1999/2000. Kampala: MoH; 1999.
34. MoH. Memorundum of understanding: Primary health care guidelines. Ministry of health. Kampala: MOH; 1999.
35. UCMB. Mission statement & policy of Catholic health Services in Uganda. Kampala: Uganda Catholic Secretariat; 1999.
36. Okwero P, Tandon A, Sparkes S, McLaughlin J, Hoogeveen JG. Fiscal space for health in Uganda: contribution to the 2008 Uganda public expenditure review: World Bank Washington DC USA, Work Pap; 2010. p. 186. 37. Stierman E, Ssengooba F, Bennett S. Aid alignment: a longer term lens on
trends in development assistance for health in Uganda. Glob Health. 2013;9(1):7. 38. Ravishankar N, Gubbins P, Cooley RJ, Leach-Kemon K, Michaud CM, Jamison DT, et al. Financing of global health: tracking development assistance for health from 1990 to 2007. Lancet. 2009;373(9681):2113–24.
39. MoH. Draft guidelines for DDHS office and health sub-district. 2001/2 work plans. 2001.
40. Tashobya CK, Ssengooba F, Cruz O. Health systems reforms in Uganda: processes and outputs. Christine Kirunga Tashobya FS and, Valeria Oliveira Cruz, editors. 2006.
41. Orach SO. Is there a case for contracting health services delivery to PNFPs in Uganda. Kampala: Uganda Catholic Medical Bureau; 2009.
42. Amone J, Asio S, Cattaneo A, Kweyatulira AK, Macaluso A, Maciocco G, et al. User fees in private non-for-profit hospitals in Uganda: a survey and intervention for equity. Int J Equity Health. 2005;4(1):6.
43. Nabyonga Orem J, Mugisha F, Kirunga C, MacQ J, Criel B. Abolition of user fees: the Uganda paradox. Health Policy Plan. 2011;26(SUPPL. 2):41–51. 44. Guisti D. The role of altruistically motivated organizations for making services
work for the poor. The experience of the private not for profit health sector in Uganda. Kampala: Internal Report, Uganda Catholic Medical Bureau; 2002. 45. Giusti D, Lochoro P, Mandelli A. Public Private Partnership in Health What is
its effect on the performance of the Health Sector? Uganda Heal Bull. 2002; 8(1):22–6.
46. Mandelli A, Giusti D. Utilising the health management information system (HMIS) for monitoring performance and planning: Uganda Catholic medical bureau experience. 2005.
47. UCMB. Improvement of the Comprehensive Financial and Activity Report for UCMB Health Training Institutions (HTI). Kampala: Uganda Catholic Medical Bureau; 2007.
48. UCMB. Accreditation Policy for Private Not for Profit Health Training Institutions 2008.
49. Ssengooba F. Contracting : a case study performance-based of non-profit hospitals in Uganda. London: University of London; 2010.
50. Adam CS, Gunning JW. Redesigning the aid contract: donors’use of performance indicators in Uganda. World Dev. 2002;30(12):2045–56. 51. Oliveira Cruz V, McPake B. The“aid contract”and its compensation scheme:
a case study of the performance of the Ugandan health sector. Soc Sci Med. 2010;71(7):1357–65.
52. Ernst J. Aid collaboration in Uganda. Int Aff Rev. 2011;XX(1):1–17. 53. Annie K. Global fund hails corruption conviction. The Guardian. Fri 17th
April 2009.
54. The Washington Times. Uganda shaken by fund scandal by - the Washington times - Thursday, June 15, 2006. 2006
55. Alan B. Global Fund suspends Aids grant to Uganda: Financial Times, United Kingdom; August 24th, 2005.
56. Rivers Bernard. Global Fund suspends all Uganda grants | Aidspan. 2005; 57. UCMB. Quality improvement efforts. In: Interactive showcase by UCMB; 2012. 58. Lochoro P, Bataringaya J, Tashobya CK, Kyabaggu JH. Public-private
partnership in health: working together to improve health sector performance in Uganda. In: Health systems reforms in Uganda: processes and outputs; 2006. p. 83.
59. UCMB. Enabling All For Faithfulness to the Mission. Abbreviated Version. The Strategic Plan 2007–2011. Operational plan 2007–2009 for UCMB: Uganda Catholic Medical Bureau; Kampala, Uganda 2007.
60. Orach Orochi S. The private-not-for-profit health sector in Uganda:a life thread under threat: Geneva Health Forum; 2010.
61. Ministry of Health. Annual health sector performance report 2015/16. Kampala: Ministry of Health; 2016.
62. Ministry of Health. Annual health sector performance report financial year 2012/2013. Vol 13. 2013.
63. Ministry of Health. Annual Health Sector Performance Report 2009/2010. 2009. 64. MOH. Annual health sector performance report 2016/17. Kampala: MOH; 2017. 65. UCMB. UCMB Annual Report 2010. 2010.
66. UCMB. Uganda Catholic Medical Bureau: Annual report 2014. 2014. 67. Namakula J, Witter S, Ssengooba F. Health worker experiences of and
movement between public and private not-for-profit sectors-findings from post-conflict northern Uganda. Hum Resour Health. 2016;14(1):18. 68. Ssennyonjo A, Ssengooba F, Ekirapa EMT. The quest for a national
results-based financing model in Uganda: innovation, learning and building from multiple pilots. In: African health economics association (AfHEA), Fourth international scientific conference; Rabat, Morocco. 2016.
69. Zikusooka CM, Tumwine M. Patrick Tutembe. Financing for HIV, AIDS, TB and malaria in Uganda: an equity analysis. Equinet Discuss Pap. 2009; 75:1–42.
70. MoH. National Policy on public private Partnership in Health. Kampala: MOH; 2012.