R E S E A R C H
Open Access
The National Eye Institute 25-Item Visual
Function Questionnaire (NEI VFQ-25)
–
reference data from the German
population-based Gutenberg Health Study
(GHS)
Stefan Nickels
1*, Alexander K. Schuster
1, Susanne Singer
2, Philipp S. Wild
3,4,5, Dagmar Laubert-Reh
3,
Andreas Schulz
3, Robert P. Finger
6, Matthias Michal
7, Manfred E. Beutel
7, Thomas Münzel
8, Karl J. Lackner
9and Norbert Pfeiffer
1Abstract
Background:To estimate the burden of diseases, it is important to consider patient-reported outcomes including Quality of Life (QoL). The aim of this study is to provide population-based reference data for the National Eye Institute 25-Item Visual Function Questionnaire (NEI VFQ-25), stratified by sex and age.
Methods:The Gutenberg Health Study (GHS) is a population-based, prospective, observational cohort study in Germany, including 15,010 participants aged between 35 and 74. The baseline examination was conducted between 2007 and 2012. To overcome known shortcomings of the NEI VFQ-25, we calculated the previously proposed visual functioning scale and the socio-emotional scale based on Rasch-transformed person-level data. We present mean values, standard deviations and percentiles for age decades stratified by sex. We used a linear regression model to assess the influence of age, sex,
socioeconomic status, distance-corrected visual acuity (better-seeing eye) and the absolute difference in distance-corrected visual acuity of both eyes on vision-related QoL.
Results:NEI VFQ-25 data are available from 12,231 participants (82%). Both the long-form visual functioning scale (LFVFS) and the long-form socio-emotional scale (LFSES) showed a clear age dependency, with an average LFVFS score of 92.8 for men and 90.5 for women in the youngest age group and 85.7 and 83.4 in the oldest age group, and a LFSES score of 98.3 for men and 98.1 in women in the youngest and 94.7 and 94.5 in the oldest decade. The largest difference was observed between the youngest age group (35–44 years) and the 45–54 years group. Men tended to have slightly higher scores than women. In the multivariable linear regression analysis, age (per 5 years−0.42), female sex (−1.57), worse distance-corrected visual acuity of the better eye (per 0.1 increase in logMAR−2.92) and the difference between both eyes (per 0. 1 increase in logMAR−0.87) were associated with a reduced LFVFS score (allp< 0.001). For the LFSES score, we showed that the influence of sex was minor, and that age (per 5 years−0.22), visual acuity of the better eye (−1.65), and the difference between both eyes (−0.56) were associated with a lower score (allp< 0.001).
(Continued on next page)
* Correspondence:[email protected]
1Department of Ophthalmology, University Medical Center Mainz,
Langenbeckstr. 1, 55131 Mainz, Germany
Full list of author information is available at the end of the article
(Continued from previous page)
Conclusions:We report age- and sex-specific reference data from a large population-based study of mainly Caucasian ethnicity of two unidimensional scores based on Rasch-transformed NEI VFQ-25 data. Vision-related QoL is lower in older and in female individuals. Our results support the association of vision-related QoL not only with the distance-corrected visual acuity of the better eye but also with the difference in visual acuity between each eye. Our findings could be used as a reference for comparison in future studies addressing the influence of eye diseases on vision-related QoL.
Background
The aim of this study was to provide vision-related qual-ity of life (VRQoL) reference data from a large population-based sample for unidimensional scores based on Rasch-transformed NEI VFQ-25 data, and to assess the associations of age, sex, socio-economic sta-tus, and distance-corrected visual acuity with VRQoL. Subjective perception of diseases and their impact on daily life activities are important measurements to esti-mate the burden of diseases. Patient-reported outcomes are also gaining importance in the evaluation of thera-peutic interventions. For example, the European Glau-coma Society Terminology and Guidelines state that the goal of glaucoma treatment is “to maintain the patient’s visual function and related quality of life” [1]. There are many methods to measure health-related quality of life (QoL), for example, the “Short-Form 36” (SF-36) to as-sess health-related QoL in general [2]. General tools might miss aspects that are important for the assessment of health-related QoL in specific diseases. Therefore, tools for the assessment of QoL related to diseases have been developed. One of the most commonly used ques-tionnaires to assess vision-related QoL (VRQoL) is the National Eye Institute Visual Function Questionnaire (NEI VFQ) [3, 4]. Subsequently, a version consisting of 25 questions (NEI VFQ-25) was developed to facilitate the application of the questionnaire in time-constrained settings [5]. The NEI VFQ-25 is commonly used and has been translated into several languages, including Italian, French, German, Spanish, Turkish, Chinese, Japanese, Greek, Portuguese, Arabic, and Serbian [6–15]. Al-though being one of the most frequently used vision-related QoL questionnaires, there is compelling evidence that unidimensionality and interval-level measurement, two of the most important requirements of such an in-strument, are not met [16]. These shortcomings could be overcome by using different analytical techniques than simply summing up the scores, as initially de-scribed by the inventors of the questionnaire [17].
Methods Study population
The Gutenberg Health Study (GHS) is a population-based, prospective, single-center cohort study at the medical center of the Johannes Gutenberg University
Mainz in Germany [18]. The population sample was ran-domly drawn via local residents’registration offices and equally stratified by sex and residence (urban/rural) for each decade of age. Exclusion criteria for participation in the GHS were insufficient knowledge of German and physical or mental inability to participate in the exami-nations in the study center. The response (recruitment efficacy proportion, i.e. the number of persons with par-ticipation in or appointment for the baseline examin-ation divided by the number of persons with participation in or appointment for the baseline examin-ation plus those with refusal and those who were not contactable) was 52.6% [19]. The baseline examination with a total of 15,010 participants aged 35 to 74 years took place from 2007 to 2012 and consisted of an oph-thalmological examination, several general and cardio-vascular examinations, as well as interviews and questionnaires. The ophthalmic part has been described in detail elsewhere [20]. In brief, we conducted measure-ments of autorefraction and distance-corrected visual acuity, intraocular pressure, visual field testing, pachy-and keratometry, pachy-and posterior segment photography. To assess VRQoL, we used the NEI VFQ-25. We in-cluded all participants who completed this questionnaire in this analysis.
VRQoL data acquisition and analysis
unidimensionality and interval-level measurement, both important properties of an instrument measuring QoL [12, 15, 16, 26, 27]. We therefore chose a Rasch-based approach, as previously used by various studies [17, 28, 29]. Rasch analysis allows to transform the raw question-naire data into an interval-level scale. We used the transformation steps suggested by Pesudovs et al. [17]. The polarity of several questions was changed to ensure that a higher score means a lower performance. The re-sponse option “Stopped doing this for other reasons or not interested in doing this”was set to missing. The filter question 15 (“Are you currently driving, at least once in a while?”) and the related questions 15a (“IF NO: Have you never driven a car or have you given up driving?”) and 15b (“IF YOU GAVE UP DRIVING: Was that mainly because of your eyesight, mainly for some other reason, or because of both your eyesight and other reasons?”) were excluded. The tables Pesudovs et al. provided were used to map the raw scores to Rasch-transformed scores for each question on person-level. Instead of the initially proposed subscales and total sum score of the NEI VFQ-25, we calculated the visual functioning scale (long-form (LFVFS) and short-form (SFVFS)) and the socioemotional scale (long-short-form (LFSES) and short-form (SFSES)), based on a principal components analysis approach proposed by Pesudovs et al. [17]. This two-scale approach is supported by a fac-tor analysis of the German NEI VFQ-39 [27]. For the LFVFS, the Rasch-transformed scores of questions 2, 5, 6, 7, 8, 9, 10, and 14 were summed up and transformed so that 0 corresponds to the sum that would be achieved if a participant would have answered all items with the worst performance, and that 100 corresponds to the sum of all items answered with the least reduction in performance. The scores of SFVFC (questions 2, 5, 6, 7, 8, 9), LFSES (questions 11, 13, 17, 18, 20, 21, 22, 23, 24, 25), and SFSES (questions 13, 17, 18, 20, 22, 23, 25) have been generated in a similar way.
Ocular characteristics
As previously described, refraction and distance-corrected visual acuity were measured in both eyes using a Hum-phrey Automated Refractor/Keratometer (HARK) 599 (Carl Zeiss AG, Jena, Germany), starting with the right eye [20]. Distance-corrected visual acuity was measured using the built-in Snellen charts, ranging from 20/400 to 40/20 (decimal 0.05 to 2.0). Below that visual acuity, we used a visual acuity chart at a distance of 1 m up to 20/800, and then counting fingers, hand movements, and test of light perception. The spherical equivalent was calculated as the spherical correction value plus half the cylindrical power. Intraocular pressure was measured with an air-puff non-contact tonometer (Nidek NT-2000; Nidek, Co., Gama-gori, Japan). Starting with the right eye, the mean of three measurements within a 3-mmHg range was obtained for
each eye. History of eye diseases was assessed in a short interview preceding the eye examination.
Risk factors and comorbidities
Diabetes mellitus was defined by fulfilling one of the fol-lowing criteria: diabetes mellitus diagnosed by a physician, known therapy (oral medication or insulin), or HbA1c > =6.5%. Dyslipidemia was defined by a low-density lipoprotein (LDL) to high-low-density lipoprotein ratio (LDL/HDL) of >3.5, triglyceride levels after overnight fast-ing >150 mg/dL, lipid-lowerfast-ing medication, or diagnosis by a physician. Hypertension was defined in the case of the use of antihypertensive medication, systolic blood pres-sure > 140 mmHg or diastolic blood prespres-sure > 90 mmHg. Smoking was dichotomized into current smokers and non-smokers (including past non-smokers). Obesity was defined as a BMI > = 30 m2/kg. Cardiovascular disease was defined as history of ischemic heart disease, myocardial infarction, stroke, or peripheral arterial disease.
Sociodemographic characteristics
The socioeconomic status (SES) was based on income, education and occupation and was defined according to the SES-index as used within the German Health Update 2009 (GEDA), with a range from 3 to 21 (three indicates the lowest SES and 21 the highest SES) [30]. Total years of education were summarized from school education, vocational training, and university education.
Statistical analysis
Results
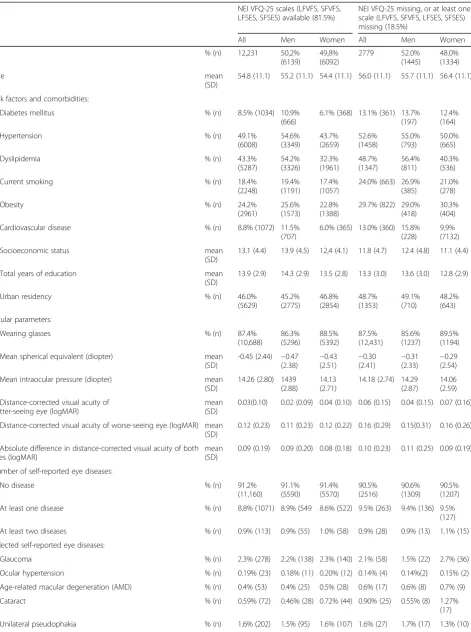
Of the entire GHS population, 13,217 participants filled the NEI VFQ-25, and 12,231 (81.5%) participants com-pleted the questionnaire without missing items necessary to calculate the proposed scores. Among participants with missing VRQoL information, comorbidities and risk factors such as diabetes mellitus (13.1% vs. 8.5%), hyper-tension (52.6% vs. 49.1%), dyslipidemia (48.7% vs. 43.3%), smoking (24.4% vs. 18.4%), obesity (29.7% vs. 24.2%) and cardiovascular disease (13.0% vs. 8.8%) were more frequent (Table 1). The frequencies of self-reported eye diseases and intraocular pressures were similar, mean spherical equivalents (−0.3 D vs. −0.45 D) and visual acuities (0.06 logMAR vs. 0.03 logMAR) slightly higher (Table 1).
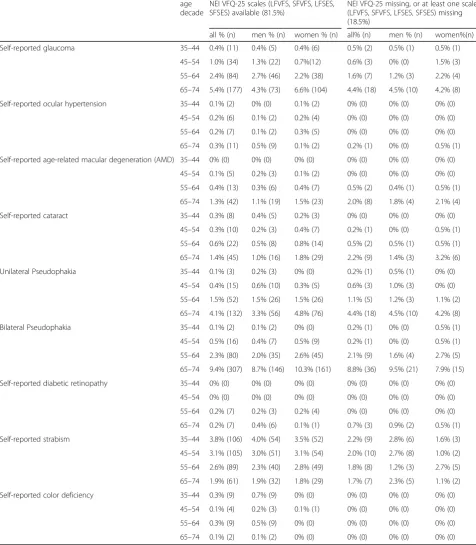
The LFVFS showed a clear age dependency with an average of 92.8 for men and 90.5 for women in the youn-gest age group and 85.7 and 83.4 in the oldest age group, respectively (Tables 2 and 3). The same tendency was ob-served in the LFSES with 98.3 for men and 98.1 for women in the youngest age decade and 94.7 and 94.5 in the oldest age group. The largest differences between age groups were observed in both scores between the youn-gest group (35–44 years) and the group of 45–54 years (LFVFS approx. 5 points in both men and women, LFSES approx. 2 points difference in both men and women). Overall, men tended to have higher scores in the LFVFS (approx. 2 points), but not in the LFSES. Similar numbers were observed in the dataset restricted to participants without self-reported diseases. The short form scales showed up to 3 point lower scores compared to the long-form scales. For all scales, percentiles (in 5% steps), mini-mum and maximini-mum values, stratified by sex and age dec-ade, are presented in Additional file 1: Tables S1a–S2d. Furthermore, we present these data restricted to partici-pants without self-reported eye diseases (Additional file 1: Tables S3a–S4d), that are very similar to the data of the total study cohort. In Table 4, we present the frequency of self-reported eye diseases and pseudophakia in the differ-ent age groups [31].
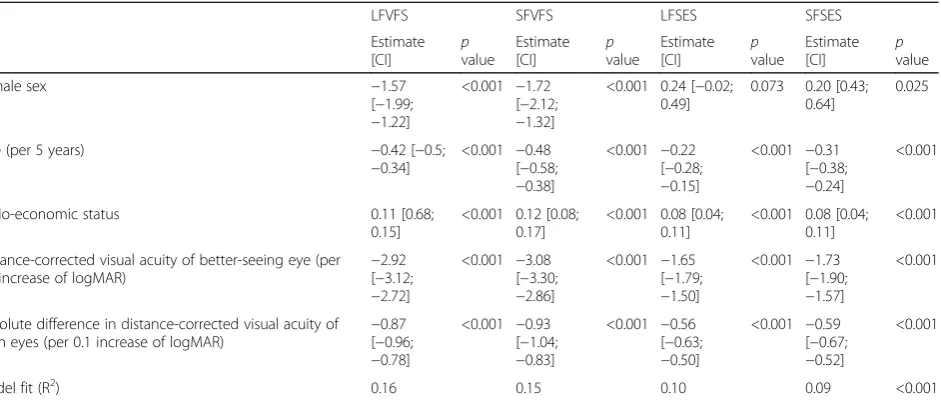
In the regression analysis, female participants had on average a 1.57 lower score in the LFVFS, assuming that the other factors (age, SES, and visual acuity) were con-stant (Table 5). Assuming linear relationships, per five-year increase in age, the LFVFS would decrease by 0.42. Per 0.1 logMAR increase in distance-corrected visual acu-ity of the better-seeing eye, the LFVFS was reduced by 2.92. The absolute difference in the distance-corrected vis-ual acuity of both eyes was associated with a decrease of 0.87 per 0.1 logMAR increase. Per 10-point increase in SES, the composite score increased by 1. In the LFSES, the influence of sex seems to be minor. Female partici-pants had on average a 0.24 points higher score, but the statistical evidence was low (p= 0.073). All other factors
also had a weak association with LFSES, compared to LFVFS: Per 5 year increase in age, the LFSES would de-crease by 0.22. Per 0.1 logMAR inde-crease in the better eye, the LFSES would decrease by 1.65. The difference of both eyes was associated with a decrease of 0.56 points per 0.1 logMAR increase.
Discussion
Patient-reported outcomes such as QoL are important measurements to estimate the burden of diseases and are gaining importance in the evaluation of therapeutic interventions. Here, we present the distribution of vision-related quality of life, as measured by the NEI VFQ-25 after Rasch-transformation, in a large population-based German sample. Previous papers re-ported that unidimensionality and interval-level meas-urement, two of the most important requirements of such an instrument, are not met by the initially proposed NEI VFQ-25 scoring, but reference data on alternative scoring methods are lacking. To our knowledge, this is the first study presenting reference data from a large population-based study presenting data of two unidimensional scores derived from the NEI-VFQ-25. We show a clear age dependency with lower NEI VFQ-25 scores at higher ages, with the largest drop observed between the youngest age group (35–44 years) and the age group of 45–54 years. Men had higher scores than women. Lower score in LFVFS was also associated with lower visual acuity of the better-seeing eye as well as with the absolute difference in visual acuity between both eyes. These results are similar in all GHS participants as well as restricted to participants who reported having no eye diseases (Additional file 1).
The questionnaire was initially developed to capture the impact of several eye diseases on quality of life. Thus, it is not surprising that most of the scores show strong ceiling effects in our population-based sample (Additional file 1).
Table 1Characteristics of the baseline sample of the German population-based Gutenberg Health Study (GHS), 2007–2012 NEI VFQ-25 scales (LFVFS, SFVFS,
LFSES, SFSES) available (81.5%)
NEI VFQ-25 missing, or at least one scale (LFVFS, SFVFS, LFSES, SFSES) missing (18.5%)
All Men Women All Men Women
N % (n) 12,231 50,2%
(6139) 49,8% (6092) 2779 52.0% (1445) 48.0% (1334) Age mean (SD)
54.8 (11.1) 55.2 (11.1) 54.4 (11.1) 56.0 (11.1) 55.7 (11.1) 56.4 (11.1)
Risk factors and comorbidities:
Diabetes mellitus % (n) 8.5% (1034) 10.9%
(666)
6.1% (368) 13.1% (361) 13.7% (197)
12.4% (164)
Hypertension % (n) 49.1%
(6008) 54.6% (3349) 43.7% (2659) 52.6% (1458) 55.0% (793) 50.0% (665)
Dyslipidemia % (n) 43.3%
(5287) 54.2% (3326) 32.3% (1961) 48.7% (1347) 56.4% (811) 40.3% (536)
Current smoking % (n) 18.4%
(2248)
19.4% (1191)
17.4% (1057)
24.0% (663) 26.9% (385)
21.0% (278)
Obesity % (n) 24.2%
(2961)
25.6% (1573)
22.8% (1388)
29.7% (822) 29.0% (418)
30.3% (404)
Cardiovascular disease % (n) 8.8% (1072) 11.5%
(707)
6.0% (365) 13.0% (360) 15.8% (228)
9.9% (7132)
Socioeconomic status mean
(SD)
13.1 (4.4) 13.9 (4.5) 12,4 (4.1) 11.8 (4.7) 12.4 (4.8) 11.1 (4.4)
Total years of education mean
(SD)
13.9 (2.9) 14.3 (2.9) 13.5 (2.8) 13.3 (3.0) 13.6 (3.0) 12.8 (2.9)
Urban residency % (n) 46.0%
(5629) 45.2% (2775) 46.8% (2854) 48.7% (1353) 49.1% (710) 48.2% (643) Ocular parameters:
Wearing glasses % (n) 87.4%
(10,688) 86.3% (5296) 88.5% (5392) 87.5% (12,431) 85.6% (1237) 89.5% (1194) Mean spherical equivalent (diopter) mean
(SD)
-0.45 (2.44) −0.47 (2.38) −0.43 (2.51) −0.30 (2.41) −0.31 (2.33) −0.29 (2.54) Mean intraocular pressure (diopter) mean
(SD)
14.26 (2.80) 1439 (2.88)
14.13 (2.71)
14.18 (2.74) 14.29 (2.87)
14.06 (2.59) Distance-corrected visual acuity of
better-seeing eye (logMAR)
mean (SD)
0.03(0.10) 0.02 (0.09) 0.04 (0.10) 0.06 (0.15) 0.04 (0.15) 0.07 (0.16)
Distance-corrected visual acuity of worse-seeing eye (logMAR) mean (SD)
0.12 (0.23) 0.11 (0.23) 0.12 (0.22) 0.16 (0.29) 0.15(0.31) 0.16 (0.26)
Absolute difference in distance-corrected visual acuity of both eyes (logMAR)
mean (SD)
0.09 (0.19) 0.09 (0.20) 0.08 (0.18) 0.10 (0.23) 0.11 (0.25) 0.09 (0.19)
Number of self-reported eye diseases:
No disease % (n) 91.2%
(11,160) 91.1% (5590) 91.4% (5570) 90.5% (2516) 90.6% (1309) 90.5% (1207) At least one disease % (n) 8.8% (1071) 8.9% (549 8.6% (522) 9.5% (263) 9.4% (136) 9.5%
(127) At least two diseases % (n) 0.9% (113) 0.9% (55) 1.0% (58) 0.9% (28) 0.9% (13) 1.1% (15) Selected self-reported eye diseases:
Glaucoma % (n) 2.3% (278) 2.2% (138) 2.3% (140) 2.1% (58) 1.5% (22) 2.7% (36) Ocular hypertension % (n) 0.19% (23) 0.18% (11) 0.20% (12) 0.14% (4) 0.14%(2) 0.15% (2) Age-related macular degeneration (AMD) % (n) 0.4% (53) 0.4% (25) 0.5% (28) 0.6% (17) 0.6% (8) 0.7% (9) Cataract % (n) 0.59% (72) 0.46% (28) 0.72% (44) 0.90% (25) 0.55% (8) 1.27%
this gap begins as early as puberty: in children aged 11– 13 years, mean scores in the KINDL-R tool are 75.7 for boys and 74.5 for girls; in the age group 14–17, the differ-ence is larger (73.6 vs. 69.4) [36]. Interestingly, in our sam-ple women had lower scores in the LFVFS, but not in the LFSES, which is less associated with visual acuity.
To the best of our knowledge, this is the largest study to report NEI VFQ-25 scores for a population-based cohort and the first to report age- and sex-specific reference data for scales based on Rasch-transformed scores. We focused not only on the visual acuity of the better-seeing eye but also took into account both eyes. Due to the strong correlation between the fellow eyes, we decided not to simply include both eyes in the model but to additionally include the abso-lute difference in visual acuity between both eyes. In addition to the visual acuity of the better eye, the difference was associated with a smaller but still considerable reduc-tion in the visual funcreduc-tion scale score (−0.89 per 0.1 differ-ence in logMAR). This underscores the importance of both eyes for vision-related QoL, which supports recent evidence that the worse-seeing eye might have a stronger impact on VRQoL than previously assumed [37, 38]. The NEI VFQ-25 developers described only small differences in the associa-tions of visual acuity of the worse- and better-seeing eye, but they might have missed effects because of their small sample size, the strong correlation between both eyes and because people with distinct differences between the visual acuity of both eyes might not have been included at all in their study [5].
Strengths and limitations
The strengths of our study are the standardized study de-sign and quality control, the broad assessment of phenotype
information, the large sample size, and the population-based sampling. Since the GHS baseline recruitment was limited to participants below the age of 75, we are not able to provide data on older age groups where the prevalence of eye diseases like AMD and glaucoma is significantly higher than in younger age groups. Individuals with visual impairment are likely to be underrepresented in the GHS cohort because of their lower likelihood to participate. Hir-neiss et al. found a frequency of 17% of participants with an ophthalmological disease in their sample of a working-age population in Germany, which is twice the frequency of self-reported eye diseases in our sample [21]. This does not necessarily indicate that participants with eye diseases are dramatically underrepresented in the GHS, but it might re-flect that many of our participants are unaware of early asymptomatic forms of eye diseases. For example, when grading fundus images of the first 5000 GHS participants for age-related macular degeneration (AMD), we detected signs of early AMD in 11.9%, which is much higher than the self-reported prevalence of 0.4% [20, 39]. Apart from the potential underrepresentation of participants with eye diseases, we had a considerable share of participants who did not complete the NEI VFQ-25. At the beginning of the GHS, participants were asked to complete the question-naire at home and send it back to the study center, which turned out not to work very well. Subsequently, the proced-ure was changed and the participants were asked to complete the questionnaire at the study center. Participants with missing NEI VFQ-25 tended to have reduced physical health, but this seems to be mainly related to general health-related risk factors and comorbidities and less related to self-reported eye diseases and ocular parameters. Therefore, we assume that the bias due to missing
Table 1Characteristics of the baseline sample of the German population-based Gutenberg Health Study (GHS), 2007–2012
(Continued)
Bilateral pseudophakia % (n) 3.1% (405) 3.0% (190) 3.3% (215) 2.7% (47) 2.5% (25) 2.9% (22) Diabetic retinopathy % (n) 0.11% (13) 0.15% (9) 0.07% (4) 0.14% (4) 0.14% (2) 0.15% (2)
Strabism % (n) 2.70% (330) 2.75%
(169)
2.64% (161)
2.34% (65) 2.08% (30) 2.62% (35) Color deficiency % (n) 0.18% (22) 0.34% (21) 0.02% (1) 0.07% (2) 0.14% (2) 0
Table 2NEI VFQ-25 scores in male participants of the German population-based Gutenberg Health Study (GHS), 2007–2012
n LFVFS SFVFS LFSES SFSES
Age decade Mean SD Mean SD Mean SD Mean SD 35–44 1304 92.8 7.7 91.5 8.6 98.3 5.1 98.0 5.9 45–54 1609 87.1 9.4 84.6 10.9 96.4 6.6 95.6 7.7 55–64 1639 86.3 10.2 84.0 11.3 95.3 8.1 94.5 9.1 65–74 1577 85.7 10.3 83.5 11.2 94.7 8.2 93.5 9.7
Scores calculated only if all items available.LFVFSlong-form visual function scale,SFVFSshort-form visual function scale,LFSESlong-form socio-emotional scale,SFSESshort-form socio-emotional scale,SDstandard deviation
Table 3NEI VFQ-25 scores in female participants of the German population-based Gutenberg Health Study (GHS), 2007–2012
n LFVFS SFVFS LFSES SFSES
Age decade Mean SD Mean SD Mean SD Mean SD 35–44 1439 90.5 8.5 88.9 9.5 98.1 5.1 97.7 5.9 45–54 1656 84.3 11.2 81.5 12.6 95.9 7.3 95.2 8.2 55–64 1590 84.4 11.5 82.0 12.6 95.7 7.8 94.9 9.0 65–74 1407 83.4 12.3 81.2 13.2 94.5 9.6 93.6 10.7
information on VRQoL is low. Another limitation might be that the data we used to map raw NEI VFQ data to Rasch-transformed data was collected in Australia, and that cultural differences in perceiving health-related limi-tations in everyday life might introduce bias. On the other
hand, the traditional NEI VFQ-25 has been validated in different cultural settings with only minimal adap-tions needed.
Even though the estimates from the linear regression are supported by the descriptive analyses (influence of sex Table 4Frequency of eye diseases in specific age groups of the German population-based Gutenberg Health Study (GHS), 2007–2012
age decade
NEI VFQ-25 scales (LFVFS, SFVFS, LFSES, SFSES) available (81.5%)
NEI VFQ-25 missing, or at least one scale (LFVFS, SFVFS, LFSES, SFSES) missing (18.5%)
all % (n) men % (n) women % (n) all% (n) men % (n) women%(n) Self-reported glaucoma 35–44 0.4% (11) 0.4% (5) 0.4% (6) 0.5% (2) 0.5% (1) 0.5% (1)
45–54 1.0% (34) 1.3% (22) 0.7%(12) 0.6% (3) 0% (0) 1.5% (3) 55–64 2.4% (84) 2.7% (46) 2.2% (38) 1.6% (7) 1.2% (3) 2.2% (4) 65–74 5.4% (177) 4.3% (73) 6.6% (104) 4.4% (18) 4.5% (10) 4.2% (8) Self-reported ocular hypertension 35–44 0.1% (2) 0% (0) 0.1% (2) 0% (0) 0% (0) 0% (0)
45–54 0.2% (6) 0.1% (2) 0.2% (4) 0% (0) 0% (0) 0% (0) 55–64 0.2% (7) 0.1% (2) 0.3% (5) 0% (0) 0% (0) 0% (0) 65–74 0.3% (11) 0.5% (9) 0.1% (2) 0.2% (1) 0% (0) 0.5% (1) Self-reported age-related macular degeneration (AMD) 35–44 0% (0) 0% (0) 0% (0) 0% (0) 0% (0) 0% (0)
45–54 0.1% (5) 0.2% (3) 0.1% (2) 0% (0) 0% (0) 0% (0) 55–64 0.4% (13) 0.3% (6) 0.4% (7) 0.5% (2) 0.4% (1) 0.5% (1) 65–74 1.3% (42) 1.1% (19) 1.5% (23) 2.0% (8) 1.8% (4) 2.1% (4) Self-reported cataract 35–44 0.3% (8) 0.4% (5) 0.2% (3) 0% (0) 0% (0) 0% (0)
45–54 0.3% (10) 0.2% (3) 0.4% (7) 0.2% (1) 0% (0) 0.5% (1) 55–64 0.6% (22) 0.5% (8) 0.8% (14) 0.5% (2) 0.5% (1) 0.5% (1) 65–74 1.4% (45) 1.0% (16) 1.8% (29) 2.2% (9) 1.4% (3) 3.2% (6) Unilateral Pseudophakia 35–44 0.1% (3) 0.2% (3) 0% (0) 0.2% (1) 0.5% (1) 0% (0)
45–54 0.4% (15) 0.6% (10) 0.3% (5) 0.6% (3) 1.0% (3) 0% (0) 55–64 1.5% (52) 1.5% (26) 1.5% (26) 1.1% (5) 1.2% (3) 1.1% (2) 65–74 4.1% (132) 3.3% (56) 4.8% (76) 4.4% (18) 4.5% (10) 4.2% (8) Bilateral Pseudophakia 35–44 0.1% (2) 0.1% (2) 0% (0) 0.2% (1) 0% (0) 0.5% (1) 45–54 0.5% (16) 0.4% (7) 0.5% (9) 0.2% (1) 0% (0) 0.5% (1) 55–64 2.3% (80) 2.0% (35) 2.6% (45) 2.1% (9) 1.6% (4) 2.7% (5) 65–74 9.4% (307) 8.7% (146) 10.3% (161) 8.8% (36) 9.5% (21) 7.9% (15) Self-reported diabetic retinopathy 35–44 0% (0) 0% (0) 0% (0) 0% (0) 0% (0) 0% (0)
45–54 0% (0) 0% (0) 0% (0) 0% (0) 0% (0) 0% (0) 55–64 0.2% (7) 0.2% (3) 0.2% (4) 0% (0) 0% (0) 0% (0) 65–74 0.2% (7) 0.4% (6) 0.1% (1) 0.7% (3) 0.9% (2) 0.5% (1) Self-reported strabism 35–44 3.8% (106) 4.0% (54) 3.5% (52) 2.2% (9) 2.8% (6) 1.6% (3) 45–54 3.1% (105) 3.0% (51) 3.1% (54) 2.0% (10) 2.7% (8) 1.0% (2) 55–64 2.6% (89) 2.3% (40) 2.8% (49) 1.8% (8) 1.2% (3) 2.7% (5) 65–74 1.9% (61) 1.9% (32) 1.8% (29) 1.7% (7) 2.3% (5) 1.1% (2) Self-reported color deficiency 35–44 0.3% (9) 0.7% (9) 0% (0) 0% (0) 0% (0) 0% (0)
and age), the results should be interpreted with care. The best R2 value of the regression models is 0.16 (LFVFS), meaning that only 16% of the visual functioning scale vari-ation could be explained by the model.
Conclusion
In summary, we report age- and sex-specific VRQoL of two unidimensional scales based on Rasch-transformed
NEI VFQ-25 questionnaire data from a large
population-based German cohort that could be used as a reference for comparison in future studies. Further-more, we show a clear age dependency for VRQoL, with lower scores at higher ages. The largest drop in VRQoL was observed between the age group of 35–44 years and the age group of 45–54 years. Worse VRQoL was associ-ated with the visual acuity of the better-seeing eye and additionally with the difference between both eyes.
Additional file
Additional file 1: Supplementary Tables.Table S1a.NEI VFQ-25 scores in men aged 35–44 years of the German population-based Gutenberg Health Study (GHS), 2007–2012.Table S1b.NEI VFQ-25 scores in men aged 45–54 years of the German population-based Gutenberg Health Study (GHS), 2007–2012.Table S1c.NEI VFQ-25 scores in men aged 55–64 years of the German population-based Gutenberg Health Study (GHS), 2007–2012.Table S1d.NEI VFQ-25 scores in men aged 65–74 years of the German population-based Gutenberg Health Study (GHS), 2007–2012.Table S2a.NEI VFQ-25 scores in women aged 35–44 years of the German population-based Gutenberg Health Study (GHS), 2007–2012.Table S2b.NEI VFQ-25 scores in women aged 45–54 years of the German population-based Gutenberg Health Study (GHS), 2007–2012.Table S2c.NEI VFQ-25 scores in women aged 55–64 years of the German population-based Gutenberg Health Study (GHS), 2007–2012.Table S2d.NEI VFQ-25 in women aged 65–74 years of the German population-based Gutenberg Health Study (GHS), 2007–2012.Table S3a.NEI VFQ-25 in men without self-reported eye diseases aged 35–44 years
of the German population-based Gutenberg Health Study (GHS), 2007–2012. Table S3b.NEI VFQ-25 in men without self-reported eye diseases aged 45–54 years of the German population-based Gutenberg Health Study (GHS), 2007–2012.Table S3c.NEI VFQ-25 scores in men without self-reported eye diseases aged 55–64 years of the German population-based Gutenberg Health Study (GHS), 2007–2012.Table S3d.NEI VFQ-25 scores in men without self-reported eye diseases aged 65–74 years of the German population-based Gutenberg Health Study (GHS), 2007–2012.Table S4a.NEI VFQ-25 scores in women without self-reported eye diseases aged 35–44 years of the German population-based Gutenberg Health Study (GHS), 2007–2012.Table S4b.NEI VFQ-25 scores in women without self-reported eye diseases aged 45–54 years of the German population-based Gutenberg Health Study (GHS), 2007–2012.Table S4c.NEI VFQ-25 scores in women without self-reported eye diseases aged 55–64 years of the German population-based Gutenberg Health Study (GHS), 2007–2012.Table S4d.NEI VFQ-25 scores in women without self-reported eye diseases aged 65–74 years of the German population-based Gutenberg Health Study (GHS), 2007–2012. (DOC 461 kb)
Abbreviations
CI:Confidence interval; GHS: Gutenberg Health Study; LFSES: Long-form socio-emotional scale; LFVFS: Long-form visual functioning scale; NEI VFQ-25: National Eye Institute 25-Item Visual Function Questionnaire; QoL: Quality of life; SES: Socioeconomic status; SFSES: Short-form socio-emotional scale; SFVFS: Short-form visual functioning scale; VRQoL: Vision-related QoL
Acknowledgements
We thank all study participants for their willingness to provide data for this research project, and we are indebted to all coworkers for their enthusiastic commitment.
Funding
The Gutenberg Health Study is funded through the government of Rhineland-Palatinate (“Stiftung Rheinland-Pfalz für Innovation”, contract AZ 961-386261/733), the research programs“Wissen schafft Zukunft”and“Center for Translational Vascular Biology (CTVB)”of the Johannes Gutenberg-University of Mainz, and its contracts with Boehringer Ingelheim and PHILIPS Medical Systems, including unrestricted grants for the Gutenberg Health Study. Philipp S. Wild is funded by the Federal Ministry of Education and Research (BMBF 01EO1503), and he is the PI of the German Center for Cardiovascular Research (DZHK). Table 5Linear regression results of the NEI VFQ-25 scores in the German population-based Gutenberg Health Study (GHS), 2007–2012
LFVFS SFVFS LFSES SFSES
Estimate
[CI] pvalue
Estimate
[CI] pvalue
Estimate
[CI] pvalue
Estimate
[CI] pvalue
Female sex −1.57
[−1.99;
−1.22]
<0.001 −1.72 [−2.12;
−1.32]
<0.001 0.24 [−0.02; 0.49]
0.073 0.20 [0.43; 0.64]
0.025
Age (per 5 years) −0.42 [−0.5;
−0.34]
<0.001 −0.48 [−0.58;
−0.38]
<0.001 −0.22 [−0.28;
−0.15]
<0.001 −0.31 [−0.38;
−0.24]
<0.001
Socio-economic status 0.11 [0.68;
0.15]
<0.001 0.12 [0.08; 0.17]
<0.001 0.08 [0.04; 0.11]
<0.001 0.08 [0.04; 0.11]
<0.001
Distance-corrected visual acuity of better-seeing eye (per 0.1 increase of logMAR)
−2.92 [−3.12;
−2.72]
<0.001 −3.08 [−3.30;
−2.86]
<0.001 −1.65 [−1.79;
−1.50]
<0.001 −1.73 [−1.90;
−1.57]
<0.001
Absolute difference in distance-corrected visual acuity of both eyes (per 0.1 increase of logMAR)
−0.87 [−0.96;
−0.78]
<0.001 −0.93 [−1.04;
−0.83]
<0.001 −0.56 [−0.63;
−0.50]
<0.001 −0.59 [−0.67;
−0.52]
<0.001
Model fit (R2) 0.16 0.15 0.10 0.09 <0.001
Availability of data and materials
The analysis presents clinical data of a large-scale population-based cohort with ongoing follow-up examinations. This project constitutes a major scientific effort with high methodological standards and detailed guidelines for analysis and publication to ensure scientific analyses on highest level. Therefore, data are not made available for the scientific community outside the established and controlled workflows and algorithms.
To meet the general idea of verification and reproducibility of scientific findings, we offer access to data at the local database in accordance with the ethics vote upon request at any time. The GHS steering committee, which comprises a member of each involved department and the head of the Gutenberg Health Study (PSW), convenes once a month. The steering committee decides on internal and external access of researchers and use of the data and biomaterials based on a research proposal to be supplied by the researcher. Interested researchers make their requests to the head of the Gutenberg Health Study (Philipp S. Wild; [email protected]). More detailed contact information is available at the homepages of the GHS (www.gutenberghealthstudy.org) or the ophthalmic branch of the GHS (www.unimedizin-mainz.de/augenklinik/forschung/gutenberg-gesundheitsstudie.html).
Authors’contributions
Conceived and designed the study: PSW, MM, MEB, TM, KJL, SN, NP; analyzed and interpreted the data: SN, AKS, AS, DLR, SS, RF, NP; wrote the paper: SN, AKS, RF, SS, NP; all authors revised the manuscript critically and approved the final version.
Ethics approval and consent to participate
The study protocol and study documents were approved by the local ethics committee of the Medical Chamber of Rhineland-Palatinate, Germany (reference no. 837.020.07; original vote: 22.3.2007, latest update: 20.10.2015). According to the tenets of the Declaration of Helsinki, written informed consent was obtained from all participants prior to entering the study.
Consent for publication Not applicable
Competing interests
The authors declare that they have no competing interests.
Publisher’s Note
Springer Nature remains neutral with regard to jurisdictional claims in published maps and institutional affiliations.
Author details
1Department of Ophthalmology, University Medical Center Mainz,
Langenbeckstr. 1, 55131 Mainz, Germany.2Institute for Medical Biostatistics,
Epidemiology and Informatics, University Medical Center Mainz, Mainz, Germany.3Preventive Cardiology and Preventive Medicine, Center for Cardiology, Cardiology I, University Medical Center Mainz, Mainz, Germany.
4Center for Thrombosis and Hemostasis (CTH), University Medical Center
Mainz, Mainz, Germany.5German Center for Cardiovascular Research (DZHK),
partner site Rhine-Main, Mainz, Germany.6Department of Ophthalmology, University of Bonn, Bonn, Germany.7Department of Psychosomatic Medicine
and Psychotherapy, University Medical Center Mainz, Mainz, Germany.
8Center for Cardiology, Cardiology I, University Medical Center Mainz, Mainz,
Germany.9Institute for Clinical Chemistry and Laboratory Medicine, University Medical Center Mainz, Mainz, Germany.
Received: 15 September 2016 Accepted: 2 August 2017
References
1. European Glaucoma Society. Terminology and guidelines for glaucoma. 4th ed; 2014.
2. Ware JE Jr, Sherbourne CD. The MOS 36-item short-form health survey (SF-36). I. Conceptual framework and item selection. Med Care. 1992;30:473–83. 3. Mangione CM, Lee PP, Pitts J, Gutierrez P, Berry S, Hays RD. Psychometric
properties of the National Eye Institute Visual Function Questionnaire (NEI-VFQ). NEI-VFQ Field Test Investigators. Arch Ophthalmol. 1998;116:1496–504. 4. Mangione CM, Berry S, Spritzer K, Janz NK, Klein R, Owsley C, Lee PP.
Identifying the content area for the 51-item National eye Institute visual
function questionnaire: results from focus groups with visually impaired persons. Arch Ophthalmol. 1998;116:227–33.
5. Mangione CM, Lee PP, Gutierrez PR, Spritzer K, Berry S, Hays RD. Development of the 25-item National eye Institute visual function questionnaire. Arch Ophthalmol. 2001;119:1050–8.
6. Rossi GC, Milano G, Tinelli C. The Italian version of the 25-item National eye Institute visual function questionnaire: translation, validity, and reliability. J Glaucoma. 2003;12:213–20.
7. Franke GH, Esser J, Voigtländer A, Mähner N. Der National Eye Institute Visual Function Questionnaire (NEI-VFQ)–Erste Ergebnisse zur psychometrischen Überprüfung eines Verfahrens zur Erfassung der Lebensqualität bei Sehbeeinträchtigten. Z Med Psychol. 1998;7:178–84. 8. Broman AT, Munoz B, West SK, Rodriguez J, Sanchez R, Snyder R, Klein R.
Psychometric properties of the 25-item NEI-VFQ in a Hispanic population: Proyecto VER. Invest Ophthalmol Vis Sci. 2001;42:606–13.
9. Toprak AB, Eser E, Guler C, Baser FE, Mayali H. Cross-validation of the Turkish version of the 25-item National Eye Institute Visual Functioning
Questionnaire (NEI-VFQ 25). Ophthalmic Epidemiol. 2005;12:259–69. 10. Lin JC, Chie WC. Psychometric validation of the Taiwan Chinese version of
the 25-Item National Eye Institute Visual Functioning Questionnaire. J Eval Clin Pract. 2010;16:619–26.
11. Suzukamo Y, Oshika T, Yuzawa M, Tokuda Y, Tomidokoro A, Oki K, Mangione CM, Green J, Fukuhara S. Psychometric properties of the 25-item National Eye Institute Visual Function Questionnaire (NEI VFQ-25), Japanese version. Health Qual Life Outcomes. 2005;3:65.
12. Labiris G, Katsanos A, Fanariotis M, Tsirouki T, Pefkianaki M, Chatzoulis D, Tsironi E. Psychometric properties of the Greek version of the NEI-VFQ 25. BMC Ophthalmol. 2008;8:4.
13. Simao LM, Lana-Peixoto MA, Araujo CR, Moreira MA, Teixeira AL. The Brazilian version of the 25-item National Eye Institute Visual Function Questionnaire: translation, reliability and validity. Arq Bras Oftalmol. 2008;71:540–6. 14. Abdelfattah NS, Amgad M, Salama AA, Israel ME, Elhawary GA, Radwan AE,
Elgayar MM, El Nakhal TM, Elkhateb IT, Hashem HA, et al. Development of an Arabic version of the National Eye Institute Visual Function Questionnaire as a tool to study eye diseases patients in Egypt. Int J Ophthalmol. 2014;7:891–7. 15. Kovac B, Vukosavljevic M, Djokic Kovac J, Resan M, Trajkovic G, Jankovic J, Smiljanic M, Grgurevic A. Validation and cross-cultural adaptation of the National Eye Institute Visual Function Questionnaire (NEI VFQ-25) in Serbian patients. Health Qual Life Outcomes. 2015;13:142.
16. Khadka J, McAlinden C, Pesudovs K. Quality assessment of ophthalmic questionnaires: review and recommendations. Optom Vis Sci. 2013;90:720–44. 17. Pesudovs K, Gothwal VK, Wright T, Lamoureux EL. Remediating serious flaws
in the National Eye Institute Visual Function Questionnaire. J Cataract Refract Surg. 2010;36:718–32.
18. Wild PS, Zeller T, Beutel M, Blettner M, Dugi KA, Lackner KJ, Pfeiffer N, Munzel T, Blankenberg S. The Gutenberg health study.
Bundesgesundheitsblatt Gesundheitsforschung Gesundheitsschutz. 2012;55:824–9.
19. Stang A, Ahrens W, Jockel KH. Control response proportions in population-based case-control studies in Germany. Epidemiology. 1999;10:181–3. 20. Höhn R, Kottler U, Peto T, Blettner M, Munzel T, Blankenberg S, Lackner KJ,
Beutel M, Wild PS, Pfeiffer N. The ophthalmic branch of the Gutenberg health study: study design, cohort profile and self-reported diseases. PLoS One. 2015;10:e0120476.
21. Hirneiss C, Schmid-Tannwald C, Kernt M, Kampik A, Neubauer AS. The NEI VFQ-25 vision-related quality of life and prevalence of eye disease in a working population. Graefes Arch Clin Exp Ophthalmol. 2010;248:85–92. 22. Wolfram C, Lorenz K, Breitscheidel L, Verboven Y, Pfeiffer N. Health- and
vision-related quality of life in patients with ocular hypertension or primary open-angle glaucoma. Ophthalmologica. 2013;229:227–34.
23. Bertelmann T, Feltgen N, Scheffler M, Hufenbach U, Wiedon A, Wilhelm H, Ziemssen F. Vision-related quality of life in patients receiving intravitreal ranibizumab injections in routine clinical practice: baseline data from the German OCEAN study. Health Qual Life Outcomes. 2016;14:132.
24. Finger RP, Wiedemann P, Blumhagen F, Pohl K, Holz FG. Treatment patterns, visual acuity and quality-of-life outcomes of the WAVE study - a
noninterventional study of ranibizumab treatment for neovascular age-related macular degeneration in Germany. Acta Ophthalmol. 2013;91:540–6. 25. Renieri G, Pitz S, Pfeiffer N, Beutel ME, Zwerenz R. Changes in quality of
26. Mollazadegan K, Huang J, Khadka J, Wang Q, Yang F, Gao R, Pesudovs K. Cross-cultural validation of the National Eye Institute Visual Function Questionnaire. J Cataract Refract Surg. 2014;40:774–84.
27. Brosel D, Sabel BA, Franke GH, Gall C. The 2-scale model of the National eye Institute visual function questionnaire (NEI-VFQ) to assess vision-related quality of life. Klin Monatsbl Augenheilkd. 2016;
28. Petrillo J, Cano SJ, McLeod LD, Coon CD. Using classical test theory, item response theory, and Rasch measurement theory to evaluate patient-reported outcome measures: a comparison of worked examples. Value Health. 2015;18:25–34.
29. Dougherty BE, Bullimore MA. Comparison of scoring approaches for the NEI VFQ-25 in low vision. Optom Vis Sci. 2010;87:543–8.
30. Lampert T, Kroll LE, Muters S, Stolzenberg H. Measurement of the socioeconomic status within the German health update 2009 (GEDA). Bundesgesundheitsblatt Gesundheitsforschung Gesundheitsschutz. 2013;56:131–43.
31. Schuster AK, Pfeiffer N, Schulz A, Nickels S, Hohn R, Wild PS, Blettner M, Munzel T, Beutel ME, Lackner KJ, Vossmerbaeumer U. The impact of pseudophakia on visionrelated quality of life in the general population -the Gutenberg health study. Aging (Albany NY). 2017;
32. Klein R, Moss SE, Klein BE, Gutierrez P, Mangione CM. The NEI-VFQ-25 in people with long-term type 1 diabetes mellitus: the Wisconsin epidemiologic study of diabetic retinopathy. Arch Ophthalmol. 2001;119:733–40.
33. Muir KW, Santiago-Turla C, Stinnett SS, Herndon LW, Allingham RR, Challa P, Lee PP. Health literacy and vision-related quality of life. Br J Ophthalmol. 2008;92:779–82.
34. Jenkinson C, Coulter A, Wright L. Short form 36 (SF36) health survey questionnaire: normative data for adults of working age. BMJ. 1993;306:1437–40. 35. Ellert U, Kurth BM. Health related quality of life in adults in Germany: results of the
German health interview and examination survey for adults (DEGS1).
Bundesgesundheitsblatt Gesundheitsforschung Gesundheitsschutz. 2013;56:643–9. 36. Ravens-Sieberer U, Erhart M, Wille N, Bullinger M. Health-related quality of
life in children and adolescents in Germany: results of the BELLA study. Eur Child Adolesc Psychiatry. 2008;17(Suppl 1):148–56.
37. Hirneiss C. The impact of a better-seeing eye and a worse-seeing eye on vision-related quality of life. Clin Ophthalmol. 2014;8:1703–9.
38. Finger RP, Fenwick E, Hirneiss CW, Hsueh A, Guymer RH, Lamoureux EL, Keeffe JE. Visual impairment as a function of visual acuity in both eyes and its impact on patient reported preferences. PLoS One. 2013;8:e81042. 39. Korb CA, Kottler UB, Wolfram C, Hoehn R, Schulz A, Zwiener I, Wild PS,
Pfeiffer N, Mirshahi A. Prevalence of age-related macular degeneration in a large European cohort: results from the population-based Gutenberg health study. Graefes Arch Clin Exp Ophthalmol. 2014;252:1403–11.
• We accept pre-submission inquiries
• Our selector tool helps you to find the most relevant journal • We provide round the clock customer support
• Convenient online submission • Thorough peer review
• Inclusion in PubMed and all major indexing services • Maximum visibility for your research
Submit your manuscript at www.biomedcentral.com/submit