Open Access
Research
A longitudinal evaluation of the Center for Epidemiologic
Studies-Depression scale (CES-D) in a Rheumatoid Arthritis
Population using Rasch Analysis
Tanya Covic*
1, Julie F Pallant
2, Philip G Conaghan
3and Alan Tennant
3Address: 1School of Psychology, University of Western Sydney, Locked Bag 1797, Penrith South DC 1797, NSW, Australia, 2School of Rural Health,
University of Melbourne, 49 Graham Street, Shepparton, 3630, Victoria, Australia and 3Academic Section of Musculoskeletal Disease, Leeds
Institute of Molecular Medicine, Faculty of Medicine and Health, University of Leeds, 36 Clarendon Road, Leeds, LS2 9NZ, UK
Email: Tanya Covic* - [email protected]; Julie F Pallant - [email protected]; Philip G Conaghan - [email protected]; Alan Tennant - [email protected]
* Corresponding author
Abstract
Background: The aim of this study was to test the internal validity of the total Center for Epidemiologic Studies-Depression (CES-D) scale using Rasch analysis in a rheumatoid arthritis (RA) population.
Methods: CES-D was administered to 157 patients with RA over three time points within a 12 month period. Rasch analysis was applied using RUMM2020 software to assess the overall fit of the model, the response scale used, individual item fit, differential item functioning (DIF) and person separation.
Results: Pooled data across three time points was shown to fit the Rasch model with removal of seven items from the original 20-item CES-D scale. It was necessary to rescore the response format from four to three categories in order to improve the scale's fit. Two items demonstrated some DIF for age and gender but were retained within the 13-item CES-D scale. A new cut point for depression score of 9 was found to correspond to the original cut point score of 16 in the full CES-D scale.
Conclusion: This Rasch analysis of the CES-D in a longstanding RA cohort resulted in the construction of a modified 13-item scale with good internal validity. Further validation of the modified scale is recommended particularly in relation to the new cut point for depression.
Background
Rheumatoid arthritis (RA) is one of the most common chronic inflammatory joint diseases [1] and is associated with depression [2]. The reported prevalence of depres-sion in this population ranges from 13 to 20% [3] when based on psychiatric assessment, but may be as high as 40% when based on self-reported assessment [4]. Indeed,
in a UK study of over 7000 patients with RA, 19% were identified as clinically depressed at some point during the disease course [5] clearly indicating that the co-morbidity of depression in RA significantly exceeds the rates of depression in a general community (2–4%) or primary care (5–10%) population [6].
Published: 13 July 2007
Health and Quality of Life Outcomes 2007, 5:41 doi:10.1186/1477-7525-5-41
Received: 20 March 2007 Accepted: 13 July 2007
This article is available from: http://www.hqlo.com/content/5/1/41
© 2007 Covic et al; licensee BioMed Central Ltd.
Depression in RA is closely associated with pain, work dis-ability, health services utilisation, poor adherence to treat-ment and even suicide (see Sheehy [2] for review) making the identification and treatment of depression in RA par-amount to the overall management of RA. It has been sug-gested that improving the awareness of depression in RA could be achieved with regular mood assessment by rheu-matologists and/or clinical nurse specialists [2]. The use of self-report scales, while not substituting for a psychiatric clinical assessment, may be useful as screening tools to identify patients with RA who may be at risk of depres-sion, and to use as an outcome measure.
The Center for Epidemiologic Studies-Depression (CES-D) scale is one of the commonly used depression meas-urement tools originally developed for use in the general population [7]. It has also been found to be valid and reli-able in identification of individuals at high risk of devel-oping major depression in clinical populations including RA [8], brain injury [9], multiple sclerosis [10], cancer [11] and stroke [12].
Although there is strong psychometric support for the CES-D its structural validity has been questioned [13]. The CES-D was developed based on Beck's [14]cognitive model of depression representing four factors, namely negative affect (e.g. item 14 'I felt lonely'), positive affect (e.g. item 16 'I enjoyed life'), interpersonal difficulties (e.g. item 15 'People were unfriendly') and somaticism (e.g. item 11 'My sleep was restless'). While a number of studies have replicated the original factors, those findings could not be generalised to an RA population as there has been evi-dence of criterion contamination with some somatic items being disease related (e.g. item 7 'I felt that everything I did was an effort') rather than indicative of depression [15,16]. Rhee et al [8] in a longitudinal examination of CES-D in a sample of 685 patients with RA found support for the original four factors but also evidence of criterion contamination in this population. It has been suggested that the four theory-driven factors of the CES-D are inter-related in the single-factor hierarchical model [17] and that the use of factor analytic methods may mask a general psychological distress factor [18].
Exploratory and confirmatory factor analyses have been commonly used to test the CES-D latent structure, how-ever these techniques are sample dependent [8], and tend to produce different findings [13]. They also fail to "iden-tify dimensions on which the summed total score is a meaningful and sufficient statistic" [19] whereby items are equivalent in meaning across individuals [20]. Conse-quently there is a growing use of modern psychometric techniques such as Rasch analysis [21] and the related models within Item Response Theory [22]. These approaches are increasingly being used in the
develop-ment of new scales and in the improvedevelop-ment of existing scales that measure latent traits such as depression, by establishing their fundamental measurement ability [23]. Thus, Rasch analysis can provide true interval scaling, sig-nificant information about the respondents with extreme scores, and a more comprehensive understanding of the underlying latent structure [13,23]. As such, Rasch analy-sis has the potential to improve existing scales perhaps with fewer and more relevant questions without compro-mising the screening efficacy of scales such as those that assess psychological distress [24].
Only a few studies, however, have used Rasch models to test the CES-D and these include a test of population dif-ferences (stroke vs primary-care patients) [12]; CES-D mode effect (phone vs mail interview) in a depressed pop-ulation [25]; and the development of a short-form CES-D in a general population [13]. No studies have been con-ducted to test the CES-D in a RA population or to test the scale's stability over time which is an important indicator of the scale's validity and its utility as an outcome meas-ure.
Current study
The aim of this study, therefore, was to use Rasch analysis to test the CES-D's internal validity in terms of unidimen-sionality and the stability of responses across time (three time points over a period of 12 months), age (three groups: ≤53 years old; 54–65 years old; 66+ years old) and gender (male/female) in an RA population. The sequence of Rasch analysis is briefly explained below, while a more detailed introduction may be found elsewhere [26].
Methods
Rasch AnalysisThe Rasch model is a unidimensional model based on the basic probability model that expects the only relationship between a respondent and the response to the scale item to be the respondent's ability on a given latent trait. That is, the probability p that a person n will affirm an item i is a logistic function of the difference between the person's ability θand the difficulty of the item b, and only a func-tion of that difference:
where pni is the probability that person n will affirm the item, whereby θis the person's level of depression, and b
is the level of depression expressed by a positive response to the item. The formulae can be expressed as a logit model:
p e
e ni
n b n b
i
i
= +
− −
(θ
θ
) ( )
where ln is the normal log, P is the probability of person
n affirming item i; θis the person's level of depression, and b is the level of depression expressed by the item. Both item and person parameter estimates are on the same log-odds units (logit) scale, allowing for a linear transforma-tion of the raw score.
When the model is applied to the polytomous case (as dis-tinct from measures that have a dichotomous response option), it is referred to as the rating scale model [27]. A further development of this model allows thresholds (0.5 probability point between adjacent categories) to vary in distance across items, and is known as the partial credit model [28], as expressed below:
In this study, the test of fit of the Rasch model was con-ducted by use of the RUMM2020 program [29]. Fit is assessed using two statistics, namely residuals and chi-square probability values. Residuals values greater than +/ -2.50 and/or the chi-square probability values <0.05 are indicative of item misfit. High positive fit residual values suggest low levels of discrimination and poor fit to the model, whereas high negative fit residual values may be indicative of item dependency or redundancy.
As well as testing the fit of the data to model expectations, Rasch analysis allows an evaluation of the scoring struc-ture of items, that is, do the response categories work as intended? This is indicated by ordered thresholds. The term threshold refers to the point between two response categories where either response is equally probable. It is expected that individuals with lower levels of the trait, in this instance depression, would endorse low scoring responses, while respondents with high levels of the trait would endorse high scoring responses, resulting in ordered thresholds. In addition, an examination of the lack of invariance by group is undertaken and referred to as Differential Item Functioning (DIF). In the current study this is investigated for time point (Time 1, Time 2, Time 3), as well as for gender (male/female) and age (three groups: ≤53 years old; 54–65 years old; 66+ years old). This type of analysis investigates whether or not the structure of the scale stays the same across groups, a requirement for valid group comparisons. Thus, to be able to compare patients across time, the scale must be stable, else observed differences may be confounded by the fact that, for example, a raw score of 25 at time 1 does not
mean the same as a raw score of 25 at time 2. Both chi-square fit, and the ANOVA DIF tests have significance lev-els set at 0.05, Bonferroni adjusted for the number of tests being undertaken at any stage.
Finally, when satisfied with fit to the model, threshold ordering and absence of DIF, a formal test of unidimen-sionality is undertaken by a Principal Components Anal-ysis (PCA) of the residuals. The absence of any meaningful pattern in the residuals will be deemed to support the assumption of unidimensionality of the scale [30]. This is formally tested by allowing the correlation between items and the first residual factor to determine 'subsets' of items and then testing, using a series of independent t-tests, to see if a person's estimate derived from each subset signifi-cantly differ [30]. For a unidimensional solution it would be expected that, given the difference in estimates are nor-mally distributed, no more than five percent of such tests would be outside the range ± 1.96. For values falling out-side this recommended range, a 95% confidence interval for the binomial test of proportions of the observed value is applied, and if the expected value of five percent falls within the confidence interval then the scale is deemed to be unidimensional.
Measures
CES-D is a 20-item scale designed to measure depressive symptoms experienced in the past week [7]. Responses range from 0 to 3: 0 = Rarely or none of the time (less than 1 day); 1 = Some or a little of the time (1–2 days); 2 = Occasion-ally or a moderate amount of the time (3–4 days); and 3 =
Most or all of the time (5–7 days). Four of the items (items 4, 8, 12 & 16) are positively worded and therefore should be reverse-scored. The CES-D total score is calculated by adding the scores for all 20 items giving a range from 0 to 60, with the suggested cut-off of 16 as indicative of prob-able clinical depression. In the RA population it has been suggested that a cut-off of 19 may be more appropriate because of the problem of criterion contamination with somatic items [31].
Study Participants
Raw scores for the CES-D items were obtained from a dataset with 157 RA participants who completed a range of psychological assessments across three time points within a 12-month period. The aim of the original study was to monitor depression over time in relation to clinical and other psychological outcomes. The retention rate at the second and third data collection points (Time 2 and Time 3) was 85% and 83% respectively. The mean age of participants was 57.85 (SD = 12.24) and 76% were female. RA duration ranged from six months to 47 years, with a mean of 13.07 (SD = 9.45) years. CES-D depression scores across the three measurement points were Time 1: M = 15.94 (SD = 11.92), Time 2: M = 14.30 (SD = 12.14),
ln P
P b
ni ni
n i 1−
=θ −
ln
P
P
b
nij
nij
n i
1
−
1
and Time 3: M = 14.42 (SD = 11.81). Further details of the participants and other assessments are reported elsewhere [4,32].
Informed consent was obtained from all participants and the study was approved by the relevant ethics committee. The participants were recruited through three private rheumatology clinics and had confirmed clinical diagno-sis of RA [33] and were currently medically managed for their condition.
Results
Overall fit of the CES-D scale
Of the 157 participants at Time 1, 134 at Time 2 and 131 at Time 3, 395 were usable for Rasch analyses. Initial inspection of the scale showed poor overall fit to the Rasch model as evident in the standardised item Fit Resid-ual statistic (mean = 0.039, SD = 3.14) and the item trait-interaction statistic (χ2 = 577.79, df = 160, p < 0.001).
The pattern of item response thresholds was then exam-ined, cross-sectionally (at each of the three time points) and longitudinally (three times points merged) to assess if disordering of thresholds may be contributing to misfit to the model. In the initial inspection, the thresholds of items 4, 9, 15 and 19 were found to be disordered (see Table 1 for item wording). The disordering of the thresh-olds suggests that respondents were not able to reliably distinguish the middle response categories ('some or a little of the time' and 'occasionally or a moderate amount of the time'). Initially rescoring of just those four items did not improve fit to the model. It was decided to rescore all items by merging the two middle categories, thus reducing the number of response categories from four to three, and changing the scoring from 0123 to 0112. Although this represents a change to the original format of the CES-D, it more closely represents the actual response patterns of the respondents in this sample.
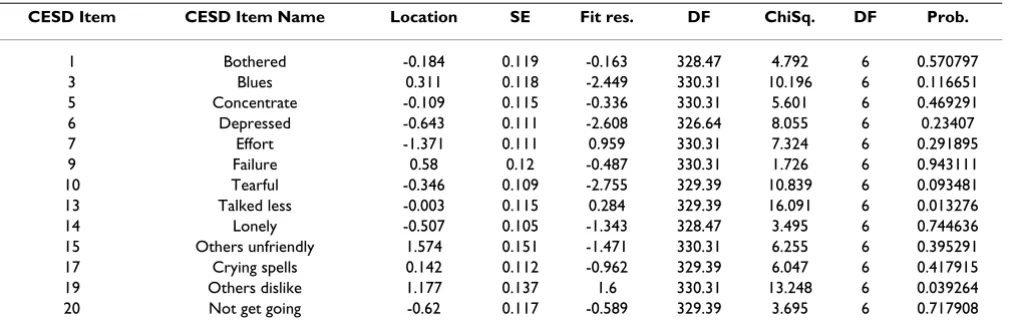
Next, items were examined individually for fit to the Rasch model. A number of misfitting items were identi-fied. Items were selected for removal if they recorded sig-nificant chi-square probability values or high positive or high negative residual values. Items were removed one at the time, with the overall model fit and individual item statistics checked after each step, until a satisfactory model was achieved as indicated by a non-significant chi-square value. In the final solution a total of seven items were removed: items 4, 11, 8, 16, 12, 18 and 2 (listed in order of their removal). The final individual item Fit Residual mean was -0.794 (SD = 1.335); the person Fit Residual mean was -0.432 (SD = 1.150) and the total chi-square interaction value was 97.364 (df = 78, p = 0.068), all of which indicated fit to the Rasch model. The final individ-ual fit statistics are provided in Table 1. The person sepa-ration reliability, which is equivalent to Cronbach's alpha, for the final 13-item solution was found to be very good (0.906).
Figure 1 shows the targeting of the revised scale in this sample, with the distribution of persons shown in the top half and the item thresholds in the bottom half. The over-all mean person logit is -1.784, which shows that this group of patients had levels of depression somewhat lower than the target for the scale (which would be indi-cated by a mean of zero).
Differential Item Functioning
Having reached a satisfactory fit to the Rasch model with the remaining 13 items of the CES-D scale, assessment of differential item functioning (DIF) was conducted using both statistical and graphical procedures. Graphs were plotted to compare item location with respect to time (three time points), age (three age groups) and gender (male/female). No DIF for time point was detected for any item. Using a Bonferroni-adjusted p value item 10 ('I felt tearful') and 17 ('I had crying spells') showed significant uniform DIF for both age (Figures 2 &3) and gender
(Fig-Table 1: Final fit of the CES-D items to the Rasch model
CESD Item CESD Item Name Location SE Fit res. DF ChiSq. DF Prob.
ures 4 &5). Tukey post-hoc tests showed that the partici-pants aged 53 yrs or less, were significantly more likely to endorse those items than the other two age groups (54 yrs to 65 yrs and 66 plus yrs). In terms of the gender differ-ences females were more likely to endorse items 10 and 17 than males.
Dimensionality
To test the unidimensionality of the 13-item CES-D scale, a principal component analysis was conducted on the residuals in order to identify the two most divergent sub-sets of items as indicated by positive loadings (Set 1) and negative loadings (Set 2) on the first factor (Table 2). The person ability estimates based on the subsets of items were then generated and compared using a series of inde-pendent t-tests (one for each case)[30]. It was found that 23 (6.39%) of the 360 t-tests showed significant differ-ences in the estimates generated, which is non-significant when 95% confidence intervals from a Binomial distribu-tion are applied to this propordistribu-tion. This supports the uni-dimensionality of the 13-item CES-D scale.
Cut Point
In order to determine the cut point for depression in the 13-item scale, the logit equivalent of the cut point of 16 in
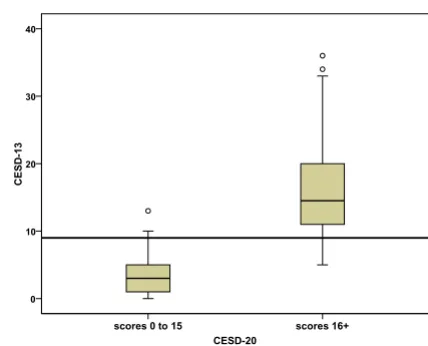
the full CES-D scale was calculated and then applied to the 13-item CES-D scale. The cut point of 16 out of 60 equates to a logit score of -0.89 which when applied to the 13-item scale (with 4 categories) equates to a cut-off point of 9. Of the 41% of cases identified as depressed using the original CESD-20, 96.3% were so classified using the CESD-13, indicating excellent agreement (kappa = 0.86). The very high sensitivity (89.6%) and specificity (95.8%) values also support the use of the cut point value of 9 on the CESD-13. Figure 6 shows a boxplot with the CESD-13 scores plotted separately for the individuals with scores above and below the cutpoint of 16 on the CESD-20.
Discussion
The aim of the current study was to use Rasch analysis to test the psychometric properties of CES-D in the RA pop-ulation, and its response stability across time, age and gender. Seven items were found to misfit the scale and were subsequently removed. Four of these items were pos-itively worded (item 4, feeling as good as others; item 8, feel-ing hopeful; item 12, feeling happy; & item 16, enjoying life), while the other removed items included one from the original CES-D 'depressed affect' factor (item 18, feeling sad) and two from the somatic factor (item 2, poor appetite
& item 11, restless sleep). The four positive items comprise
Item characteristic curve for item 10 DIF for gender Figure 4
Item characteristic curve for item 10 DIF for gender. Item characteristic curve for item 10 DIF for age groups
Figure 2
Item characteristic curve for item 10 DIF for age groups. Person item distribution graph for 13-Item CES-D scale Figure 1
the CES-D's factor 'positive affect', however other studies have suggested that the wording and the response pattern in scales may produce an artifactual factor structure [34] and as such have a significant impact on the psychomet-rics of scales [35]. A study of cancer patients (n = 475) and healthy general population (n = 255) using the CES-D suggested that the negative worded items (16 items) and the positive worded items (four items) may measure dif-ferent constructs and the authors recommend that only negative items should be used to measure depression [36].
The collapsing of response categories in the current study did not significantly improve fit to model expectations. While the collapsing pattern made sense from a distribu-tional point of view, further work needs to be done in larger samples to see if the current strategy is optimal. Two items, item 10 (tearful) and item 17 (crying spells) were also found to display DIF across age and gender, with younger participants and females more likely to endorse them than older and male participants. These age and gen-der differences may make them potentially unsuitable for
inclusion in core sets of scale items, but they may be clin-ically informative [12]. Again, replication of these results would strengthen the case for retaining, or excluding these items on the basis of DIF.
The results of this study differ from two other studies that used Rasch modelling with the CES-D. The Cole et al [13] study aimed to develop a short-form CES-D with the selec-tion of items partly driven by the preservaselec-tion of the four-factors identified in the full CES-D scale. As such, their 10-item short CES-D contains two of the positive 10-items rejected in our study (item 4, feeling as good as others & item 8, feeling hopeful about the future) but shares the other four removed items (items 2, 11, 16 & 18) in our study. In addition, item 17, which was retained in our study (although indicating some differential item functioning for age and gender), was removed in the Cole et al' [13] study. The Pickard et al [12] study compared depressed stroke patients (n = 32) and depressed primary-care patients (n = 366) and found that while the 20-item CES-D scale had a satisfactory fit in the primary-care group, items 11, 17, 15 and 4 were misfitting in the stroke group. Furthermore, when the two groups were compared, items 2, 11, 17 and 19 demonstrated significant DIF. While there is some overlap in the findings across these three studies, the differences may be due to the study focus (i.e. short scale version), methodology or populations and fur-ther exploration of CES-D is warranted using the Rasch model before recommending an altered/reduced version of the scale for clinical application.
In terms of the scale's targeting, the results of this study indicate a floor effect with the clustering of participants at Boxplot comparing cut point of 9 on CES-D 13 with the orig-inal cut point of 16 on CES-D 20
Figure 6
Boxplot comparing cut point of 9 on CES-D 13 with the orig-inal cut point of 16 on CES-D 20. The recommended cut point of 9 is shown as a horizontal line.
CESD-20
scores 16+ scores 0 to 15
CESD
-13
40
30
20
10
0 Item characteristic curve for item 17 DIF for gender
Figure 5
Item characteristic curve for item 17 DIF for gender.
Table 2: Principal component analysis of the residuals showing loadings on the first component extracted
Item Loading
CES-D3 -0.411 CES-D5 -0.406 CES-D1 -0.399 CES-D13 -0.218 CES-D9 -0.198 CES-D7 -0.102 CES-D20 -0.067
the low end of the scale (indicating low levels of depres-sion). Furthermore, the distribution of item thresholds indicate a shortfall in their distribution across the middle of the construct (Figure 1) suggesting the potential for adding items which reflect levels of depression at the mid-dle of the scale. However, the function of CES-D is to identify participants who are at risk/likely to be clinically depressed. As such the sensitivity of the scale at the cut point is of primary consideration. By equating the two scales (the CES-D 20 and CES-D 13) it was determined that the cut point in the shorter scale is consistent with the cut point [16] used with the original scale, showing excel-lent specificity and sensitivity against the original.
The current study is limited in terms of the relatively small sample and our findings should be further tested in other RA populations, for example, those with predominantly new onset disease. Furthermore, the modified scale and the proposed cut point for depression requires confirma-tion against other validated measurements (i.e. clinical assessment such as disease duration, disease activity and pain levels as well as other depression scales and psycho-logical outcomes measurements). The strengths of this study, however, are in the use of a modern, sophisticated statistical approach, Rasch modelling, to test the psycho-metric properties of the scale; and the use of longitudinal data to test the stability of the CES-D across time.
Notwithstanding the study limitations, our findings raise doubts about the internal construct validity of the full 20-item scale for those with RA, and suggest that the identifi-cation of clinical depression may be compromised by the scale's multidimensionality.
Conclusion
In conclusion, the revised CES-D scale shows promising internal validity for RA when evaluated under the strict requirements of the Rasch measurement model. We rec-ommend further validation studies of this revised scale against a clinical assessment and other depression scales in RA. Further testing in other clinical populations is needed to resolve the issues of category ordering and DIF.
Competing interests
The author(s) declare that they have no competing inter-ests.
Authors' contributions
All authors contributed to the current study's conceptual-ization, statistical analyses, interpretation, and prepara-tion of the article and approved the final manuscript.
References
1. Symmons D, Turner G, Webb R, Asten P, Barrett E, Lunt M, Scott D, Silman A: The prevalence of rheumatoid arthritis in the
United Kingdom: new estimates for a new century. Rheuma-tology 2002, 41:793-800.
2. Sheehy C, Murphy E, Barry M: Depression in rheumatoid arthri-tis—underscoring the problem. Rheumatology 2006,
45:1325-1327.
3. Dickens C, McGowan L, Clark-Carter D, Creed F: Depression in rheumatoid arthritis: a systematic review of the literature with meta-analysis. Psychosom Med 2002, 64(1):52-60.
4. Covic T, Tyson G, Spencer D, Howe G: Depression in rheuma-toid arthritis patients: demographic, clinical, and psycholog-ical predictors. J Psychosom Res 2006, 60:469-476.
5. Hyrich K, Symmons D, Watson K, Silman A: BSRBR Control Cen-tre Consortium on behalf of the British Society for Rhema-tology. Biologics Register Baseline comorbidity levels in biologic and standard DMARD treated patients with rheu-matoid arthritis: results form a national patient register.
Ann Rheum Dis 2006, 65:895–8.
6. Katon W, Schulberg H: Epidemiology of depression in primary care. Gen Hosp Psychiatry 1992, 14:237–47.
7. Radloff L: The CES-D scale: a self-report depression scale for research in the general population. Applied Psychological Meas-urement 1977, 1:385–401.
8. Rhee SH, Petroski GF, Parker JC, Smarr KL, Wright GE, Multon KD, Buchholz JL, Komatireddy GR: A confirmatory factor analysis of the Center for Epidemiologic Studies Depression Scale in rheumatoid arthritis patients: Additional evidence for a four-factor structure. Arthritis Care Res 1999, 12:392-400. 9. McCauley SR, Pedroza C, Brown SA, Boake C, Levin HS, Goodman
HS, Merritt SG: Confirmatory factor structure of the Center for Epidemiologic Studies-Depression scale (CES-D) in mild-to-moderate traumatic brain injury. Brain Injury 2006,
20:519-527.
10. Pandya R, Metz L, Patten SB: Predictive value of the CES-D in detecting depression among candidates for disease-modify-ing multiple sclerosis treatment. Psychosomatics 2005,
46:131-134.
11. Hann D, Winter K, Jacobsen P: Measurement of depressive symptoms in cancer patients: evaluation of the CES-D. J Psy-chosom Res 1999, 46:437–443.
12. Pickard AS, Dalal MR, Bushnell DM: A Comparison of Depressive Symptoms in Stroke and Primary Care: Applying Rasch Models to Evaluate the Center for Epidemiologic Studies-Depression Scale. Value Health 2006, 9:59-64.
13. Cole JC, Rabin AS, Smith TL, Kaufman AS: Development and vali-dation of a Rasch-derived CES-D short form. Psychol Assess 2004, 16:360-372.
14. Beck AT: Cognitive models of depression. Journal of Cognitive Psy-chotherapy: An International Quarterly 1987, 1:5-37.
15. Callahan LF, Kaplan MR, Pincus T: The Beck Depression Inven-tory, Center for Epidemiological Studies Depression Scale (CES-D), and General Well-Being Schedule depression sub-scale in rheumatoid arthritis. Criterion contamination of responses. Arthritis Care Res 1991, 4:3-11.
16. Blalock SJ, DeVellis RF, Brown GK, Wallston KA: Validity of the Center for Epidemiological Studies Depression Scale in arthritis populations. Arthritis Rheum 1989, 32:991-997. 17. Sheehan TJ, Fifield J, Reisine S, Tennen H: The measurement
structure of the Center for Epidemiologic Studies Depres-sion scale. J Pers Assess 1995, 64:507–521.
18. Huba GJ, Bentler PM: On the usefulness of latent variable casual modeling in testing theories of naturally occurring events (including adolescent drug use). J Pers Soc Psychol 1982, 43:604– 611.
19. Olsen LR, Mortensen EL, Bech P: The SCL-90 and SCL-90R ver-sions validated by item response models in a Danish commu-nity sample. Acta Psychiatr Scand 2004, 110:225-229.
20. Hays RD, Morales LS, Reise SP: Item response theory and health outcomes measurement in the 21st century. Med Care 2000,
38:II28–42.
21. Rasch G: Probabilistic models for some intelligence and attainment tests. Chicago , University of Chicago Press; 1960. 22. Embretson SE, Reise SP: Item response theory for psychologists.
Mahwah, NJ , Erlbaum; 2000.
Publish with BioMed Central and every scientist can read your work free of charge
"BioMed Central will be the most significant development for disseminating the results of biomedical researc h in our lifetime."
Sir Paul Nurse, Cancer Research UK
Your research papers will be:
available free of charge to the entire biomedical community
peer reviewed and published immediately upon acceptance
cited in PubMed and archived on PubMed Central
yours — you keep the copyright
Submit your manuscript here:
http://www.biomedcentral.com/info/publishing_adv.asp
BioMedcentral 24. Smith AB, Wright EP, Rush R, Stark DP, Velikova G, Selby PJ: Rasch
analysis of the dimensional structure of the Hospital Anxiety and Depression Scale. Psychooncology 2006, 15:817-827. 25. Chan KS, Orlando M, Ghosh-Dastidar B, Duan N, Sherbourne CD:
The interview mode effect on the Center for Epidemiologi-cal Studies Depression (CES-D) sEpidemiologi-cale: an item response the-ory analysis. Med Care 2004, 42:281-289.
26. Pallant JF, Tennant A: An introduction to the Rasch measure-ment model: an example using the Hospital Anxiety and Depression Scale (HADS). Br J Clin Psychol 2007, 46:1-18. 27. Andrich D: Rating formulation for ordered response
catego-ries. Psychometrika 1978, 43:561-573.
28. Masters G: A Rasch model for partial credit scoring. Psy-chometrika 1982, 47:149-174.
29. Andrich D, Lyne A, Sheridan B, Luo G: RUMM 2020. Perth , RUMM Laboratory; 2003.
30. Smith EV: Detecting and evaluation the impact of multidimen-sionality using item fit statistics and principal component analysis of residuals. J Appl Meas 2002, 3:205-231.
31. Martens MP, Parker JC, Smarr KL, Hewett JE, Slaughter BJ, Walker SE:
Development of a shortened Center for Epidemiological Studies Depression scale for assessment of depression in Rheumatoid Arthritis. Rehabil Psychol 2006, 5:135-139. 32. Covic T, Adamson B, Spencer D, Howe G: A biopsychosocial
model of pain and depression in rheumatoid arthritis: a 12-month longitudinal study. Rheumatology 2003, 42:1287–94. 33. Arnett FC, Edworthy SM, Bloch DA, McShane DJ, Fries JF, Cooper
NS, Healey LA, Kaplan SR, Liang MH, Luthra HS, Medsger Jr TA, Mitchell DM, Neustadt DH, Pinals RS, Schaller JG, Sharp JT, Wilder RL, Hunder GG: The American Rheumatism Association 1987 revised criteria for the classification of rheumatoid arthritis.
Arthritis Rheum 1988, 31:315–24.
34. Spector PE, Van Katwyck PT, Brannick MT, Chen PY: When two factors don’t reflect two constructs: how item characteris-tics can produce artifactual factors. Journal of Management 1997,
23:659-677.
35. McPherson J, Mohr P: The role of item extremity in the emer-gence of keying-related factors: an exploration with the Life Orientation Test. Psychol Methods 2005, 10:120-131.