R E S E A R C H
Open Access
Who pays for health care in Ghana?
James Akazili
1*, John Gyapong
2and Diane McIntyre
3Abstract
Background:Financial protection against the cost of unforeseen ill health has become a global concern as expressed in the 2005 World Health Assemblyresolution(WHA58.33), which urges its member states to“plan the transition to universal coverage of their citizens”. An important element of financial risk protection is to distribute health care financing fairly in relation to ability to pay. The distribution of health care financing burden across socio-economic groups has been estimated for European countries, the USA and Asia. Until recently there was no such analysis in Africa and this paper seeks to contribute to filling this gap. It presents the first comprehensive analysis of the distribution of health care financing in relation to ability to pay in Ghana.
Methods:Secondary data from the Ghana Living Standard Survey (GLSS) 2005/2006 were used. This was triangulated with data from the Ministry of Finance and other relevant sources, and further complemented with primary household data collected in six districts. We implored standard methodologies (including Kakwani index and test for dominance) for assessing progressivity in health care financing in this paper.
Results:Ghana’s health care financing system is generally progressive. The progressivity of health financing is driven largely by the overall progressivity of taxes, which account for close to 50% of health care funding. The national health insurance (NHI) levy (part of VAT) is mildly progressive and formal sector NHI payroll deductions are also progressive. However, informal sector NHI contributions were found to be regressive. Out-of-pocket payments, which account for 45% of funding, are regressive form of health payment to households.
Conclusion:For Ghana to attain adequate financial risk protection and ultimately achieve universal coverage, it needs to extend pre-payment cover to all in the informal sector, possibly through funding their contributions entirely from tax, and address other issues affecting the expansion of the National Health Insurance. Furthermore, the pre-payment funding pool for health care needs to grow so budgetary allocation to the health sector can be enhanced.
Background
Health care financing strategies have recently been given greater priority in international health policy debates and research [1]. A consensus is emerging on the need for developing countries to move towards universal cov-erage through pre-payment financing mechanisms, given that user fees and other direct payments have had and continue to have negative effects, particularly on poor individuals and households [2,3]. User fees and direct payments disproportionately affect the poor. Unfortu-nately exemptions that were introduced to try to cush-ion the effects of user fees have failed to protect the poor from catastrophic health care costs to the point
that 84% of those eligible for exemptions in Ghana never got them [4]. Evidence also shows that simply removing user fees, as some advocate, is not a sustain-able solution to health care financing. It has to be sup-ported by a simultaneous increase in funding through pre-payment mechanisms [5]. There is therefore a grow-ing need for developgrow-ing countries, particularly in Africa, to ensure fair financing in their health systems, and pro-vide universal coverage with financial protection for their populations if they are to achieve the health-related MDG goals by 2015 (which is less than five years away). WHO has recognized this need and in its World Health Assembly resolution WHA58.33 called on all member states to “plan the transition to universal coverage of their citizens” [6]. Identifying a combination of health care financing mechanisms that would provide the needed access to health care services for all citizens * Correspondence: akazjames@yahoo.com
1
Navrongo Health Research Centre, Ghana Health Service, P. O. Box 114, Navrongo, Ghana
Full list of author information is available at the end of the article Akaziliet al.International Journal for Equity in Health2011,10:26 http://www.equityhealthj.com/content/10/1/26
is best informed by understanding how the burden of health care financing currently falls on different seg-ments of the population.
Although there is a commitment to pursuing a univer-sal health system in Ghana, no assessment of equity in health care financing has been undertaken. To improve equity in health care financing and promote the goal of achieving universal coverage, there is a need to measure the degree of progressivity of existinghealth care finan-cing mechanisms to be able to establish the relative funding burden on the poor compared with the rich. This will allow us to identify which health care financing strategies are regressive (i.e. place a greater burden on the poor) and which are progressive (i.e. the rich contri-bute a higher proportion of their income than the poor). It will therefore provide insights into which financing mechanisms best provide financial protection and pro-mote universal coverage.
The paper thus seeks to investigate the extent to which paying for health care relates to people’s ability to pay and to investigate the relative progressivity of each of the financing mechanisms. The paper also assesses the overall progressivity in Ghana’s health financing sys-tem. The application of relevant tools for measuring the equity of financing mechanisms, particularly for asses-sing the progressivity of financing mechanisms, has remained focused primarily on the health care systems of developed countries and, more recently, some Asian countries [7,8]. There has been only very limited appli-cation in developing countries and almost none in sub-Saharan Africa [9,10]. This is despite the apparent importance of health care financing equity as a central policy goal in many health systems in developing coun-tries. With the exception of Tanzania and South Africa, no such research has been carried out in Africa and so the study not only serves as the first comprehensive assessment of the relative progressivity of the various health financing mechanisms in Ghana but has broader relevance to other African countries.
Data and Methods
The secondary data used for the financing incidence cal-culations were the latest Ghana Living Standards Survey (GLSS) of 2005/2006 collected by the Ghana Statistical Service, a national body responsible for conducting all demographic, health and living standards surveys. This is the fifth time this survey has been conducted, hence its name of GLSS 5. The sample size for GLSS 5 was 8,687 households (see Table 1 for details). Data collected by a GLSS relates to all aspects of household decision-making and well-being. The nationally representative data contain information on household consumption of both durable and non-durable items. Data on the con-sumption of durable items were collected for the
previous 12 months whilst those for non-durable or fre-quently purchased items were collected weekly for ten weeks using a weekly diary.
To complement the GLSS data, a primary household survey1 was conducted in a sample of six districts focus-ing on contributions to the NHI and direct health care payments. The SHIELD survey collected data on house-hold expenditure on health care and househouse-hold socio-economic status (SES) among other variables. The SHIELD household survey was weighted to be more representative of the national population, based on the proportion of rural and urban population as well as the insured and uninsured population in the three broad ecological zones of the country.
Analysis of financing incidence requires two key vari-ables, the ability to pay or socio-economic status and the amount paid towards health care through various payment mechanisms. Each of them is examined in rela-tion to how they were analyzed in this study.
The ability to pay or socio-economic status (SES) variable The study related health care payments to SES within households to determine the incidence of health care payments (i.e. health care payments as a percentage of household resources). The key issue is how best to mea-sure SES or living standards. The approaches available for measuring SES that are applicable to the evaluation of the incidence of health care payments are household income and household consumption expenditure.
According to the literature, the most‘relevant’measure of SES must depend largely on the availability of the required data. As noted in a study in Nepal, there is no perfect measure of SES [11]. Income and consumption expenditure measures have each been used in different studies [8]. Reported income is often seen as a good mea-sure of SES. The use of income as a meamea-sure of socio-economic status for example, allows one to examine income elasticity in health care payments. Income also measures the degree of household control over resources (which they could use if they so wish) [12].
Table 1 Data source
Secondary Primary
Name of Survey GLSS SHIELD
survey
Year of Survey 2005/2006 2008
Number of households 8,687 2,986
Number of individuals 36,488 14050 Sample as a % of total pop of
Ghana
0.17 0.007
Weighted to national population
Yes Yes
Organisation Ghana Statistical Services
However, income data have their drawbacks. First, the lack of an organized labour market particularly in sub-Saharan Africa and income variability over time does not allow it to be a good estimate of SES especially in developing countries like Ghana. Income could also be underestimated in developing countries with a large informal sector population and subsistence agriculture activities. Also for fear of taxes or other related issues, people tend to under report their income. Due to the drawbacks with income measurement, household con-sumption expenditure is often preferred in this kind of analysis. It is important to note that consumption expenditure also has its drawbacks. For instance house-holds tend to under-declare what they spend on certain additive goods (e.g. alcohol, cigarettes) or illicit items (e. g. drugs, prostitution). Despite the drawbacks, consump-tion expenditure is a better measure than income parti-cularly in developing countries with a large informal sector. In the first place, consumption expenditure smoothes out income irregularities and so reflects long-term average well-being. Secondly, consumption expen-diture tends to be less understated than income because it is easier to provide expenditure information than income [13].
The construction of the socio-economic measure in this study is based on household’s reported expenditure and consumption of food, housing and other non-food items. The measure also takes into consideration con-sumption from sources other than purchases from the market (e.g. subsistence agriculture products). The unit of analysis in the comprehensive health care financing incidence analysis and cross sectional case studies is the household. Households were divided into five quintiles for aspects of the analysis.
Financing mechanisms-calculations
Tax (direct and indirect) incidence analysis
An analysis of tax incidence is required in this study because the Ghanaian health care system, as in many other developing countries, is significantly financed by direct and indirect tax revenue.
Certain assumptions2 have to be made about the tax-shifting element. These tax-shifting assumptions facilitate the allocation of the burden of each tax payment to dif-ferent income groups [14]. In this study, we assume that the incidence of direct tax (mainly personal income tax in Ghana) falls on the legal tax payer and indirect taxes (import, fuel levy, VAT) fall on the consumer. The only tax that has little agreement in the literature about its incidence assumption is corporate tax (CT) and due to the lack of consensus as to how corporate tax incidence should be calculated, a number of approaches have been put forward. Different authors have assumed the burden
or incidence of corporate tax differently [13,14]. The key elements of the debate regarding this tax have been whether increases in corporate tax will result in lower wages, lower retail earnings or higher prices? Some wri-ters [13-15] assume an equal share (50%) of the burden for consumers and shareholders (mainly foreign owned in Ghana) and this is applied in this study. The assump-tion of an equal share (50%) of the burden of corporate tax to consumers and shareholders is applied here because of the lack of consensus in the literature as to who ultimately bears the burden of corporate tax. The taxes identified and measured in this study included direct taxes (income tax and corporate tax), indirect taxes (VAT, National Health Insurance Levy (NHIL), fuel levy, import duty). These taxes make up over 95% of the total tax revenue collected in Ghana. In calculat-ing the incidence of tax payments, each tax payment per household was estimated from relevant sections of the GLSS and triangulated with actual revenue from this tax as reported by the tax collector or Ministry of Finance.
Non-tax health care financing incidence analysis
Apart from tax, health care in Ghana is also financed by health insurance contributions made up of premiums (through District Health Insurance Schemes-DHIS) from the informal sector and payroll deductions3 (by Social Security and National Insurance Trust-SSNIT) to the National health insurance scheme as well as out-of-pocket (OOP) payments. Before allocating the above health care payments to income groups by quintiles of households, it is important to state the incidence assumption as to who bears the burden of each of the health care payments. The incidence of SSNIT contribu-tions for instance falls on formal sector workers and that of the DHIS contributions fall on those who are in the informal sector who are insured. OOP payments are assumed to directly affect the consumer of the service. Most previous estimates of the incidence of OOP pay-ments in developing countries have relied on data from small-scale health surveys that are not nationally repre-sentative and often restricted to rural areas [16,17]. We analysed data from the GLSS which has comprehensive information on health care and household consumption expenditure and which allow us to estimate the magni-tude of the incidence of OOP payments in Ghana.
With regard to the incidence of the national health insurance (NHI) contributions, comprehensive data on health insurance contributions including premium and registration payments largely by the informal sector was collected through the SHIELD household survey in six districts in 2008. As the NHI was only introduced in 2004, the GLSS (conducted in 2005) did not capture much information on these payments, hence the need for the SHIELD survey. The premium contributions Akaziliet al.International Journal for Equity in Health2011,10:26
http://www.equityhealthj.com/content/10/1/26
paid by the informal sector directly to the District health insurance schemes is graduated by law (Act 650). It ranges from ¢72,000 to ¢480,000 (US$8.00 to US$53.00) [18,19]. The graduation was designed in such a way that the poor should pay the lowest rate and the higher rates should be paid by the rich. However, in reality it appears that the premium payment generally is flat, due to the difficulty of assessing an informal sector household’s ability-to-pay, which makes it all the more important to document the distribution of the burden of this payment mechanism across the population as a whole. The GLSS was used to predict the consumption expenditure vari-able in the SHIELD data. The assumption was made that the variable on frequent spending in the SHIELD data set was analogous to the frequent spending vari-ables in the GLSS data. The expenditures on frequently purchased items, age of the head of the household and location (rural/urban and region) of the household were identified and used to predict the total consump-tion expenditure through a log regression model. The correlation of the prediction was about 80%. The pre-diction was based on the GLSS and coefficients obtained from this regression were used to predict the consumption expenditure in the SHIELD survey [20]. Table 2 provides a summary of each type of financing mechanism and the quantification technique. It should be noted that the 4.3% that constitute other taxes in Table 2 was allocated to the identified taxes according to their percentage share of the total taxes in the ana-lysis. This technique was used in a similar study in South Africa [10].
The Kakwani index for measuring progressivity of health care financing
In addition to estimating contributions to each financing mechanism as a percentage of consumption expenditure in each quintile, it was necessary to calculate the inci-dence of financing using the Lorenz and concentration curves to establish whether a health care financing mechanism is progressive, regressive or proportional relative to ability to pay (ATP) or SES. The Lorenz curve is a graphical representation of the cumulative distribution function of the empirical probability distri-bution of wealth or ATP or SES. The concentration curve plots the cumulative distribution of health care payments, while the concentration index is twice the area between the concentration curve and line of equal-ity (the 45º line running from the bottom-left corner to the top-right). To enable the illustration of the degree of relative progressivity of each health care payment mechanism and the overall health financing incidence, we use the Kakwani index. Other methods like the Suits index could be used but the Kakwani index is more popular and widely used in this type of analysis [8,21].
The Kakwani index is defined as twice the area between the Lorenz curve for gross consumption expenditure (ATP or SES) and the concentration curve for health care payments [9,22]. Kakwani index was computed as the difference between the concentration coefficients of health care payments and the Gini coefficients of income (i.e. expenditure). The value of the Kakwani index ranges from -2 to 1 [22]. A positive Kakwani index indicates the health care financing system is pro-gressive, so that the Lorenz curve lies above the concen-tration curve, and vice versa if it is regressive. A Kakwani index of zero indicates proportionality of health care payments and thus the Lorenz and concen-tration payments curves would coincide. According to Wagstaff and others, when the concentration curve for health care payments lies completely outside the Lorenz curve of ATP or SES (which in this case is based on household consumption expenditure), the health care payment is progressive. The opposite is true if it is regressive. Proportionality is attained when the two curves coincide [21]. Test of dominance, using the stan-dard errors and point estimators of the concentration and Lorenz curves were performed to assess whether the difference between the concentration and the Lorenz curve or the 45 degree line is statistically significant [23].
Results General taxes
Direct taxes
Direct taxes are those paid directly to the revenue authorities. The main direct taxes in Ghana are Personal Income Tax (PIT) and Corporate Tax (CT). The con-centration curve for PIT and CT (using the assumption that 50% of CT is distributed across household accord-ing to their reported consumption expenditure on man-ufactured goods and 50% across shareholders based on receipts of dividends) were constructed as well as the Lorenz curve for household consumption expenditure. As can be seen in Figure 1, the concentration curves of PIT and CT lie outside the Lorenz curve. In other words the Lorenz curve dominates the concentration curves of PIT and CT payments indicating that they are progressive. The Kakwani index of PIT and CT was cal-culated at 0.256 and 0.099 respectively (see Table 3) and this confirms the progressivity of PIT and CT.
Indirect taxes
expenditure. The Kakwani index (Table 3) is positive confirming progressivity. With regard to the fuel levy (composed of levies from petrol, diesel, engine oil, kero-sene and other lubricants), the concentration curve dominates the Lorenz curve, suggesting that the fuel levy is regressive (see Figure 2). The Kakwani index for
the fuel levy was -0.041 (see Table 3) and this means that the fuel levy in Ghana is regressive. In terms of import duty, the concentration curve is completely dominated by the Lorenz curve. To obtain the magni-tude of the progressivity of import duty, the Kakwani index was calculated and has a value of 0.129.
Table 2 Financing incidence analysis estimation techniques
Component Share in Total Health care financing
Source of Data
Ratesa Computation technique
Taxes 47% Personal
Income Taxc
5.2% GLSS, 2005/ 2006
5%-20% depending on income level.
Apply the appropriate tax rate and tax thresholds on the gross taxable income (salaries and wages received, income from business or professional practice/activities, part of dividends and interest received and/or accrued on deposits) of working age individuals within each household within the taxable range
Corporate Income Tax
7.1% GLSS, 2005/ 2006
Rate is 28% and this is paid quarterly in the case of large companies.
Apportioning the total corporate tax receipts based on the Ministry of Finance data to households based on the tax shifting assumptions. Assumption of tax shifting includes certain percentage borne by shareholders (the GLSS collected information on those who receive dividends) and the rest by households through consumption. The tax shifting
assumption was equal (50:50) tax burden shared between consumers and shareholders/capital owners
Value Added Tax (VAT)
11.3% GLSS, 2005/ 2006
15% on standard rate goods and services
The VAT rate is applied to expenditure of goods and services that are standard rated excluding the zero-rated and exempted goods (since 2.5% is specially earmarked fund for education and 2.5% for health services, 10% was considered in the calculations)
National Health Insurance Levy
2.4% GLSS, 2005/ 2006
2.5% on standard rated goods and services
The same distribution across households as VAT but at 2.5%. NHIL rate is applied to expenditure of goods and services that are standard rated excluding the zero-rated and exempted goods (the same goods and services as VAT). Import Duty 8.0% GLSS, 2005/
2006
Varied depending on item Comprehensive list of items subject ot import duty and amount received in duty for each item was obtained from Custom Excise and Preventive Service (CEPS) and this amounts were allocated to households based on reported consumption of these imported items from GLSS Fuel Levy 8.5% GLSS, 2005/
2006
¢716.72/litre for petrol ¢429.96/litre for Diesel ¢353.88/litre for kerosene
Since fuel is consumed by households (for both personal and public transport) as well as corporate users, estimation involved a process of generating the component attributable to public transport users, users of private transport and those attributable to users in businesses
Other 4.3% GLSS, 2005/
2006
Includes taxes on cigarette, drinks, stamps, airport departures, and unidentified levies.
Not calculated (small share of total revenue)
Insurance 5% National
Health Insurance Scheme
5% SHIELD
household survey 2008b
Total national health insurance contributions is made up of premium contributions of the informal sector and payroll deduction of formal sector workers
Out-of-pocket payment
48%
OOP payments
48% GLSS, 2005/ 2006
Comprehensive household expenditure on medicines, consultations, preventive and curative treatments, procedures excluding transportation were summed up
a
This applies to the taxes and are based on the 2005/2006 assessment year: NB: GLSS-Ghana Living Standard Survey. b
This was our own survey that was collected to complement the GLSS data and to answer key questions on the NHIS. c
Rebates is not a common practice in Ghana *Inter-bank exchange rate = ¢9,072.12 to US$1.00 in 2005.
Akaziliet al.International Journal for Equity in Health2011,10:26 http://www.equityhealthj.com/content/10/1/26
Total tax
Pooling all the components of general tax together (direct and indirect), but excluding the NHIL and edu-cation earmarked tax, the incidence of tax overall was calculated. Figure 3 shows that overall taxation is pro-gressive. Figure 3 shows the incidence of thatportionof general taxes that goes to health as well as the NHIL. It is to be noted that government allocated 15% of tax rev-enue to the health sector in 2005/2006. The only tax to which the 15% figure was not applied was the NHIL as this is an earmarked tax that goes in total to the health sector. The results shows that tax overall is progressive (Kakwani index = 0.130).
The concentration curves for direct, indirect (exclud-ing NHIL and dedicated education tax) and overall taxes are compared with the Lorenz curve of consumption expenditure (see Figure 4). Direct tax is the most pro-gressive as is revealed by the magnitude of the domi-nance of the Lorenz curve over the concentration curve. The concentration curve for direct tax lies well outside the Lorenz curve (Figure 4).
Non-tax health care payments
Apart from allocations from tax revenue, the Ghanaian health system is financed by direct out-of-pocket (OOP) payments (accounting for nearly half of all health care expenditure) and health insurance (composing of pre-miums and payroll deductions). The concentration curves for OOP and health insurance were constructed and as can be observed in Figure 5, OOP payments are a regressive means of funding health care in Ghana. This is because the concentration curve of OOP pay-ments dominates the Lorenz curve throughout the dis-tribution except for the last section (top right corner)
where the two curves (Lorenz and concentration) appear to coincide (see Figure 5). The regressivity of OOP pay-ments is confirmed by the negative value for the Kak-wani index (-0.070). In contrast, contributions to the NHI are progressive with the burden of these payments rests more on the rich than the poor. The concentration curve of total NHI contributions confirms the progres-sivity of the total NHI contributions (Figure 5). The concentration curve lies completely outside the Lorenz curve. Further confirmation of the progressivity of the total NHI contribution is shown in Table 3, where the Kakwani index is positive (0.144). It is important to mention that NHI contribution from the formal sector is progressive (Kakwani index = 0.256) whilst the infor-mal NHI contributions (premiums) are regressive (Kak-wani index = -0.307).
Total health care financing incidence
Table 3 combines all sources of health care payment except NHI contributions in Ghana (general tax, NHIL and out-of-pocket payments) and measures their total payments as a proportion of consumption expenditure. The table also provides summary statistics of the Gini coefficient of the consumption expenditure and the con-centration index of health care payments from which the Kakwani indices are calculated.
Table 3 shows that health care financing is generally progressive (i.e. the combined effect of general tax, NHIL and out-of-pocket payments from GLSS 2005/ 2006 data and the NHI contributions from SHIELD 2008 data). It should be noted again that only a portion of total government tax resources (i.e. 15% in 2005/ 2006) was allocated to the health sector and this is fac-tored into the calculation of the general tax component.
Personal income tax Corporate tax
0
.2
.4
.6
.8
1
0 .2 .4 .6 .8 1
Lorenz (y) Personal income tax
Corporate tax 45 degree line
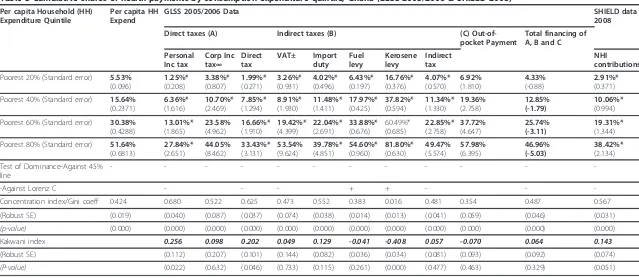
Table 3 Cumulative shares of health payments by consumption expenditure quintile, Ghana (GLSS 2005/2006 & SHIELD 2008)
Per capita Household (HH) Expenditure Quintile
Per capita HH Expend
GLSS 2005/2006 Data SHIELD data
2008
Direct taxes (A) Indirect taxes (B) (C)
Out-of-pocket Payment
Total financing of A, B and C
Personal Inc tax Corp Inc tax∞ Direct tax VAT± Import duty Fuel levy Kerosene levy Indirect tax NHI contributions
Poorest 20% (Standard error) 5.53%
(0.096) 1.25%* (0.208) 3.38%* (0.807) 1.99%* (0.271) 3.26%* (0.931) 4.02%* (0.496) 6.43%* (0.197) 16.76%* (0.376) 4.07%* (0.570) 6.92% (1.810) 4.33% (-0.88) 2.91%* (0.371) Poorest 40% (Standard error) 15.64%
(0.2371) 6.36%* (1.616) 10.70%* (2.469) 7.85%* (1.294) 8.91%* (1.930) 11.48%* (1.411) 17.97%* (0.425) 37.82%* (0.594) 11.34%* (1.330) 19.36% (2.758) 12.85% (-1.79) 10.06%* (0.994) Poorest 60% (Standard error) 30.38%
(0.4288) 13.01%* (1.865) 23.58% (4.962) 16.66%* (1.910) 19.42%* (4.399) 22.04%* (2.691) 33.88%* (0.676) 60.49%* (0.685) 22.85%* (2.758) 37.72% (4.647) 25.74% (-3.11) 19.31%* (1.344) Poorest 80% (Standard error) 51.64%
(0.6813) 27.84%* (2.651) 44.05% (8.462) 33.43%* (3.131) 53.54% (9.624) 39.78%* (4.851) 54.60%* (0.960) 81.80%* (0.630) 49.47% (5.574) 57.98% (6.395) 46.96% (-5.03) 38.42%* (2.134) Test of Dominance-Against 45%
line
- - -
--Against Lorenz C - - - + + - -
-Concentration index/Gini coeff 0.424 0.680 0.522 0.625 0.473 0.552 0.383 0.016 0.481 0.354 0.487 0.567 (Robust SE) (0.019) (0.040) (0.087) (0.037) (0.074) (0.038) (0.014) (0.013) (0.041) (0.059) (0.046) (0.031)
(p-value) (0.000) (0.000) (0.000) (0.000) (0.000) (0.000) (0.000) (0.000) (0.000) (0.000) (0.000) (0.000)
Kakwani index 0.256 0.098 0.202 0.049 0.129 -0.041 -0.408 0.057 -0.070 0.064 0.143 (Robust SE) (0.112) (0.207) (0.101) (0.144) (0.082) (0.036) (0.034) (0.081) (0.093) (0.092) (0.074)
(P-value) (0.022) (0.632) (0.046) (0.733) (0.115) (0.261) (0.000) (0.477) (0.463) (0.329) (0.051)
Source: Author.
Note: For shares: Bold indicates significant difference from population share (5%). * indicates significant difference from expenditure share (5%).
(Standard errors for concentration and Kakwani indexes are robust to heteroskedasticity and within cluster correlation).
∞Assumption is that corporate tax is distributed equally (50/50) across households (based on reported consumption of manufactured goods) and shareholders (based on receipt of dividends) ** NHIL: National Health insurance levy (2.5% of social security of formal workers).
# Dominance test (- indicates the 45% degree line/Lorenz curve dominates the concentration curve: + indicates concentration curve dominates 45%-degreeline/Lorenz curve. Blank indicates non dominance. ± NHIL has same results as that of VAT.
The Kakwani index of 0.064 for the combined general tax, NHIL and out-of-payment and 0.143 for the NHI contributions shows that health care financing is Ghana is generally progressive. It can be seen from Table 4 that the poor (Quintile 1 and 2) are nevertheless making substantial contributions of their meagre income to health care, particularly through OOP payments.
Discussion
African countries face many challenges in health care financing, not least being the inadequacy of funding and the high direct out-of-pocket payments for health care. In this context, there is a critical need for a comprehen-sive analysis of the progressivity of health care financing to inform debate on alternative health care financing Fuel levy
Import duty VAT
0
.2
.4
.6
.8
1
0 .2 .4 .6 .8 1
Lorenz (y) Import duty
Fuel levyValue added tax 45 degree line
Figure 2Concentration curves of Fuel, VAT and Import duty payments and Lorenz curve of household expenditure, Ghana: 2005/ 2006.
0.0% 0.5% 1.0% 1.5% 2.0% 2.5% 3.0% 3.5%
Paym
en
t as %
o
f H
H
cons
um
pt
ion e
xpe
nd
Quintile 1(poorest)
Quintile 2 Quintile 3 Quintile 4 Quintile 5(richest) Socio-economic status
General tax NHIL
a Only portion (15%) of tax goes to health
approaches. This is especially the case for Ghana at a time when the country is still in the process of restruc-turing its health care financing in the wake of the intro-duction of a national health insurance system. The findings show that direct taxes, which comprise personal income tax and corporate tax, are progressive with posi-tive Kakwani indices. The progressivity of direct tax is consistent with findings elsewhere (see Table 5).
Indeed in almost all countries examined to date, per-sonal income tax is progressive in essence because these taxes are explicitly structured to be progressive. Corpo-rate tax in Ghana was found to be progressive, but has a lower Kakwani index than personal income tax. Taken together, this means of course that direct taxes are pro-gressive which is consistent with the results of other published empirical studies [8,24,25].
0
.2
.4
.6
.8
1
0 .2 .4 .6 .8 1
Lorenz (y) Total tax
indirect tax direct tax
45 degree line
Figure 4Concentration curves of Total tax payments and Lorenz curve of household expenditure, Ghana: 2005/2006.
NHI (both formal and informal contribution) OOP payments
0
.2
.4
.6
.8
1
0 .2 .4 .6 .8 1
Lorenz (y) National health insurance
out-of-pocket 45 degree line
Figure 5Concentration curves of OOP and NHI payments and Lorenz curve of household expenditure, Ghana: 2005/2006. Akaziliet al.International Journal for Equity in Health2011,10:26
http://www.equityhealthj.com/content/10/1/26
In contrast, the international evidence (see Table 5) on indirect taxes suggests that these tend to be regressive in some countries but progressive in others. They have been found to be regressive in Sweden, Denmark, Japan, Sri Lanka and South Africa [8,10,26] but progressive in many low- and middle-income countries in Asia (e.g. Bangladesh, Thailand and China) [8]. In Ghana, indirect taxes analyzed in this study include import duty, fuel levy, VAT and the National Health Insurance Levy (NHIL). With the exception of the fuel levy, the other elements of indirect taxes were found to be progressive (see Table 3). Fuel is regressive because of the influence
of kerosene taxes, which is largely consumed by the poor. VAT is progressive because of the wide range of exemptions on agricultural goods and other goods lar-gely consumed by the poor and that many goods pur-chased in rural markets escape the VAT ‘net’. The progressivity of VAT is important in Ghanaian health care financing since the NHIL, which is the main source of the NHIS is a component of VAT. However the Kak-wani index is less than 0.10. It is necessary to sound a warning here that if, as is likely, the economy becomes more formalized and more people end up paying VAT, VAT and the NHIL might well move to being Table 4 Distribution of total health financing as a proportion of household consumption expenditure by quintile in Ghana
Financing sources
Socio-economic status General taxa NHILa NHI contributionsb OOP paymentsa
Quintile 1 (poorest) 1.50% 0.55% 0.08% 2.87%
Quintile 2 1.62% 0.59% 0.09% 2.83%
Quintile 3 1.84% 0.64% 0.09% 2.61%
Quintile 4 2.31% 0.73% 0.11% 2.18%
Quintile 5 (richest) 3.17% 0.98% 0.13% 2.76%
a
GLSS 2005/2006 datab
SHIELD 2008 data.
Table 5 Cross-country comparison of progressivity indices (distributional incidence of health care financing)
Country Year Financing mechanisms Total financing
Direct tax Indirect tax NHI/SHI contributions OOP or direct payments
Africa
Ghana 2005/2006 0.202 0.057 0.144 -0.068 0.071
South Africa 2005/2006 - - - -0.0259 0.065
Asian countries
Bangladesh 1999/2000 0.552 0.111 - 0.219 0.214
Thailand 2002 0.510 0.182 0.180 0.091 0.197
Phillippines 1999 0.381 0.002 0.205 0.139 0.163
Malaysia 1998/1999 0.395 -0.078 0.081 0.104 0.186
Taiwan 2000 0.244 0.040 -0.075 -0.079 -0.029
Sri-Lanka 1996/1997 0.569 -0.010 - 0.069 0.085
Indonesia 2001 0.196 0.074 0.306 0.176 0.173
China 2000 0.152 0.040 0.235 -0.017 0.040
Nepal 1995/1996 0.144 0.114 - 0.053 0.063
Japan 1998 0.100 -0.223 -0.042 -0.269 -0.069
OECD countries
Portugal 1980 0.279 0.079 0.277 -0.158 0.063
The Netherlands 1987 0.185 -0.009 -0.002 -0.059 -0.034
Spain 1980 0.170 0.023 -0.063 0.016 -0.023
Italy 1987 0.054 0.001 0.028 -0.004 0.022
USA 1981 0.162 -0.174 -0.035 -0.387 -0.145
UK 1985 0.131 -0.059 0.043 -0.190 0.032
Ireland 1987 0.250 -0.120 0.110 -0.070 0.034
proportional or even regressive. This possible change needs to be acknowledged and there is a need for con-tinual monitoring of the incidence of this financing mechanism (NHIL) so that Ghana does not end up using a regressive financing mechanism to fund the NHI. Considering all the indirect taxes together, indirect tax is progressive as demonstrated by a positive Kakwani index. This is consistent with other low-income coun-tries like Bangladesh, Malaysia, Thailand and Tanzania [8,24,27].
The national health insurance contributions, which are made up of formal sector payroll deductions and infor-mal sector premium contributions, are progressive over-all. This progressivity is largely a function of the payroll deductions. However, the informal sector’s premium contributions, which are the basis for the expansion of the NHI to universal coverage, were found to be very regressive. Thus, within the informal sector, the poor are bearing the brunt of the NHI contributions (relative to their available household resources) compared to their richer counterparts. This is because everybody in the informal sector pays the same contribution, which in turn is the result of the failure to implement the sys-tem of graduated premiums and full exemptions for the poorest that was part of the original design of the national health insurance scheme (NHIS). This finding means that policy makers, government and all stake-holders of the NHIS must review the design of the NHIS and its implementation, not just the financing per se but also the other institutional arrangements such as the graduation of premiums and the policy on the operation of exemptions, which are simply not func-tional at present. The NHIS financing arrangements are supposed to be pro-poor, but as the scheme operates currently, they are not [28].
Apart from taxes and the NHI, the Ghana health care system is largely funded by direct out-of-pocket (OOP) payments. These accounted for 48% of total health care financing in 2005/2006. This form of financing has been found (with few exceptions) to be regressive (see Table 5). Indeed as is the case in Ghana, OOP payments have been found elsewhere to be more regressive (or at best, less progressive) than any other form of health care financing [8,26]. Even in countries (such as Bangladesh, Indonesia, Philippines and Korea) where OOP payments are progressive [8], the reason for this is that poor households simply cannot afford to pay for health care and therefore do not access health services. In other words, the seemingly‘progressive’OOP payments can be simply attributed to the fact that the poorest of the poor do not use health services when they are required to pay at the point of service delivery.
On the whole, health care financing in Ghana was found to be progressive. This finding is largely driven by
the progressivity of most forms of tax, which make up close to 50% of total health financing. It remains the case, however, as the paper has shown that some taxes such as the fuel levy and out-of-pocket payments are regressive thereby diminishing the level of overall pro-gressivity in health care funding.
The results presented in the previous section thus provide the answer to the key question“who pays for health care in Ghana?” The brief answer is that it is lar-gely the better-off who pay for health care financing; however, the poor are also making substantial contribu-tions relative to their household resources towards health care financing in Ghana, as can be observed in table 3 and 4.
Conclusion
Interest in the distribution of health care payments across socio-economic groups arises in part due to its potential redistributive effect, particularly in terms of compulsory contributions towards health financing (e.g. through tax and national health insurance). Progressive financing takes proportionately more from the rich than the poor and could leads to a more equal the post-tax distribution of income. The paper assessed the incidence of health care financing in Ghana employing concentra-tion curves and Kakwani’s progressivity indices. This analysis represents the first study in West Africa to measure the progressivity of each of the health care financing sources and of the whole health care financing system in a comprehensive manner.
In terms of an assessment of the equity of health care financing in Ghana, this study highlights the regressivity of out-of-pocket payments. It was the recognition by government of the heavy burden of these payments and the barrier they create to health service access that prompted the introduction of the national health insur-ance in Ghana. However, the fact that OOP payments still constitute almost half of total health care expendi-ture and the extent of their regressivity highlights the need for more concerted efforts to increase the share of pre-payment financing mechanisms. Although, exemp-tions and waivers were advocated and implemented to reduce the burden of OOP payments, their effects have largely been negative due to poor implementation (e.g. lack of clarity in policy strategy) and insufficient funds [2,4,29].
There are a number of positive messages from this study in terms of the NHI. Firstly, the NHI levy, which is part of VAT, is currently progressive, but this may change in future and requires ongoing monitoring. Sec-ond, the contributions by formal sector workers are also progressive. However, the major concern in relation to the NHI is that contributions made by the informal sec-tor are highly regressive. These contributions constitute Akaziliet al.International Journal for Equity in Health2011,10:26
http://www.equityhealthj.com/content/10/1/26
a very small share of total NHI revenue (about 5%) and the government is currently considering instituting a ‘one-time payment’for those in the informal sector [20], which will effectively translate into tax funding of the contributions for all outside the formal sector. The find-ing of the regressivity of insurance contributions by the informal sector is also relevant to other low- and mid-dle-income countries which are pursuing health insur-ance for the informal sector and/or are planning to implement mandatory health insurance on a contribu-tory basis for the entire population as part of a strategy for moving to universal coverage.
For Ghana to attain adequate financial protection for its citizens and ultimately achieve universal coverage, it needs to extend pre-payment cover to all in the informal sector, possibly through funding their contributions entirely from tax and possibly increasing budgetary allo-cation to the health sector. While this is not a simple task, it is the road that must be travelled if Ghana is to achieve its goal of universal coverage.
Endnotes
1 This survey is call “Strategies for Health Insurance for Equity in Less Developed countries-SHIELD"(http://web. uct.ac.za/depts/heu/SHIELD/about/about.htm)
2 Conventional tax incidence studies compute tax incidence on the basis of annual data for income sources and expenditure patterns and also on the basis of several assumptions concerning how the different taxes are shifted to households either because they are consumers, producers or owners of factors of produc-tion (land, labour, and capital). These assumpproduc-tions are known in the literature under different interchangeable names: “shifting assumptions” or“incidence assump-tions,”or“sources and uses side effects”.
3 2.5% of formal workers’salaries go to the NHIF as their premium contributions to the national health insurance scheme (NHIS)
Acknowledgements
The study acknowledges financial support provided by: UNDP/World Bank/ WHO Special Programme for Research and Training in Tropical diseases, the European Commission grant to the SHIELD project (Sixth Framework Programme; Specific Targeted Research Project no: 32289), IDRC (Grant number 103457), the African Doctoral Dissertation Research Fellowship (ADDRF) programme through the African Population and Health Research Centre (APHRC) in partnership with the International Development Research Centre (IDRC) and Ford Foundation, and the University of Cape Town International students’scholarship programme. We would like to thank the anonymous reviewers and John Ataguba for their valuable comments. Author details
1Navrongo Health Research Centre, Ghana Health Service, P. O. Box 114,
Navrongo, Ghana.2Research and Development Division, Ghana Health Service, Accra, Ghana.3Health Economics Unit, Department of Public Health
and Family Medicine, Faculty of Health Sciences, University of Cape Town, South Africa.
Authors’contributions
JA designed the study, performed the analysis and drafted the report; JG participated in the revision of the manuscript and DM supported the design and analysis of the study and undertook a critical review of the manuscript. All authors read and approved the final manuscript.
Competing interests
The authors declare that they have no competing interests. Received: 8 February 2011 Accepted: 27 June 2011 Published: 27 June 2011
References
1. McIntyre D:Learning from experience: health care financing in low- and middle-income countries.Global Forum for Health Research: Geneva; 2007. 2. Yates R:Universal health care and the removal of user fees.The Lancet
2009,373(9680):2078-2081.
3. Xu K, Evans D, Kawabata K, Zeramdini R, Klavus J, Murray C:Household catastrophic health expenditure: A multicountry analysis.Lancet2003, 362(362):111-117.
4. Garshong B, Ansah E, Dakpallah G, Huijts I, Adjei S:A study on factors affecting the implementation of the exemption policy in Ghana.Bulletin of Health Information2002,1(2&3):22-31.
5. Gilson L, McIntyre D:Removing user fees for primary care in Africa: the need for careful action.British Medical Journal2005,331:762-765. 6. World Health Organization:Sustainable health financing, universal
coverage and social health insurance: World Health Assembly resolution WHA58.33.World Health Organization: Geneva; 2005.
7. Wagstaff A, van Doorslaer E:Equity in the finance and delivery of health care: Some international comparisons.Journal of Health Economics1992, 11:361-387.
8. O’Donnell O, van Doorslaer E, Rannan-Eliya R, Somanathan A, Adhikari S: Who pays for health care in Asia.Journal of Health Economics2008, 27:460-475.
9. Cissé B, Luchinia S, Moatti JP:Progressivity and horizontal equity in health care finance and delivery: What about Africa?Health Policy2007, 80(1):51-68.
10. Ataguba J, McIntyre D:Financing and Benefit Incidence in the South African Health sytem: preliminary results.Working Paper 09-1Health Economics Unit, University of Cape Town: Cape Town; 2009.
11. Filmer D, Pritchett L:Estimating Wealth Effect Without Expenditure Data or Tears: An Application to Educational Enrollments in States of India. Demography2001,38:115-132.
12. World Bank:World Development Indicators2005 [http://data.worldbank.org/ data-catalog/world-development-indicators], [cited 2006 31 August 2006]. 13. Younger S:Estimating Tax Incidence in Ghana Using Household Data.In
Economic Reform and the Poor in Africa.Edited by: DE Sahn. Oxford University Press: New York; 1996:.
14. Martinez-Vazquez J:The impact of fiscal policy on the poor: Fiscal Incidence Analysis2004 [http://www.fiscalreform.net/library/pdfs/martinez_2001.pdf], [cited 2009 29th May 2009].
15. Borghi J, Ataguba J, Mtei G, Akazili J, Meheus F, Rehnberg C, McIntyre D: Methodological challenges in evaluating health care financing equity in data-poor contexts: Lessons from Ghana, South Africa and Tanzania.In Innovations in health system finance in developing and transitional economics: Advances in health economics and health services research.Edited by: D Chernichovsky and K Hanson. Bingley, UK; 2009:133-156.
16. Ranson MK:Reduction of catastrophic health care expenditures by a community-based health insurance scheme in Gujarat, India: current experiences and challenges.Bulletin of the World Health Organization2002, 80(8):613-621.
17. Sauerborn R, Adams A, Hien M:Household strategies to cope with the economic costs of illness.Social Science and Medicine1996,43(3):291-301. 18. Ministry of Health:Pause....Get it Right....Move on: Review of Ghana
Health Sector 2005 Programme of Work, Main Sector Review Report. Ghana Ministry of Health: Accra; 2006.
19. MOH:National Health Insurance Policy Framework for Ghana.Ghana Ministry of Health, Editor; 2004.
21. Wagstaff A, van Doorslaer E:Equity in health care finance and delivery. Handbook of Health Economics2000,1:1803-62.
22. Kakwani N:Measurement of tax progressivity: An international comparison.Economic Journal1977,87:71-80.
23. O’Donnell O, van Doorslaer E, Wagstaff A, Lindelow M:Analyzing Health Equity Using Household Survay Data. A Guide to Techniques and their Implementation.World Bank Institute2008.
24. Yu C, Whynes DK, Sach TH:Equity in health care financing: The case of Malaysia.International Journal for Equity in Health2008,7(15).
25. Limwattananon S, Tangcharoensathien V, Prakongsai P:Equity in financing healthcare: impact of universal access to healthcare in Thailand. EQUITAP Project: Working Paper #16.International Health Policy Program: Nonthaburi; 2005.
26. Wagstaff A, van Doorslaer E, van der Burg H, Calonge S, Christiansen T, Citoni G,et al:Equity in the finance of health care: some further international comparisons.Journal of Health Economics1999,18:263-290. 27. Akazili J, Ataguba J, Mtei G, Khan J, Meheus F, Rehnberg C, McIntyre D:
Health care financing incidence analysis of Africa’s health system: The experience of Ghana, South Africa and Tanzania.7th World Congress on Health Economics: 12-15 July 2009Beijing, China; 2009.
28. Witter S, Garshong B:Something old or something new? Social health insurance in Ghana.BMC International Health and Human Rights2009, 9(20).
29. McIntyre D, Gilson L, Mutyambizi V:Promoting equitable health care financing in the African context: Current challenges and future prospects.Regional Network for Equity in Health in Southern Africa (EQUINET): Harare; 2005.
doi:10.1186/1475-9276-10-26
Cite this article as:Akaziliet al.:Who pays for health care in Ghana?
International Journal for Equity in Health201110:26.
Submit your next manuscript to BioMed Central and take full advantage of:
• Convenient online submission
• Thorough peer review
• No space constraints or color figure charges
• Immediate publication on acceptance
• Inclusion in PubMed, CAS, Scopus and Google Scholar
• Research which is freely available for redistribution
Submit your manuscript at www.biomedcentral.com/submit
Akaziliet al.International Journal for Equity in Health2011,10:26 http://www.equityhealthj.com/content/10/1/26