R E S E A R C H
Open Access
Development and validation of the coronary
heart disease scale under the system of quality of
life instruments for chronic diseases QLICD-CHD:
combinations of classical test theory and
Generalizability theory
Chonghua Wan
1*†, Hezhan Li
1†, Xuejin Fan
2, Ruixue Yang
3, Jiahua Pan
4, Wenru Chen
5and Rong Zhao
6,5*Abstract
Background:Quality of life (QOL) for patients with coronary heart disease (CHD) is now concerned worldwide with the specific instruments being seldom and no one developed by the modular approach.
Objectives:This paper is aimed to develop the CHD scale of the system of Quality of Life Instruments for Chronic Diseases (QLICD-CHD) by the modular approach and validate it by both classical test theory and Generalizability Theory.
Methods:The QLICD-CHD was developed based on programmed decision procedures with multiple nominal and
focus group discussions, in-depth interview, pre-testing and quantitative statistical procedures. 146 inpatients with CHD were used to provide the data measuring QOL three times before and after treatments. The psychometric properties of the scale were evaluated with respect to validity, reliability and responsiveness employing correlation analysis, factor analyses, multi-trait scaling analysis, t-tests and also G studies and D studies of Genralizability Theory analysis.
Results:Multi-trait scaling analysis, correlation and factor analyses confirmed good construct validity and criterion-related validity when using SF-36 as a criterion. The internal consistencyαand test-retest reliability coefficients (Pearson r and Intra-class correlations ICC) for the overall instrument and all domains were higher than 0.70 and 0.80 respectively; The overall and all domains except for social domain had statistically significant changes after treatments with moderate effect size SRM (standardized response mea) ranging from 0.32 to 0.67. G-coefficients and index of dependability (Фcoefficients) confirmed the reliability of the scale further with more exact variance components.
Conclusions:The QLICD-CHD has good validity, reliability, and moderate responsiveness and some highlights, and can be used as the quality of life instrument for patients with CHD. However, in order to obtain better reliability, the numbers of items for social domain should be increased or the items’quality, not quantity, should be improved.
Keywords:Quality of life, Standardized response mean, Psychometric properties, Intra-class correlations, Multi-trait scaling analysis, Generalizability theory
* Correspondence:[email protected];[email protected] †Equal contributors
1School of Humanities and Management, Guangdong Medical College,
Dongguan 523808, China
6School of Medicine, Xi’An Jiaotong University, Xi’An 710049, China
Full list of author information is available at the end of the article
Background
Coronary heart disease (CHD) is worldwide the leading cause for morbidity and mortality in adults [1,2]. In Germany, prevalence rates of CHD in the general popu-lation are 6.5% (women) to 9.1% (men) [3]. In the United States, CHD is the number 1 cause of death among American men and women, causes 1 of every 5 deaths, and accounted for an estimated $177 billion in direct and indirect costs in 2010 [4]. On the data from Na-tional Health and Nutrition Examination Survey 2005 to 2008, an estimated 16300 000 American adults have CHD, with the CHD prevalence for the total, men and women which larger than 20 years old being 7.0%, 8.3% and 6.1%, respectively in the United States [5]. In China, CHD is the second leading cause of cardiovascular death, accounted for 22% of cardiovascular deaths in urban areas and 13% in rural areas [6]. The age-adjusted CHD mortality among the population aged >35 years in 2004 is 128.0 per 100 000 per year for urban men, 97.8 for urban women and 79.7 for rural men, 57.3 for rural women, using the new world standard population [6]. An epidemiological study showed that there were about 1,300,000 new cases of CHD diagnosed in China each year [7], and the incidence of CHD is steadily increasing in China [8]. It was estimated that three-fourths of global deaths and 82% of the total disability adjusted life years lost due to CHD occurred in middle-income countries [9].
There has been a rapid and significant growth in the measurement of quality of life as an indicator of health outcome in patients with CHD, considering that it has long disease duration and much symptoms and therapy side effects. According to WHO (World Health Organiza-tion), Quality of Life (QOL) is defined as individual’s per-ceptions of their position in life in the context of the culture and value systems in which they live and in rela-tion to their goals, expectarela-tions, standards and concerns. It includes aspects of health such as physical functioning, social and role functioning, mental health, and general health perceptions that people experience directly. There-fore, QOL is an increasingly important outcome in the study of diseases, and a suitable endpoint in cardiac popu-lations, also in terms of long-term prognosis. In the clin-ical course of CHD, there are many aspects where patients’ quality of life may be affected which include symptoms of angina and heart failure, limited exercise capacity of the aforementioned symptoms, the physical debility caused, and psychological stress associated with the chronic stress. Many studies have demonstrated that assessing changes in QOL could be a useful complement to clinical management of CHD by assisting in monitoring disease severity and progression [10-12]. Although generic instruments such as the SF-36 and Euroqol EQ-5D were widely used for evaluating QOL of CHD, they do not
capture symptoms and side effects specific to CHD [13]. Thus, some disease-specific QOL instruments [13-20] for CHD have been developed including Seattle Angina Ques-tionnaire (SAQ) [14], Quality of Life after Myocardial In-farction (QLMI) [15], the MacNew Heart Disease Quality of Life instrument [16], Minnesota Living with Heart Fail-ure questionnaire (MLHF) [17], Angina Pectoris Quality of Life Questionnaire(APQLQ) [18], the Myocardial In-farction Dimensional Assessment Scale(MIDAS) [19], the Cardiovascular Limitations and Symptoms Profile (CLASP) [20], etc. However, these instruments are appropriate for either angina pectoris or myocardial infarction, and were not developed by the popular modular approach-a gen-eral/core module plus specific modules. The modular ap-proach has the advantages of being developed fast and easily, and the resulting scale has well-characterized struc-ture, in which the general module is used to capture the psychometric properties shared by a group of relevant dis-eases, while the disease-specific module is used to characterize the distinctive disease features [21-23]. More-over, they are lacking Chinese cultural backgrounds to some extent considering their original use in English-spoken patients. For example, Taoism and traditional medicine focus on good temper and high spirit. Good ap-petite and sleep are highly regarded in daily life with food culture being very important. This kind of culture depend-ence does not reflect in most QOL instruments in other languages.
In respond to this need, we have developed a system of Quality of Life Instruments for Chronic Diseases (QLICD, V1.0) by combining a general QOL module and disease-specific modules under the guides of clas-sical test theory (CTT) and Generalizability Theory (GT), Item Response Theory (IRT) [23,24]. The general module, called QLICD-GM, can be used with all types of chronic disease patients, while the specific module ad-dresses the lack of specificity in the general module by capturing the unique aspects of QOL pertaining to the specific disease [23,24]. For example, the Hypertension instrument QLICD-HY is constructed by combining QLICD-GM with the specific module for Hypertension [24]. Similarly, the coronary heart disease instrument (QLICD-CHD) is constructed by combining QLICD-GM with the specific module for this disease. In this paper, we describe the developmental process and study the validation of this QLICD-CHD.
Methods
Establishment of the general module (QLICD-GM)
select items [23,24]. The item selection was based not only on qualitative analysis such as nominal group, focus group discussions and in-depth interview, but also on four quantitative statistical procedures—variation pro-cedure, correlation propro-cedure, factor analysis procedure and cluster analysis procedure. The entire process of de-veloping the QLICD-GM has been described in detail elsewhere [23], but the main steps were summarized as a schematic diagram below:
Item pool (73 items)
↓focus and nominal group discussions Screened refining Items (46 items)
↓importance test (86 cases interview), analysis, focus group discussions
Primary scale (V0.0, 38 items)
↓pre-test (201 cases), analysis, focus group discussions
Final scale (V1.0, 3 domains, 10 facets, 30 items)
↓620 patients
Evaluation (validity, reliability, responsiveness)
The final QLICD-GM included 30 items (selected from a 73-item pool) which be classified into 3 domains and 10 facets with physical domain having 8 items (coded PH1-PH8), psychological domain 11 items (coded PS1-PS11) and social domain 8 items (coded SO1-SO8) (see Table 1 for details). This scale was shown to have good validity, reliability, and better responsive-ness compared with the SF-36 based on the data from 620 inpatients of seven chronic diseases: hypertension, coronary heart disease, chronic gastritis, peptic ulcer, COPD, chronic obstructive lung disease, and chronic pulmonary heart disease [23].
Establishment of the specific module
After development of the QLICD-GM, twenty-five items that reflect symptoms, side effects and special mental health of CHD were selected to form the item pool of the specific module. A developmental process similar to the one described above for the general module was used to obtain the final module, which consists of 16 items, coded CHD1-CHD16, classified into 3 facets (see Table 1 in detail). Specifically, the symptom (SYM) facet includes six items of ‘Did you feel short of breath?’ (CHD1),‘Did you have pain in left shoulder and arm?’ (CHD2), ‘Did you have pain in Upper abdomen?’ (CHD3),‘Was it last for a long time when your chest pain/discomfort occurs?’ (CHD4),‘How often has your chest pain/discomfort occur?’ (CHD5), ‘How seriously was it when your chest pain/discomfort occurs?’(CHD6). The facet of effect of medicine (EFM) includes one item of
‘Can your chest pain been relieved by rest or taking nitro-glycerin under the tongue?’(CHD7). The facet of effect on
mental health and daily life (EML) includes nine items of
‘How often have you been worried about chest pain?’ (CHD8),‘Were you able to control or adjust your negative emotion?’ (CHD9), ‘Did you feel trouble about taking medicine for disease?’ (CHD10), ‘Did you feel trouble about your weight?’(CHD11),‘Were you able to adapt to life style change such as low-salt diet and quit smoking?’ (CHD12), ‘Did your disease make you lack of safety?’ (CHD13),‘Have you been bothered by sexual problem caused by disease?’(CHD14),‘How much have the activity limitation cause by your disease affected your life and work?’(CHD15),‘If you had to spend the rest of life with the symptoms and treatments the way it is right now, can you accept that optimistically?’(CHD16).
Validation of the QLICD-CHD
Data collection and scoring
The formal CHD (the general module QLICD-GM plus the specific module) described above was used for patients with CHD in a field survey in order to study its psychometric properties (validity, reliability and re-sponsiveness). The study population was limited to CHD inpatients who were able to read and understand the questionnaires at any stages and treatments. The partici-pating investigators (doctors and medical post-graduate students) explained the trial and the scale to the patients and obtained informed consent from those who agreed to participate in the study. Each patient (n = 146) was asked to answer the questionnaires at the time of admis-sion to the hospital by themselves. A random sub-sample consisting of 50 patients also participated in a second assessment the following day after hospitalization so that the test-retest reliability can be calculated. All patients available at the third scheduled assessment time-point (111 cases) completed the measures at dis-charge (after approximately 1 week of treatment) to evaluate responsiveness of the questionnaire. Answers were checked immediately each time by the investigators in order to ensure its integrality. If missing values were found, the questionnaire would be returned to the pa-tients to fill in the missing item.
The Chinese version of SF-36 [26], which have eight domains: Physical Function (PF), Role-Physical (RP), Bodily Pain (BP), General Health (GH),Vitality (VT), So-cial Function (SF), Role-Emotional (RE) and Mental-Health (MH), was also used to provide data for assessing the criterion-related validity of the QLICD-CHD, and also convergent and discriminant validity.
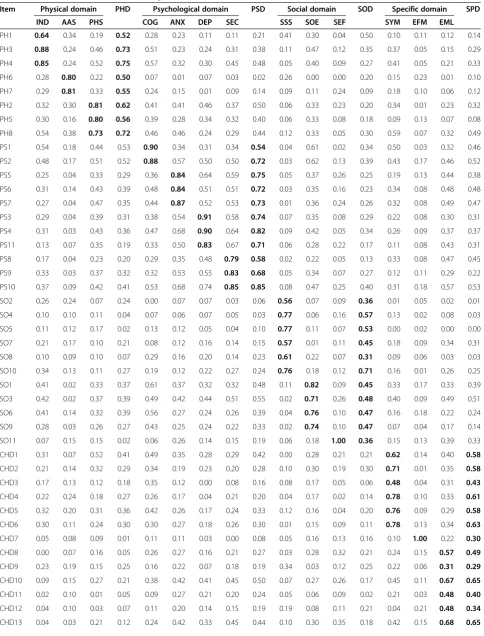
Table 1 Correlation coefficients r among items and domains/facets of QLICD-CHD (n = 146)
Item Physical domain PHD Psychological domain PSD Social domain SOD Specific domain SPD
IND AAS PHS COG ANX DEP SEC SSS SOE SEF SYM EFM EML
PH1 0.64 0.34 0.19 0.52 0.28 0.23 0.11 0.11 0.21 0.41 0.30 0.04 0.50 0.10 0.11 0.12 0.14
PH3 0.88 0.24 0.46 0.73 0.51 0.23 0.24 0.31 0.38 0.11 0.47 0.12 0.35 0.37 0.05 0.15 0.29
PH4 0.85 0.24 0.52 0.75 0.57 0.32 0.30 0.45 0.48 0.05 0.40 0.09 0.27 0.41 0.05 0.21 0.33
PH6 0.28 0.80 0.22 0.50 0.07 0.01 0.07 0.03 0.02 0.26 0.00 0.00 0.20 0.15 0.23 0.01 0.10
PH7 0.29 0.81 0.33 0.55 0.24 0.15 0.01 0.09 0.14 0.09 0.11 0.24 0.09 0.18 0.10 0.06 0.12
PH2 0.32 0.30 0.81 0.62 0.41 0.41 0.46 0.37 0.50 0.06 0.33 0.23 0.20 0.34 0.01 0.23 0.32
PH5 0.30 0.16 0.80 0.56 0.39 0.28 0.34 0.32 0.40 0.06 0.33 0.08 0.18 0.09 0.13 0.07 0.08
PH8 0.54 0.38 0.73 0.72 0.46 0.46 0.24 0.29 0.44 0.12 0.33 0.05 0.30 0.59 0.07 0.32 0.49
PS1 0.54 0.18 0.44 0.53 0.90 0.34 0.31 0.34 0.54 0.04 0.61 0.02 0.34 0.50 0.03 0.32 0.46
PS2 0.48 0.17 0.51 0.52 0.88 0.57 0.50 0.50 0.72 0.03 0.62 0.13 0.39 0.43 0.17 0.46 0.52
PS5 0.25 0.04 0.33 0.29 0.36 0.84 0.64 0.59 0.75 0.05 0.37 0.26 0.25 0.19 0.13 0.44 0.38
PS6 0.31 0.14 0.43 0.39 0.48 0.84 0.51 0.51 0.72 0.03 0.35 0.16 0.23 0.34 0.08 0.48 0.48
PS7 0.27 0.04 0.47 0.35 0.44 0.87 0.52 0.53 0.73 0.01 0.36 0.24 0.26 0.32 0.08 0.49 0.47
PS3 0.29 0.04 0.39 0.31 0.38 0.54 0.91 0.58 0.74 0.07 0.35 0.08 0.29 0.22 0.08 0.30 0.31
PS4 0.31 0.03 0.43 0.36 0.47 0.68 0.90 0.64 0.82 0.09 0.42 0.05 0.34 0.26 0.09 0.37 0.37
PS11 0.13 0.07 0.35 0.19 0.33 0.50 0.83 0.67 0.71 0.06 0.28 0.22 0.17 0.11 0.08 0.43 0.31
PS8 0.17 0.04 0.23 0.20 0.29 0.35 0.48 0.79 0.58 0.02 0.22 0.05 0.13 0.33 0.08 0.47 0.45
PS9 0.33 0.03 0.37 0.32 0.32 0.53 0.55 0.83 0.68 0.05 0.34 0.07 0.27 0.12 0.11 0.29 0.22
PS10 0.37 0.09 0.42 0.41 0.53 0.68 0.74 0.85 0.85 0.08 0.47 0.25 0.40 0.31 0.18 0.57 0.53
SO2 0.26 0.24 0.07 0.24 0.00 0.07 0.07 0.03 0.06 0.56 0.07 0.09 0.36 0.01 0.05 0.02 0.01
SO4 0.10 0.10 0.11 0.04 0.07 0.06 0.07 0.05 0.03 0.77 0.06 0.16 0.57 0.13 0.02 0.08 0.03
SO5 0.11 0.12 0.17 0.02 0.13 0.12 0.05 0.04 0.10 0.77 0.11 0.07 0.53 0.00 0.02 0.00 0.00
SO7 0.21 0.17 0.10 0.21 0.08 0.12 0.16 0.14 0.15 0.57 0.01 0.11 0.45 0.18 0.09 0.34 0.31
SO8 0.10 0.09 0.10 0.07 0.29 0.16 0.20 0.14 0.23 0.61 0.22 0.07 0.31 0.09 0.06 0.03 0.03
SO10 0.34 0.13 0.11 0.27 0.19 0.12 0.22 0.27 0.24 0.76 0.18 0.12 0.71 0.16 0.01 0.26 0.25
SO1 0.41 0.02 0.33 0.37 0.61 0.37 0.32 0.32 0.48 0.11 0.82 0.09 0.45 0.33 0.17 0.33 0.39
SO3 0.42 0.02 0.37 0.39 0.49 0.42 0.44 0.51 0.55 0.02 0.71 0.26 0.48 0.40 0.09 0.49 0.51
SO6 0.41 0.14 0.32 0.39 0.56 0.27 0.24 0.26 0.39 0.04 0.76 0.10 0.47 0.16 0.18 0.22 0.24
SO9 0.28 0.03 0.26 0.27 0.43 0.25 0.24 0.22 0.33 0.02 0.74 0.10 0.47 0.07 0.04 0.17 0.14
SO11 0.07 0.15 0.15 0.02 0.06 0.26 0.14 0.15 0.19 0.06 0.18 1.00 0.36 0.15 0.13 0.39 0.33
CHD1 0.31 0.07 0.52 0.41 0.49 0.35 0.28 0.29 0.42 0.00 0.28 0.21 0.21 0.62 0.14 0.40 0.58
CHD2 0.21 0.14 0.32 0.29 0.34 0.19 0.23 0.20 0.28 0.10 0.30 0.19 0.30 0.71 0.01 0.35 0.58
CHD3 0.17 0.13 0.12 0.18 0.35 0.12 0.00 0.08 0.16 0.08 0.17 0.05 0.06 0.48 0.04 0.31 0.43
CHD4 0.22 0.24 0.18 0.27 0.26 0.17 0.04 0.21 0.20 0.04 0.17 0.02 0.14 0.78 0.10 0.33 0.61
CHD5 0.32 0.20 0.31 0.36 0.42 0.26 0.17 0.24 0.33 0.12 0.16 0.04 0.20 0.76 0.09 0.29 0.58
CHD6 0.30 0.11 0.24 0.30 0.30 0.27 0.18 0.26 0.30 0.01 0.15 0.09 0.11 0.78 0.13 0.34 0.63
CHD7 0.05 0.08 0.09 0.01 0.11 0.11 0.03 0.00 0.08 0.05 0.16 0.13 0.16 0.10 1.00 0.22 0.30
CHD8 0.00 0.07 0.16 0.05 0.26 0.27 0.16 0.21 0.27 0.03 0.28 0.32 0.21 0.24 0.15 0.57 0.49
CHD9 0.23 0.19 0.15 0.25 0.16 0.22 0.07 0.18 0.19 0.34 0.03 0.12 0.25 0.22 0.06 0.31 0.29
CHD10 0.09 0.15 0.27 0.21 0.38 0.42 0.41 0.45 0.50 0.07 0.27 0.26 0.17 0.45 0.11 0.67 0.65
CHD11 0.02 0.10 0.01 0.05 0.09 0.27 0.21 0.20 0.24 0.05 0.06 0.09 0.02 0.21 0.03 0.48 0.40
CHD12 0.04 0.10 0.03 0.07 0.11 0.20 0.14 0.15 0.19 0.19 0.08 0.11 0.21 0.04 0.21 0.48 0.34
reversely scored. Each domain score is obtained by add-ing together the within-domain item scores. The overall scale score is the sum of the four domain scores.
For comparison purposes, all domain scores were linearly converted to a 0–100 scale using the formula: SS = (RS-Min) × 100/R, where SS, RS, Min and R repre-sent the standardized score, raw score, minimum score, and range of scores, respectively.
Statistical analysis for psychometrics
The validity, reliability, and responsiveness of the QLICD-CHD were analyzed. Validity is the degree to which the in-strument measures what it is supposed to measure, with several types of validity being distinguished [27,28]. Con-struct validity was evaluated by Pearson’s correlation coef-ficient r (item-domains/facets correlations) as well as by factor analysis with Varimax Rotation. Multi-trait scaling analysis [29] was employed to test item convergent and disciminant validity, with the two criteria: (1) convergent validity is supported when an item-domain correlation is 0.40 or greater; (2) disciminant validity is revealed when item-domain correlation is higher than that with other domains. Criterion-related validity was evaluated by correlating corresponding domains of the QLICD-CHD and SF-36 because of the lack of an agreed-upon gold standard. Relatively high correlations among conceptually related domains and relatively low correlation among conceptually distinct domains would suggest high criterion-related validity. And this can also demonstrate convergent and discriminant validity because they in-volve comparing logically related measures to see if they are correlated more strongly (convergent) or more weakly (discriminant).
Reliability is the degree to which an instrument is free from random error, with being evaluated by measuring internal consistency reliability and reproducibility fre-quently. The internal consistency, which refers to the homogeneity of the items of the scale, was assessed by Cronbach’s alpha coefficient for each domain/facet. A high internal consistency suggests that the scale is meas-uring a single construct. Reproducibility (the test-retest reliability) establishes the stability of an instrument over time in a stable population [28]. It was evaluated by the Pearson’s correlation coefficients between the first and second assessments, and intra-class correlation (ICC)
with definition of absolute for single measure under the two-way mixed model [30,31]. Patients were considered stable if they did not experience treatments the following day to hospital.
Responsiveness is the instrument’s ability to detect clinically important change over time. It was measured by comparing the mean score change between the two assessments before and after treatments using paired t -tests as well as the effect size, SRM (standardized re-sponse mean) [32,33].
Generalizability theory analysis
Besides classical test theory analysis above, we also ap-plied Generalizability Theory (G theory) to investigate the score dependability of the QLICD-CHD. G theory has been presented as a way to refine the designs of measurement procedures in an attempt to yield reliable data [34-37]. Serving as an alternative to the more famil-iar classical measurement theory, which yields the less useful intra-class correlation coefficients, G theory ad-dresses the dependability of measurements and allows for the simultaneous estimation of multiple sources of variance, including interactions. Thus, a distinction is made between 2 types of studies: G studies and D stud-ies. A G study quantifies the amount of variance associ-ated with the different facets (factors) that are being examined. A D study provides information about which protocols are optimal for a particular measurement situ-ation by generating Generalizability (G) coefficients that can be interpreted as reliability coefficients across vari-ous facets of the study.
In our research, G-Studies and D-Studies were per-formed to estimate the variance components and de-pendability coefficients in one facet person-by-item design (p × i design). We defined the quality of life of pa-tients as the target of measurement and items as one facet of measurement error. Given every person is asked to reply to all items, the design is One-facet Crossed De-sign [34-37]. For the G-Study, a universe of admissible observations, which consists of the object of measure-ment and the measuremeasure-ment error facets, is defined and the variance components are estimated. For the D-Study, a universe of admissible generalizations, which represents the measurement conditions based on the ob-ject of measurement and the measurement facets a
Table 1 Correlation coefficients r among items and domains/facets of QLICD-CHD (n = 146)(Continued)
CHD14 0.00 0.04 0.13 0.04 0.13 0.25 0.20 0.32 0.28 0.04 0.10 0.52 0.20 0.34 0.10 0.51 0.49
CHD15 0.31 0.00 0.25 0.27 0.57 0.42 0.33 0.39 0.50 0.12 0.55 0.31 0.32 0.34 0.15 0.56 0.53
CHD16 0.22 0.07 0.00 0.10 0.03 0.08 0.12 0.16 0.12 0.55 0.20 0.02 0.54 0.06 0.13 0.37 0.27
researcher is willing to generalize over, is defined and the variance components associated with the universe of admissible generalizations are estimated.
Results
Socio-demographic and clinical characteristics of the sample
The 146 patients with CHD varied in age from 19 to 80, with median age of 64.0 and mean age 62.1 ± 11.3. Among the study patients, 132 (90.4%) were of Han eth-nicity and others were of minority including Yi, Bai, Hui, etc., the majority were married (128 cases, 87.7%) while 18 (12.3%) were single and others. On gender and edu-cation level, 105 cases (71.9%) were male while 41 (28.1%) were female, 37 (25.3%) finished primary school, while 75 (52.4%) completed high school, and 32 (22.0%) had a college or post-graduate degree. Distribution of occupations was as follow: workers 20.5% (30 cases), farmer 9.6% (14), teacher 7.5% (11), cadre 19.9% (29), and others 42.5% (62). With regard to perceived income, 20 (13.7%) were in poor, 93 (63.7%) in fair, and 33 (22.6%) in high. Regarding medical insurance, self-paid accounted in 16 cases (11.0%) and partly public insurance/ public insurance accounted in 130 cases (89.0%). In terms of clinical types, angina pectoris were 97 cases (67.4%) while myocardial infarctions were 49 cases (32.6%).
Construct validity
Correlation analyses showed that there were strong asso-ciations between items and their own domains/facets (most correlation coefficients are higher than 0.5), but weak relationship between items and other domains/ facets (see Table 1). For example, correlation coefficients between PHD and items of PH1-PH8 (in bold) are higher than those between PHD and other items. Espe-cially, the correlation coefficients between items and their own facets were much larger than that between items and other facets.
There were 8 principal components (initial eigenvalues >1) abstracted from 30 items of the general module (QLICD-GM) by factor analysis, accounting for 68.1% of the cumulative variance. By using the Varimax rotation method, it can be seen that the 8 principal components reflected different facets under three domains of the general module. Specifically, the fourth and fifth princi-pal components mainly represented the physical domain with higher loadings on PH5(0.69), PH7(0.64) and PH8 (0.72); The second and third principal components largely reflected the social domain with higher loadings on SO1(0.76), SO4(0.78), SO5(0.83), SO6(0.76), SO8(0.62) and SO10(0.83); The other principal components gener-ally depicted the psychological domain with higher load-ings on PS3(0.77), PS4(0.81), PS5(0.71), PS8(0.65), PS9 (0.69), PS10(0.80) and PS11(0.79).
Similarly, the principal component factor analysis ex-tracted 4 principal components from the 16 items of the specific module with the cumulative variance of 60.6%, reflecting 3 facets of this module. And here the first principal component represented the facet of treatment side-effects with higher factor loadings on CHD2(0.60), CHD3(0.64), CHD4(0.83), CHD5(0.83) and CHD6(0.82), the second and the fourth principal components cap-tured the facet of mental and physical health with higher factor loadings on CHD8(0.68), CHD9(0.65), CHD12(0.72), CHD13(0.66), CHD15(0.70) and CHD16(0.66).
From results above, theoretical construct was confirmed generally by data analysis, showing good construct validity.
Criterion-related validity
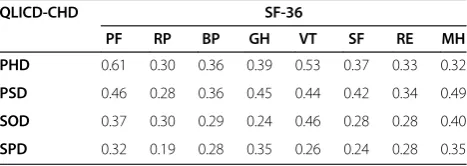
Correlation coefficients among the domain scores of the QLICD-CHD and SF-36 were presented in Table 2, showing that the correlations between the same and similar domains are generally higher than those between different and non-similar domains. For example, the co-efficient between the physical domain of QLICD-CHD and physical function of SF-36 was 0.61, higher than any other coefficients in this row. Similarly, the coefficient between the psychological domain of QLICD-CHD and mental health of SF-36 was 0.49, higher than any other coefficients in this row (PCS and MCS are not mutually exclusive domain of SF-36).
These confirmed the criterion-related validity to a rea-sonable degree and also demonstrated the convergent and divergent validity to some extent.
Reliability
The reliability of the scale was evaluated by three proce-dures: internal consistency, test-retest and ICC (see Table 3 for details). The Cronbach's α for all domains and facets were computed using the measurements data at admission because of larger sample size. As can be seen in Table 3, the Cronbach'sαfor these four domains were higher than 0.70, and most of them were higher than 0.70 at the facet levels.
Table 2 Correlation coefficients among domains scores of QLICD-CHD and SF-36 (n = 146)
QLICD-CHD SF-36
PF RP BP GH VT SF RE MH
PHD 0.61 0.30 0.36 0.39 0.53 0.37 0.33 0.32
PSD 0.46 0.28 0.36 0.45 0.44 0.42 0.34 0.49
SOD 0.37 0.30 0.29 0.24 0.46 0.28 0.28 0.40
SPD 0.32 0.19 0.28 0.35 0.26 0.24 0.28 0.35
PHD: physical domain, PSD: psychological domain, SOD: social domain, SPD: specific domain.
The test-retest correlation coefficients (r) for the 4 do-mains and 13 facets of QLICD-CHD ranged between 0.61-0.98, with r = 0.90 for the overall scale and the minimum r = 0.80 for SPD among the four exclusive do-mains. The differences in domain and facet scores be-tween the first and the second assessments were not statistically significant for all domains and most facets except for Independence and symptom by paired t tests (P> 0.05). The results from ICC were very similar to Pearson’s correlation coefficients (r).
Reliability from generalizability theory
The estimated G-study results were provided in Table 4 based on the current design, in which 146 patients filled out the quality of life instrument QLICD-CHD with 46 items. For physical domain, the variances accounted for 67.22% by person-by-item interactions and 28.30% by person, only a small source of variation (4.48%) was due to item. Given the largest source of variation in this do-main score is by the person-by-item interaction, it means that different people might understand and react to the same item in different ways despite having the same total score on the scale. Similarly, the largest source of variation was due to person-by-item interac-tions in other domains, while the variances by person were in the second place (except for social domain by item).
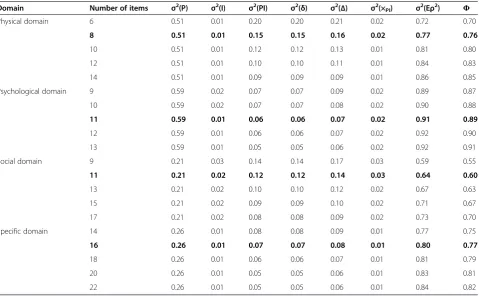
The D-Studies were performed to estimate G-coefficients and Фcoefficients for the current design and alternative designs with varied numbers of items for four domains of QLICP-CHD, with results presenting in Table 5. It showed acceptable reliability coefficients (G and Ф coefficients >0.70) for three of four domains except for social domain for the current design. In addition, Table 5 showed the ef-fects of the various levels of items (from 6 to 22) on reli-ability with G ranging from 0.59 to 0.92, and Фranging from 0.55 to 0.91.
Responsiveness
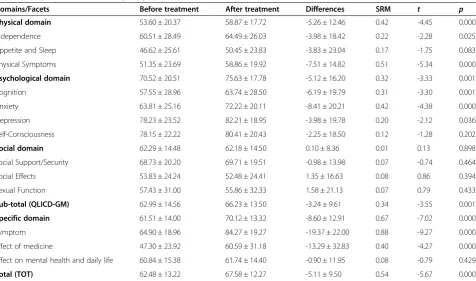
It can be seen in Table 6 that significant changes oc-curred for domains of physical, psychological and the specific, and also the sub-total (QLICD-GM) and overall scale (P < 0.01) with effect size SRM ranging from 0.32 to 0.67. At the facets level, five of thirteen facets were of statistical significance with effect size SRM ranging from 0.20 to 0.88.
Discussions
On development approach and advantages
Since same-class diseases such as cancers share many things in common, an approach widely adopted in recent years to develop QOL instruments for diseases within a
Table 3 Reliability of the quality of life instrument QLICD-CHD (n = 146 forα, n = 50 forrand ICC)
Domains/Facets Internal consistency coefficientα
Test-retest reliability correlation coefficientr
Test-retest reliability ICC (95% CI )
Physical domain (PHD) 0.76 0.95 0.95 (0.91-0.97)
Independence 0.70 0.98 0.98 (0.97-0.99)
Appetite and sleep 0.46 0.77 0.77 (0.62-0.86)
Physical Symptoms 0.67 0.97 0.98 (0.96-0.99)
Psychological domain (PSD)
0.90 0.92 0.92 (0.86-0.95)
Cognition 0.73 0.92 0.92 (0.87-0.96)
Anxiety 0.81 0.85 0.84 (0.74-0.91)
Depression 0.84 0.93 0.93 (0.88-0.96)
Self-consciousness 0.76 0.91 0.91 (0.84-0.95)
Social domain (SOD) 0.63 0.86 0.85 (0.75-0.91)
Social Support/Security 0.74 0.84 0.83 (0.71-0.90)
Social Effects 0.75 0.92 0.91 (0.85-0.95)
Sexual function - 0.94 0.96 (0.94-0.98)
Sub-total (QLICD-GM) - 0.92 0.92 (0.86-0.95)
Specific domain (SPD) 0.79 0.80 0.80 (0.68-0.88)
Symptom 0.78 0.70 0.72 (0.54-0.73)
Effect of medicine - 0.61 0.61 (0.40-0.76)
Effect on mental health and daily life
0.65 0.89 0.92 (0.86-0.95)
Total (TOT) - 0.90 0.91 (0.84-0.95)
- not acceptable/suitable, ICC: intra-class correlation, CI: confidence interval.
Table 4 The estimated variance components and percentage of variance for p × i design in G-study for four domains of quality of life instrument QLICP-CHD
p(person) i(item) p * i(person*item)
Domain Variance component Percent (%) Variance component Percent (%) Variance component Percent (%)
PHD 0.50 28.30 0.08 4.48 1.20 67.22
PSD 0.59 42.20 0.15 10.87 0.65 46.93
SOD 0.21 11.76 0.25 14.33 1.30 73.91
SPD 0.26 17.45 0.16 10.74 1.07 71.81
common class is to combine a general module for the en-tire class of disease with specific modules for individual diseases to capture both common features within the dis-ease class and disparities among different disdis-ease mem-bers. This approach can substantially reduce the amount of time and effort in developing new instruments. Both the QLQs from EORTC and the FACTs from CORE for QOL assessments of cancer patients have been developed based on this modular principle [21,38]. Unlike these two QOL instruments systems, we employed this modular approach to systematically and more efficiently develop a system of new instruments for chronic diseases dir-ectly, with QLICD-GM forming the general module and QLCID-CHD being a specific scale for coronary heart dis-ease. This modular approach unifies all disease-specific in-struments of QLICDs using the same general module with similar constructs. To our knowledge, although a number of instruments have been widely used for studying CHD impacts on patients’QOL, no one was developed directly by the modular approach. Therefore, the QLICD-CHD has several advantages over existing instruments [23,24]. First, it can compare HRQOL across diseases by the
general module and also capture the symptoms and side effects by the specific module, demonstrating both generic and specific properties. Second, it consists of a moderate number of items with a clear hierarchical structure (items→facets→domains→overall) so that mean scores can be computed not only at the domain (four domains) and the overall levels but also at the different facet levels (13 facets) to detect changes in greater detail. Users can select either one or both levels for a study at hand. Third and perhaps more important is the strong Chinese cul-tural background underlying the QLICD-CHD. For ex-ample, the Chinese culture pays more attention to family relationship and kinship, dietary, temperament and high spirit, which are probed by the items of QLICD-CHD fo-cusing on this type of cultural heritage such as appetite, sleep, energy and family support. Specifically, items of PH6‘Have you had a good appetite?’, PH7‘Were you satis-fied with your sleep?’, PH2 ‘Have you felt fatigue easily?’, SO4‘Have you had good relations with your families?’, and SO5‘Could you acquire material and emotional help and support from your family when you need?’ etc. reflected these aspects in details.
Table 5 G-coefficients andФ-coefficients for different numbers of items for p × I design in D-study for four domains of quality of life instrument QLICP-CHD
Domain Number of items σ2(P)
σ2(I)
σ2(PI)
σ2(
δ) σ2(
Δ) σ2(×
PI) σ2(Eρ2) Φ
Physical domain 6 0.51 0.01 0.20 0.20 0.21 0.02 0.72 0.70
8 0.51 0.01 0.15 0.15 0.16 0.02 0.77 0.76
10 0.51 0.01 0.12 0.12 0.13 0.01 0.81 0.80
12 0.51 0.01 0.10 0.10 0.11 0.01 0.84 0.83
14 0.51 0.01 0.09 0.09 0.09 0.01 0.86 0.85
Psychological domain 9 0.59 0.02 0.07 0.07 0.09 0.02 0.89 0.87
10 0.59 0.02 0.07 0.07 0.08 0.02 0.90 0.88
11 0.59 0.01 0.06 0.06 0.07 0.02 0.91 0.89
12 0.59 0.01 0.06 0.06 0.07 0.02 0.92 0.90
13 0.59 0.01 0.05 0.05 0.06 0.02 0.92 0.91
Social domain 9 0.21 0.03 0.14 0.14 0.17 0.03 0.59 0.55
11 0.21 0.02 0.12 0.12 0.14 0.03 0.64 0.60
13 0.21 0.02 0.10 0.10 0.12 0.02 0.67 0.63
15 0.21 0.02 0.09 0.09 0.10 0.02 0.71 0.67
17 0.21 0.02 0.08 0.08 0.09 0.02 0.73 0.70
Specific domain 14 0.26 0.01 0.08 0.08 0.09 0.01 0.77 0.75
16 0.26 0.01 0.07 0.07 0.08 0.01 0.80 0.77
18 0.26 0.01 0.06 0.06 0.07 0.01 0.81 0.79
20 0.26 0.01 0.05 0.05 0.06 0.01 0.83 0.81
22 0.26 0.01 0.05 0.05 0.06 0.01 0.84 0.82
σ2
(δ) is the variance components of relative error. σ2(Δ) is the variance components of absolute error.
σ2
(×PI) is the variance components of error when estimating the universe score by using sample mean.
σ2 (Eρ2
On psychometrics
Generally, a practical QOL instrument must be validated with respect to at least three aspects: validity, reliability and responsiveness. Instrument validity is the extent to which an instrument can capture what it purports to measure. By following WHO’s definition of QOL and the programmed decision procedures, we developed the QLICD-CHD by using focus group discussion, in-depth interview and pre-testing to effectively reduce the num-ber of items in the final version to 30 from an initial 73 item pool for the general module, and to 16 from an ini-tial pool of 25 items for the specific module, ensuring good content validity and sound conceptual structure. Correlation analyses showed strong association between items and their own domains/facets but weak correla-tions between items and other domains/facets. Factor analysis revealed that the components extracted from the data basically coincide with the theoretical construct of the instrument. These results confirmed the good construct validity. Correlation coefficients between do-main scores of QLICD-CHD and SF-36 showed the criterion-related validity to a reasonable degree and the convergent and divergent validity to some extent.
Reliability refers to the reproducibility or consistency of item scores from one assessment to another. Test-retest reliability (r), ICC and internal consistency (Cronbach’sα) are the most frequently used indicators and were tested in the current study. It is well recognized that internal
consistency (α) should be at least 0.70 and reliability (r) should be above 0.80 in a test–retest situation [32]. Thus, our results in Table 3 showed that this instrument has good reliability for allαwere higher than 0.70 and r (ICC) greater than 0.80 at domain levels.
The assessment methods on responsiveness can be gen-erally divided into two categories: internal and external [32,33]. In this paper we focused on internal responsive-ness with the hypothesis that the sensitive instrument should detect changes when they occur after treatment. SRM is a good indicator of effect size, with values of 0.20, 0.50 and 0.80 representing small, moderate and large re-sponsiveness [32,33]. As seen from Table 6, QOL scores had significant changes after treatment for three of the four domains as well as the overall score (P < 0.05), with SRM equal to 0.52, 0.28, 0.62 and 0.56. Given that it rea-sonable to expect no statistically significant change for the social domain and some facets pertaining to stable traits post-treatment, QLICD-CHD seems to have good responsiveness.
On analysis of generalizability theory
Traditionally, the scale is assessed by classical test theory analysis, in this research Generalizability Theory was also applied both in G-study and D-study. Which coeffi-cients will be selected depending on the researchers’ in-terests? If one’s interest lies in ranking people (relative decision), then the G-coefficient informs about how
Table 6 Responsiveness of the quality of life instrument QLICD-CHD (xs) (n = 111)
Domains/Facets Before treatment After treatment Differences SRM t p
Physical domain 53.60 ± 20.37 58.87 ± 17.72 -5.26 ± 12.46 0.42 -4.45 0.000
Independence 60.51 ± 28.49 64.49 ± 26.03 -3.98 ± 18.42 0.22 -2.28 0.025
Appetite and Sleep 46.62 ± 25.61 50.45 ± 23.83 -3.83 ± 23.04 0.17 -1.75 0.083
Physical Symptoms 51.35 ± 23.69 58.86 ± 19.92 -7.51 ± 14.82 0.51 -5.34 0.000
Psychological domain 70.52 ± 20.51 75.63 ± 17.78 -5.12 ± 16.20 0.32 -3.33 0.001
Cognition 57.55 ± 28.96 63.74 ± 28.50 -6.19 ± 19.79 0.31 -3.30 0.001
Anxiety 63.81 ± 25.16 72.22 ± 20.11 -8.41 ± 20.21 0.42 -4.38 0.000
Depression 78.23 ± 23.52 82.21 ± 18.95 -3.98 ± 19.78 0.20 -2.12 0.036
Self-Consciousness 78.15 ± 22.22 80.41 ± 20.43 -2.25 ± 18.50 0.12 -1.28 0.202
Social domain 62.29 ± 14.48 62.18 ± 14.50 0.10 ± 8.36 0.01 0.13 0.898
Social Support/Security 68.73 ± 20.20 69.71 ± 19.51 -0.98 ± 13.98 0.07 -0.74 0.464
Social Effects 53.83 ± 24.24 52.48 ± 24.41 1.35 ± 16.63 0.08 0.86 0.394
Sexual Function 57.43 ± 31.00 55.86 ± 32.33 1.58 ± 21.13 0.07 0.79 0.433
Sub-total (QLICD-GM) 62.99 ± 14.56 66.23 ± 13.50 -3.24 ± 9.61 0.34 -3.55 0.001
Specific domain 61.51 ± 14.00 70.12 ± 13.32 -8.60 ± 12.91 0.67 -7.02 0.000
Symptom 64.90 ± 18.96 84.27 ± 19.27 -19.37 ± 22.00 0.88 -9.27 0.000
Effect of medicine 47.30 ± 23.92 60.59 ± 31.18 -13.29 ± 32.83 0.40 -4.27 0.000
Effect on mental health and daily life 60.84 ± 15.38 61.74 ± 14.40 -0.90 ± 11.95 0.08 -0.79 0.429
dependable a score is. If one’s interest lies in the abso-lute standings to a criterion (absoabso-lute decision), the index of dependabilityФreflects the score dependability. The index of dependability is typically lower than G-coefficients because they consider the main error effects in addition to the interaction effects that are used for G-coefficients. This research presented both G-coefficients and Ф, and also their changes when items assumed to be changed. For social domain, we estimated a G-coefficient of 0.64 and an index of dependability of 0.60 for the current design, which was a little below the ac-ceptable level of 0.70. Hence, the domain’s items need improvement. For an alternative design with 17 items, the G-coefficient estimated to be 0.74 and the index of dependability 0.70. Therefore, it will be better to increase the numbers of items of social domain from 11 to 17 in order to reach an acceptable dependability. For other do-mains, G- coefficients and index of dependability were all greater than 0.70 for the current design, and changed a little as items changing. It can be considered that current items are reasonable and acceptable for these domains.
To sum up, the analysis from Generalizability Theory confirmed the reliability of the scale further. However, the numbers of items for social domain should be in-creased in order to obtain better reliability.
Study limitations
It is worthy to note that the sample size of the study is not very large, which may also affect the findings, espe-cially those with respect to factor analysis (146 cases vs 30 variables for the general module). Although correl-ational analysis was conducted simultaneously to display the construct, which overcome it to some extent, add-itional larger studies are needed to validate it further. Moreover, the subjects in this study were selected from the inpatient population at hospitals. Additional studies are needed to assess the generalizability of the instru-ment to other settings and populations such as outpa-tients at a local clinic.
In summary, the QLICD-CHD can be used as a useful instrument in measuring and assessing quality of life for patients with coronary heart disease who speak Chinese (the largest population in the world), with good psycho-logical properties and some highlights.
Competing interests
The authors declare that they have no competing interests.
Authors’contributions
WC, HL and CW designed the study. RY, XF, RZ, JP performed the data collection and RY, RZ and CW performed data analyses, and all authors contributed to interpreting the data. WC and CW wrote the first draft, which was critically revised by all others. All authors have read and approved the final manuscript.
Authors’information
Chonghua Wan and Hezhan Li are as the first co-author with the same contributions.
Acknowledgements
In carrying out this research project, we have received substantial assistance from Prof. Fabio Efficace at Italian Group for Adult Hematologic Diseases (GIMEMA), and also staffs of the first affiliated hospital of Kunming Medical University, Shilong Boai Hospital Affiliated to Guangdong Medical College, and Shenzhen Futian District Institute for Prevention and Control of Chronic Diseases. We sincerely acknowledge all the support.
Grants
Supported by the National Natural Science Foundation of China (30860248, 71373058), Science and Technological Program for Dongguan’s Higher Education, Science and Research, and Health Care Institutions
(2011105102008), the Key Discipline and Science & Technology Innovation Fund of Guangdong Medical College (XZ1111, STIF201119).
Author details
1School of Humanities and Management, Guangdong Medical College,
Dongguan 523808, China.2Shilong Boai Hospital Affiliated to Guangdong Medical College, Dongguan 523325, China.3Guangzhou Health Education
Institute, Guangzhou 510403, China.4The First Affiliated Hospital of Kunming Medical University, Kunming 650031, China.5Shenzhen Futian District
Institute for Prevention and Control of Chronic Diseases, Shenzhen 518048, China.6School of Medicine, Xi’An Jiaotong University, Xi’An 710049, China.
Received: 18 February 2014 Accepted: 29 April 2014 Published: 4 June 2014
References
1. Lopez AD, Mathers CD, Ezzati M, Jamison DT, Murray CJ:Global and regional burden of disease and risk factors, 2001: systematic analysis of population health data.Lancet2006,67(9524):1747–1757.
2. Levi F, Lucchini F, Negri E, La Vecchia C:Trends in mortality from cardiovascular and cerebrovascular diseases in Europe and other areas of the world.Heart2002,88(2):119–124.
3. Kramer L, Hirsch O, Schlöβler K, Träger S, Baum E, Donner-Banzhoff N:
Associations between demographic, disease related, and treatment pathway related variables and health related quality of life in primary care patients with coronary heart disease.Health Qual Life Outcomes2012,
10:78.
4. Lloyd-Jones D, Adams RJ, Brown TM, Carnethon M, Dai S, De SG:Heart disease and stroke statistics—2010 update: a report from the American Heart Association.Circulation2010,121(7):e46–e215.
5. Roger VL, Go AS, Lloyd-Jones DM:Heart disease and stroke statistics–2011 update: a report from the American Heart Association.Circulation2011,
123:e18–e209.
6. Zhang XH, Lu ZL, Liu L:Coronary heart disease in China.Heart2008,
94(9):1126–1131.
7. Wu YF:The importance of epidemiological study on cardiovascular diseases.Chin J Epidemiol2003,24(7):337.
8. Wu Z, Yao C, Zhao D, Wu G, Wang W, Liu J, Zeng Z, Wu Y:Sino-MONICA project: a collaborative study on trends and determinants in cardiovascular diseases in China, part i: morbidity and mortality monitoring.Circulation2001,103:462–468.
9. Gaziano TA, Bitton A, Anand S:Growing epidemic of coronary heart disease in low- and middle-income countries.Curr Probl Cardiol2010,
35:72–115.
10. Christian AH, Cheema AF, Smith SC, Mosca L:Predictors of quality of life among women with coronary heart disease.Qual Life Res2007,
16(3):363–373.
11. Failde II, Soto MM:Changes in health related quality of life 3 months after an acute coronary syndrome.BMC Public Health2006,6:18. 12. Veenstra M, Pettersen KI, Rollag A, Stavem K:Association of changes in
13. Thompson DR, Yu CM:Quality of life in patients with coronary heart disease-I: assessment tools [Review].Health Qual Life Outcomes2003,
10(1):42.
14. Spertus JA, Winder JA, Dewhurst TA:Development and evaluation of the Seattle Angina Questionnaire: a new functional status measure for coronary artery disease.J Am Coll Cardiol1995,25:333–341. 15. Valenti L, Lim L, Heller RF, Knapp J:An improved questionnaire for
assessing quality of life after acute myocardial infarction.Qual Life Res 1996,5:151–161.
16. Dixon T, Lim LL, Oldridge NB:The MacNew heart disease health-related quality of life instrument: reference data for users.Qual Life Res2002,
11:173–183.
17. Rector TS, Kubo SH, Cohn JN:Patients' self-assessment of their congestive heart failure: content, reliability, and validity of a new measure, the Minnesota Living with Heart Failure Questionnaire.Heart Failure1987,
3:198–209.
18. Marquis P, Fayol C, Joire JE:Lepl ge A: Psychometric properties of a specific quality of life questionnaire in angina pectoris patients.Qual Life Res1995,4(6):540–546.
19. Thompson DR, Jenkinson C, Roebuck A, Lewin RJ, Boyle RM, Chandola T:
Development and validation of a short measure of health status for individuals with acute myocardial infarction:the myocardia1 infarction dimensional assessment scale(MIDAS).Qual Life Res2002,11(6):535–543. 20. Lewin RJP, Thompson DR, Martin CR, Stuckey N, Devlen J, Michaelson S,
Maguire P:Validation of the Cardiovascular Limitations and Symptoms Profile (CLASP) in chronic stable angina.J Cardiopulm Rehab2002,
22:184–191.
21. Sprangers MA, Cull A, Groenvold M, Bjordal K, Blazeby J, Aaronson NK:The European Organization for Research and Treatment of Cancer approach to developing questionnaire modules: an update and overview. EORTC Qual of Life Study Group.Qual Life Res1998,7(4):291–300.
22. Cella D, Nowinski CJ:Measuring quality of life in chronic illness: the functional assessment of chronic illness therapy measurement system.
Arch Phys Med Rehabil2002,83(12 Suppl 2):S10–S17.
23. Wan CH, Tu XM, Messing S, Li XM, Yang Z, Zhao XD, Gao L, Yang YP, Pan JH, Zhou ZF:Development and Validation of the General Module (QLICD-GM) of the System of Quality of Life Instruments for Chronic Diseases and Comparison with SF-36.J Pain Symptom Manage2011,42(1):93–104. 24. Wan CH, Jiang RS, Tu XM, Tang W, Pan JH, Yang RX, Li XM, Yang Z, Zhang
XQ:The Hypertension Scale of the System of Quality of Life Instruments for Chronic Diseases QLICD-HY: Development and Validation Study.Int J Nurs Stud2012,49(4):465–480.
25. The WHOQOL Group:The Word Health Organization Quality of Life assessment (WHOQOL): Devolvement and psychometric properties.Soc Sci Med1998,12:1569–1585.
26. Yang Z, Li W, Tu XM, Tang W, Messing S, Duan LP, Pan JH, Li XM, Wan CH:
Validation and Psychometric Properties of Chinese Version of SF-36 in Patients with Hypertension, Coronary Heart Diseases, Chronic Gastritis and Peptic Ulcer.Int J Clin Pract2012,66(10):991–998.
27. Chassany O, Sagnier P, Marquis P, Fullerton S, Aaronson N:Patient-reported outcomes: The example of health-related quality of life: a European guidance document for the improved integration of health related quality of life assessment in the drug regulatory process.Drug Inf J2002,
36:209–238.
28. Scientific Advisory Committee of the Medical Outcomes Trust:Assessing health status and quality-of-life instruments: attributes and review cri-teria.Qual Life Res2002,11:195–203.
29. Hays RD, Hayashi T:Beyond internal consistency reliability: rationale and use’s guide for multi-trait analysis program on the microcomputer.Behav Res Methods Instrum Compu1990,22:167–175.
30. McGraw KO, Wong SP:Forming Inferences About Some Intraclass Correlation Coefficients.Psychol Methods1996,1(1):30–46.
31. Schuck P:Assessing reproducibility for interval data in health-related quality of life questionnaires: which coefficient should be used?Qual Life Res2004,13:571–586.
32. Terwee CB, Dekker FW, Wiersinga WM, Prummel MF, Bossuyt PM:On assessing responsiveness of health-related quality of life instruments: guidelines for instrument evaluation.Qual Life Res2003,12(4):349–363. 33. Husted JA, Cook RJ, Farewell VT, Gladman DD:Methods for assessing
responsiveness: a critical review and recommendations.J Clin Epidemiol 2000,53(5):459–468.
34. Winterstein BP, Willse JT, Kwapil TR, Silvia PJ:Assessment of Score dependability of the Wisconsin Schizotypy scales using generalizability analysis.Psychopathol Behav Assess2010,32:575–585.
35. Stora B, Hagtvet KA, Heyerdahl S:Reliability of observers' subjective impressions of families: A generalizability theory approach.Psychother Res 2013,23(4):448–463.
36. Crits-Christoph P, Johnson J, Gallop R, Gibbons MB, Ring-Kurtz S, Hamilton JL, Tu X:A generalizability theory analysis of group process ratings in the treatment of cocaine dependence.Psychother Res2011,21(3):252–266. 37. Heitman RJ, Kovaleski JE, Pugh SF:Application of generalizability theory in
estimating the reliability of ankle-complex laxity measurement.J Athl Train2009,44(1):48–52.
38. Cella DF, Tulsky DS, Gray G, Sarafian B, Linn E, Bonomi A:The functional assessment of cancer therapy scale: Development and validation of the general measure.J Clin Oncol1993,11(3):570–579.
doi:10.1186/1477-7525-12-82
Cite this article as:Wanet al.:Development and validation of the coronary heart disease scale under the system of quality of life instruments for chronic diseases QLICD-CHD: combinations of classical test theory and Generalizability theory.Health and Quality of Life Outcomes201412:82.
Submit your next manuscript to BioMed Central and take full advantage of:
• Convenient online submission
• Thorough peer review
• No space constraints or color figure charges
• Immediate publication on acceptance
• Inclusion in PubMed, CAS, Scopus and Google Scholar
• Research which is freely available for redistribution