Available online on 15.1.2020 at http://ujpr.org
Universal Journal of Pharmaceutical Research
An International Peer Reviewed Journal
Open access to Pharmaceutical research
This is an open access article distributed under the terms of the Creative Commons Attribution-Non Commercial Share Alike 4.0 License which permits unrestricted non
commercial use, provided the original work is properly cited
Volume 4, Issue 6, 2019
RESEARCH ARTICLE
HEATING EFFECT ON PHYTOCHEMICAL AND PROXIMATE CONTENTS OF
COOKED AQUEOUS EXTRACT OF
PHASEOLUS VULGARIS
(KIDNEY BEANS)
Idoko A*
, Onyinye AN, Blessing NO, Ayomide TA, Philip OC, Nwali ON
Department of Biochemistry, Faculty of Natural Sciences, Caritas University, Amorji – Nike, P.M.B. 01784, Enugu, Nigeria.
ABSTRACT
Objective: Plant chemicals and nutrients abound in different parts of plants and in different compositions. P. vulgaris (kidney beans) is a nourishing leguminous food commonly eaten by both human beings and animals in the world due to its health benefits and risk reduction of diseases. It is however, indispensible for plants’ food stuff to retain their phytonutrients for maximum benefits. This study therefore investigated the effect of heat on the phytochemicals and proximate contents in cooked P. vulgaris (kidney beans).
Methods: P. vulgaris (kidney bean) was prepared by winnowing, hand picking of stones and removal of dirt and then lightly washed to remove dust and air dried. Qualitative and quantitative phytochemical analysis and proximate (nutrient contents) analysis were determined on fresh kidney bean (FKB) and cooked kidney bean (CKB).
Results: Results of phytochemical quantification revealed a significant (p˂0.05) increase of alkaloids and saponins in FKB than those in CKB, significant (p˂0.05) increase of flavonoids, glycosides and tannins in CKB than those in FKB. While proximate analysis of cooked sample (CKB) showed significant (p˂0.05) increase in protein content, crude ash content and carbohydrate content FKB.
Conclusion: Obviously, the increased concentrations of phytochemicals in fresh Phaseolus vulgaris may be due to the absence of heat action and the heating effect on cooked P. vulgaris could unleash the high rich nutrients value and could supply its antioxidants roles, thereby improving healthy life when eaten cooked.It was observed that cooking significantly reduced the crude fat. Cooking increased the levels of flavonoids, carbohydrate and protein contents.
Keywords:Cooked bean, fresh bean, heating effect, Phaseolus vulgaris, phytochemicals, proximate content.
Article Info: Received 9 December 2019; Revised 20 December; Accepted 3 January, Available online 15 January 2020 Cite this
article-Idoko A, Onyinye AN, Blessing NO, Ayomide TA, Philip OC, Nwali ON.Heating effect on phytochemical and proximate contents of cooked aqueous extract of Phaseolus vulgaris (kidney beans). Universal Journal of Pharmaceutical Research 2019; 4(6):35-41.
DOI:https://doi.org/10.22270/ujpr.v4i6.334 Address for Correspondence:
Idoko A, Department of Biochemistry, Faculty of Natural Sciences, Caritas University, Amorji–Nike, P.M.B. 01784, Enugu, Nigeria. Tel: +2348032354823, E-mail: idokoalexander1@gmail.com
INTRODUCTION
Kidney bean (P. vulgaris) derived its name from the visual resemblance of the kidney in shape and colour. However, the red colour of the kidney beans should not be confused with other beans such as the pinto beans and adzuki beans, which are also red in colour1. P. vulgaris beans plant strive best in subtropical and tropical weather. The worlds’ largest producer of beans is Brazil, having approximately five million hectares of land cultivated, with the production of 2.2–2.5 million tons2. Researchers have evidently reported the various nutrients in beans and their health benefits, sample recipes and preparation tips3. Beans contain several nutrients including mineral salts such as Mg, Ca, P, Fe and K; contain about 20-25% proteins, 50-60% complex carbohydrates and vitamins4. Certain
digestion of protein and starch was found to be increased from 25-60% in raw beans to 85% in cooked beans7. The sensory properties in beans, including soft texture, mushy texture, sweet, taste and flavor of cooked beans were found to be improved by cooking4. Cooking can result in reduction of content of certain vitamins and volatile phytochemicals and also affect the composition of some nutrients such as amino acids and minerals4. Soaking (quick, short or long traditional) and cooking of beans can easily result in loss or reduced folate content during interaction with fibers11. However, in order to take full advantage of the natural folate content in beans, it is recommended that the method of routine slow-soak before cooking to prepare the beans within two hours thirty minutes should be adopted11. The folate vitamin B notably in beans or its synthetic equivalent, folic acid serves an important function in the human body especially in red blood cells production and it is also involved in embryonic nervous system development at early stages of pregnancy12. Cooking was reported to increase the solubility and bioactivity of soluble iron in beans, lentils, legumes and chickpeas13. The chemical composition of P. vulgaris (kidney beans) was reported to be affected by cooking. Cooking resulted in destruction of antinutrients, alteration of distribution or bioavailability of iron (in glutelins, globulins, albumins and prolamins) and protein denaturation3.Beans are generally rich in health-rich nutrients and consumption of more beans diets could better in general, the healthiness of a person and eliminate risk of obesity, cancers and heart diseases3. Thus, this study investigated the effect of heat on the phytochemicals and proximate contents in cooked P. vulgaris(kidney beans).
MATERIALS AND METHODS
Collection and Authentication of Bean Seeds
P. vulgaris (kidney beans) seeds were purchased from a commercial market (Ogbete main market) in Enugu state, Nigeria. The seeds were identified and authenticated and a voucher number of UNH no 452 (UNH stands for University of Nigeria Herbarium), was given by Mr. Onyeukwu Chijioke John a plant Taxonomist, Department of Plant Science and Biotechnology, University of Nigeria, Nsukka, Enugu state.
Preparation of aqueous extract of Fresh Kidney Bean (FKB) and Cooked Kidney Bean (CKB)
P. vulgaris (kidney bean) was prepared by winnowing, hand picking of stones and removal of dirt and then lightly washed to remove dust and air dried.
Preparation of Fresh Sample (FKB)
Five hundred gram (500g) of the dried bean seeds was weighed and grinded/homogenized into powder. After which it was stored in a clean grease free airtight container with proper labeling for proximate and phytochemicals analysis.
Preparation of Cooked Sample (CKB)
The cooked P. vulgaris (kidney beans) sample was prepared appropriately by hand picking to remove all foreign particles followed by washing and cooked with enough water until soft and without broth to prevent
the loss of some phytochemicals in the bean broth. This was dried under mild sunlight for two weeks under strict supervision. Five hundred gram (500g) of the dried bean seeds was weighed grinded/homogenized into powder. After which it was stored in a clean grease free airtight container with proper labeling for proximate and phytochemical analysis.
Preparation of dry extract from samples
From the powdered samples (CKB and FKB), 200g was weighed and soaked in 700ml of distilled water, carefully sealed, left standing for two days (for thorough extraction), before filtering with whatman filter paper. Concentration of the filtrate was achieved in a water bath at temperature of 70ºC.
Qualitative phytochemical screening of Fresh Bean (FKB) and Cooked Kidney Bean (CKB) samples
Alkaloids, flavonoids, saponins, glycosides, phenols, steroids, tannins, reducing sugars and anthraquinones were identified in cooked and fresh kidney beans samples using standard methods described by Harborne14; Trease and Evans18 with some modifications.
Quantitative phytochemical screening of fresh Kidney Bean (FKB) and Cooked Kidney Bean (CKB) samples
Alkaloids determination
Alkaloids were determined in the bean samples by the method described by Harborne14. Five gram (5g) of powered bean sample was put in a 250ml beaker, unto which was added 200ml of 10% acetic acid in ethanol, covered and left to stand for 4 hours at room temperature and then filtered. Concentration of the filtrate was done in a water bath by evaporation and treatment with additional drops of concentrated aqueous ammonium solution until the alkaloid was precipitated. The precipitated alkaloid was put in a filter paper and weighed as W1. Then, 1% NH3 solution
was used to wash the precipitate and even dried at 80ºC. Then the residue and the filter paper after drying and cooling were weighed as W2. Alkaloid in the sample was expressed in % weight of the sample after calculation with the formula:
% Alkaloid = W1+W2–W1
Flavonoid determination
Determination of flavonoid in the samples was achieved by the method of Bohm and Koupai-Abyazani15. 10g of sample was put in a conical flask of 250ml. Unto this was added 100ml of 80% aqueous methanol, followed by a 3 hours shaking, using an electronic shaker for proper mixing. The mixture was filtered into a previously weighed beaker, and evaporated to dryness over a water bath and weighed to a constant.
Flavonoids in sample was calculated in % with the formula:
% Flavonoid = 𝑊2−𝑊1
𝑊2 × 100
Where, W1=weight of empty beaker and W2=weight of residue (weight of empty beaker+sample after drying).
Determination of Saponin
was 10g of powered bean placed followed by an addition of 100ml of 20% aqueous ethanol. The mixture was thoroughly mixed for about 20 to 30 minutes and was immediately transferred into a conical flask of 250ml. This was covered properly and heated in hot water bath at 90oC for 4 hours, while stirring for proper mixing. Whatman filter paper was used to filter the resulting mixture. The solid residue was mixed with 100ml of another 20% ethanol and heated in a similar way for 4hours. The solution was then filtered and mixed with the previously filtered solution. The combined filtered solution in a beaker was put on a hot water bath at 90ºC and concentrated until reduced to 20% its initial volume. The resultant solution was removed into a separating funnel of 250ml into which was added 10ml of diethyl ether and properly mixed. Formed layer of diethyl layer was discarded carefully after settling down the solution. This process was repeated and addition of 60ml n-butanol resulted in formation of two layers, the bottom layer was discarded and the upper layer recovered. 10ml of 5% NaCl solution was used to wash the combined n-butanol extract two times. Solvent evaporation was done on the upper layer solution by heating in a water bath at 500C until the solution turned into semi-dried form.
% saponin in sample was calculated by the formula: Saponin% = (W2 – W1) × 100
Where, W1=weight of empty beaker and W2=weight of beaker + sample after drying
Determination of Glycosides
Glycosides contents in samples were determined by the method of Amadi et al.,17. Five gram (5g) of the sample was soaked in 100ml of distilled water in a 250ml conical flask and agitated for 3 hours. The sample was filtered and the total extract was measured. 2ml of extract was put in a test tube and 2ml of 10% DNS reagent was added. This was allowed to boil for 20 minutes in a beaker of boiling water. Test tube was cooled in cold water and the absorbance read at 540nm using UV-Vis Spectrophotometer, DHG-9101.
% glycoside in sample was calculated by the formula:
% Glycoside = Absorbance ×total volume of extract
1000 × weight of sample used × 100
Tannin Determination in Sample
The content of tannin in bean power was determined by the method described by Amadi et al., with some modification. 0.5g of the sample was put in a conical flask followed by 50ml of distilled water17. The flask was shaken for 1 hour and filtered. About 5ml of the filtrate was measured into a 50ml volumetric flask and 5ml of 0.1% tannic acid added. The blank was prepared using 5ml of distilled water in a 50ml volumetric flask. The three flasks were incubated for one and half hour at 20ºC using a water bath and the flasks were made up to 50ml mark with distilled water. Concentration was determined at 760nm using UV-Vis Spectrophotomet-er, DHG-9101.
The concentration of tannin was calculated using the formula:
Tannin (mg/l) = 𝑋−𝑌
𝑍−𝑌
Where, X=concentration of extract; Y=concentration of standard (tannic acid); Z=concentration of blank.
Proximate Analysis
The proximate contents of the bean were done using standard prescription as described by AOAC19. The proximate compositions determined include;
Moisture Content
Determination of moisture content in powered bean sample was according to the standard description by AOAC19, with the use of hot air oven. The sample was thoroughly homogenized in a domestic mixer. About 2-10g of homogenized powered bean sample was put in a clean dry petri-dish pre-dried at 98ºC for 60 minutes. Using a hot air oven at 100ºC, the sample was dried by heating for a period of 2 to 3 hours to overnight. Stable weight of the sample was achieved by periodic weighing. Moisture content in sample was calculated in percentage from the difference between the initial sample weight (WI) and the final sample weight after
drying (WD).
% Moisture = 𝑊𝐼−𝑊𝐷
𝑊𝐼 × 100
Where, WI=Initial sample weight
WD= Final sample weight Crude Ash Content
Determination of crude ash content was carried out by the standard description by AOAC19, using muffle furnace. Muffle furnace was used to heat a platinum crucible to 600ºC for 1 hour, cooled in a desiccator and weighed as W1. Two gram (2g) of the dried sample was
weighed (W2) into a crucible and heated at low flame
by keeping on a clay triangle to char the organic matter. The charred material was kept inside the previously set muffle furnace and heat for 6 to 8 hours to greyish white ash and the crucible was cooled in a dessicator and weighed (W3). Complete ashing was
confirmed after the crucible was heated for 30 minutes again, cooled and weighed.
% crude ash in sample was calculated by the formula:
% of ash content (g/100g)= 𝑊3−𝑊1 × 100
(𝑊2−𝑊1)
Where, W1=Weight of crucible, W2=Weight of dry
matter with crucible taken for ashing, W3=Weight of
crucible with ash
Total Protein
Determination of total protein in the samples was by the standard prescription as described by AOAC19, with the use of burette. Series of dilution of 0.2ml, 0.4ml, 0.6ml, 0.8ml and 1ml of the working standard was pipetted in different test tubes. Half (0.5ml) and 1ml of the sample extract was pipetted into two other test tubes. The test tubes were made up to 2ml with distilled water along with the blank tubes. Into all test tubes was 3ml of the burette reagent added, mixed properly and incubated at 37ºC for 15minutes. Colour complex was measured with spectrophotomer at 520nm.
Protein conc. = OD (test) × Conc (std)
OD (std) × Aliquot (test)× 100
Crude Fat
Determination of crude fat of in bean samples was by the standard prescription as described by Pearson20; James21, using Soxhlet apparatus. About 5-10g of dry sample recorded as W1 was placed in a thimble and a
cotton plug was kept on top of it and in turn, it was placed in a Soxhlet apparatus. Into a flat bottom flask weighed as W2 was half volumes of ether added and
distilled for 16 hours the apparatus was cooled and the solvent was filtered into a pre-weighed conical flask. The flask of the apparatus was rinsed with small quantities of ether and then added washings to the above flask. The ether was removed by evaporation and the flask was dried with the fat at 80-100ºC, cooled in a dessicator and weighed as W3.
The percentage of fat content in sample was calculated by the formula:
Fat content (g/100%) = W3−W2
W1 𝑋100
Where, W1= Weight of dry matter taken for extraction W2= Weight of flat bottom flask
W3= Weight of flask with fat
Total Carbohydrate
Determination of carbohydrate contents in bean samples were by the standard prescription of AOAC19 and by the method of nitrogen free extraction (NFE) described by Pearson20. Series of dilution of 0.2ml, 0.4ml, 0.6ml, 0.8ml and 1.0ml, prepared from the working standard were measured into different test tubes. About 0.1ml and 0.2 ml of the sample solution was pipetted into two separate test tubes and each of the test tubes was made up to 1ml with distilled water. A blank test tube was set with distilled water. About 1ml of phenol solution was added to each tube followed by 5ml of 96% sulphuric acid and was mixed very well. After 10minutes, the contents in the test tubes was mixed and placed in a water bath at 25 to 30ºC for 20 minutes and colour change was read at 490nm. The amount of carbohydrate present was calculated using a standard graph.
The percentage of total carbohydrate present was calculated using the formula:
Absorbance corresponding to 0.1ml of the test=X mg of glucose
100ml of the sample solution contains = 𝑋
0.1×100 mg of
glucose = % of total carbohydrate present
Crude Fiber
Determination of crude fiber of the samples was carried out by the prescription of AOAC19. Two gram (2g) of the dried sample was boiled with 200ml of sulphuric acid for 30minutes with bumping chips and filtered through muslin and washed with boiling water until washings are no longer acidic. Upon addition of 200ml Sodium hydroxide solution to the residue, the resulting solution was boiled for 30minutes, filtered with muslin cloth and consecutively washed with 25ml of boiling 1.25% H2SO4, three 50ml portions of water
and 25ml ethanol. Residues were removed and put in aashing dish weighed as W1 and was dried for 2 hours
at 130±2ºC. The dish was cooled in a dessicator and weighed as W2. The dish was heated again for 30
minutes at 600±15ºC, cooled in a dessicator and reweighed as W3.
Thus % crude fiber content in sample was calculated by the formula:
% Crude fiber= W2−W1 −(W3−W2)
Weight of the sample 𝑋100
Statistical Analysis
Analyses were performed in triplicate and average values calculated were expressed according to required units. Analysis of variance (ANOVA) with the IBM statistical package for social sciences (SPSS) for Windows version 23, was used to analyze collected data.
The Bonferroni post hoc test was used to identify the means that differ significantly at p<0.05. Results are presented as mean±standard deviation.
RESULTS
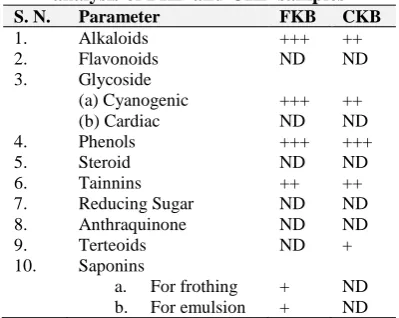
Results of qualitative phytochemical analysis of aqueous extracts of fresh kidney bean (FKB) and cooked kidney bean (CKB) samples.
The phytochemical qualitative screening (Table1) of aqueous extracts of both samples showed that alkaloids were very deeply present (+++) in FKB and deeply present (++) in CKB; both frothing and emulsion saponins were present (+) only in FKB; Cyanogenic glycosides were very deeply present (+++) in FKB and deeply present (++) in CKB; Phenols were very deeply present (+++) in both FKB and CKB; Tannins were deeply present (++) in both FKB and CKB; Terpenoids were present (+) in CKB.
Table 1: Results of qualitative phytochemical analysis of FKB and CKB samples
S. N. Parameter FKB CKB
1. Alkaloids +++ ++
2. Flavonoids ND ND
3. Glycoside
(a) Cyanogenic (b) Cardiac
+++ ND
++ ND
4. Phenols +++ +++
5. Steroid ND ND
6. Tainnins ++ ++
7. Reducing Sugar ND ND
8. Anthraquinone ND ND
9. Terteoids ND +
10. Saponins
a. For frothing
b. For emulsion
+ +
ND ND Very deeply present (+++), deeply present (++), present (+), and not detected (ND), Fresh kidney beans (FKB) and Cooked kidney beans
(CKB).
Results of quantitative phytochemical analysis of aqueous extracts of fresh kidney bean (FKB) and cooked kidney bean (CKB) samples.
Table 2: Results of quantitative phytochemical analysis of RBEB and CBEB samples
S. N. Parameter FKB CKB
1. Alkaloids % 27.17±0.17 5.8±0.01
2. Flavonoids % 10.68±0.33 18.27±0.24
3. Glycosides % 1.18±0.02 1.36±0.01
4. Saponins % 1.17±0.01 ND
5. Tannins % 0.56±0.11 1.04±0.01
Results are Mean ± Standard deviation for duplicate analysis; the mean difference is significant at P<0.05. Fresh Kidney beans (FKB)
and cooked kidney beans (CKB).
Results of proximate analysis of fresh kidney bean (FKB) and cooked kidney bean (CKB) samples
The proximate analysis of the bean samples is shown in Table 3 below. The results showed that moisture content of FKB (3.70±0.01%) was >CKB (3.41±0.01%); ash content of CKB (9.94±0.01%) was >FKB (9.72±0.02%); protein content of CKB (82.290%) was>FKB (22.28%); crude fiber of FKB (16.97±0.01%) was >CKB (6.58±0.01%); crude fat of FKB (14.02±0.01%) was >CKB (8.28±0.01%) and carbohydrate content of CKB (87.29±0.01%) was> FKB (82.90±0.01%).
Table 3: Results of proximate analysis of RBEB and CBEB samples
S. N. Parameter FKB CKB
1. Moisture Content % 3.70±0.01 3.41±0.01
2. Crude Ash Content % 9.72±0.02 9.94±0.01
3. Protein Content % 22.28±0.01 82.29±0.01
4. Carbohydrate % 82.90±0.01 87.29±0.01
5. Crude fibre % 16.97±0.01 6.58±0.01
6. Crude fat % 14.02±0.01 8.28±0.01
Results are Mean ± Standard deviation for duplicate analysis; the mean difference is significant at P<0.05. Keywords: Fresh Kidney beans (FKB) and cooked kidney beans (CKB). Fresh kidney beans
(FKB) and cooked kidney beans (CKB).
DISCUSSION
Results of phytochemical quantification revealed that alkaloids and saponins in FKB were higher than those in CKB, flavonoids, glycosides and tannins in CKB were higher than those in FKB. While proximate analysis of cooked sample (CKB) showed that protein content, crude ash content and carbohydrate content were higher than those in fresh sample (FKB). While moisture content, crude fiber and crude fat of fresh sample (FKB) were higher than those in cooked sample (CKB) P. vulgaris. Qualitative and quantitative phytochemical results are shown in (Table 1 and Table 2). The results revealed higher percentages of flavonoids, glycosides and tannins in CKB than FKB and lower percentages of alkaloids and saponins in CKB than FKB. Higher concentrations of flavonoids were found in the extract of cooked bean. This was consistent with Huber et al.,22 who reported that cooking increases the concentrations of flavonoids fractions in P. vulgaris especially catechin, quercetin and quercetin-3-glucoside and kaempferol and kaempferol-3-rutinoside. Quercetin was said to be very useful in the deterrence and management of cancer, inhibition of free radical generation by hydrogen peroxide, blockage of histamine generation and involved in the reversal of cognitive insufficiency23. On the contrary, Xu and Chang24 assert that cooking
and soaking reduce the concentrations flavonoid in P. vulgaris. Cooking boosted the phenolic compounds’ antioxidant ability of beans and increases its nutritive values22. It is reported that flavonoids are the most abundant secondary metabolites in the plant and their presence in beans are appreciated as they can enhance taste, color and flavor in most beans specie when they are well cooked22. Cooking enhanced the concentration of glycosides in the cooked extract than in the fresh. The level of flavonol glycoside in P. vulgaris was reported to be high in cooked P. vulgaris25. Cyanogenic glycoside is classified as a significant antinutrient factor in plants which must be reduced or destroyed for human and animal food consumption26. The tannin concentration of cooked P. vulgarisis higher than the fresh sample. Like other dark colour legumes, P. vulgaris (red kidney beans) is known to have high content of tannins and phytic acid than white beans27. This could support the high level of tannins in the cooked sample, that even after cooking, the percentage was still high. However, another studyreported contrary reduced tannin content in P. vulgaris after cooking28. Tannins are included as antinutrients in legumes which inhibit the digestion of protein but are destroyed by cooking to increase the functions of amylase and protease and better protein digestion29. Dietary tannins, flavonoids and saponins found in P. vulgaris like other plant sources, are known for their medicinal importance in the preparation of herbal formulation as active constituent to take part in cancer prevention, function as antioxidants and possess anti-inflammatory ability30,31. Cooking reduced the content of alkaloids in cooked extract of P. vulgaris. Different toxic alkaloids are said to be present in beans especially lupines spp., such as pyrrolizidine and piperidine alkaloids32. However on the contrary, Olaofe and Sanni33 reported that alkaloids applications in medicine are suited for their non toxicity for spectacular physiological functions. The low alkaloid content in the cooked extract of P. vulgaris was in agreement with a previous work reported that after the treatment of soaking and cooking, the alkaloid content of Lupin Bean was significantly reduced32. On the contrary, Alhassan et al., reported high level of alkaloid in Balanitesa egyptiaca kernel34.
and body fat mass37. Similarly, a slightly higher crude ash was found in the cooked extract of P. vulgaris. This finding is in contrast to that reported in a previous study, that boiling reduced the content of ash in beans35. The amount of mineral present in plant is attributed to its ash content, thus increased crude ash could suggest high mineral contents in P. vulgaris extract 36. Higher amount of carbohydrate was found in cooked extract than in fresh extract. This is in agreement with Nzewi and Egbuonu36, who asserted that boiling extensively increased the content of carbohydrate in P. vulgaris 58.70±0.7% to 63.37±0.11% (8% increase), a value which is well lower than the one reported here, indicating a consequence of cooking on carbohydrate in P. vulgaris. Carbohydrates contain resistant starch and cooking of legumes in boiling water is reported to decreases the resistant starch content because of destruction of a huge part of the crystalline regions. However, due to a great amount of amylose in legumes and a stable form of crystalline amylase, an infinitesimal quantity of resistant starch is reported to be eliminated by cooking of legumes eventually38. Because the metabolism of resistant starch does not occur in the small intestine, glucose are unconfined into the blood, therefore the need for insulin and food calorific density, which may tend to obesity are reduced39. Furthermore, resistant starch in beans is also reported to increase satiety, reduces glycemic index, lower systolic blood pressure, reduces coronary heart disease risk and prevent rise in blood glucose level40. The moisture content of this finding was higher in fresh extract than in cooked extract of P. vulgaris. This is consistent with Nzewi and Egbuonu36, who reported that heat treatment by boiling and roasting significantly reduced the moisture content of V. sesquipedalis but in contrast to Omenna et al.,35, who reported that boiling increased the moisture content of Vigna unguiculata. Reduced moisture content in legumes plays a role in food storage and preservation as it guarantees a microbial growth inhibition10. The moisture content was reduced possibly because of the high temperature subjection which favors evaporation of the cooked extract for the period it was cooked35. Also, preservation of cooked sample may be enhanced since reduced moisture content is associated with low free fatty acids and acid value41. Crude fiber of cooked P. vulgaris extract was found to be reduced. This is in agreement to Nzewi and Egbuonu36, who reported that boiling and roasting reduced crude fiber content in V. sesquipedalis were crude fiber was reported to be reduced after boiling35. The work of Nzewi et al., is in agreement with this finding as it was reported that boiling and roasting reduced the fat content as time increases in V. sesquipedalis36
.
Similarly, Omenna et al.,35 reported reduced content of crude fat after boiling of V. unguiculata. The little or absence of Na, trans–fat, cholesterol and total fat in beans could be contributive to its health stabilizing ability for healthy consumers42,43. Little or no saturated fat content in cooked beans is recommended for the reduction of cardiovascular risk factors such as raised blood levelsof triacylglycerol and low density lipoprotein cholesterol3.
CONCLUSION
Cooking affected the nutrient contents of P. vulgaris in this study. Beans generally are rich sources of both soluble and insoluble fiber which play a very important role in bowel movement function. The presence of fiber in food helps to keep proper functioning of digestive system and provides satiety or fullness. It was observed that cooking significantly reduced the crude fat. Cooking increased the levels of flavonoids, carbohydrate and protein contents.
CONFLICT OF INTEREST
No conflict of interest exists between authors as it relates this work.
AUTHOR'S CONTRIBUTION
All authors have worked equally in this work.
REFERENCES
1. Gentry HS. Origin of the Common Bean, Phaseolus
vulgaris. Economic Botany. New York: New York Botanical Garden Press 1999; 23 (1): 55–69.
https://doi.org/10.1073/pnas.1108973109
2. Brigide P, Canniatti-Brazaca SG. Antinutrients and in vitro
availability of iron in irradiated common beans (Phaseolus vulgaris). Food Chemistry 2006; 98: 85-89.
https://doi.org/10.1016/j.foodchem.2005.05.054
3. Julie G, Krystle M. All about beans nutrition, health benefits,
preparation and use in Menus. North Dakota State University, Fargo, North Dakota 2019; 1-16.
https://doi.org/10.1001/2013.jamainternmed.70
4. Słupski J. Effect of cooking and sterilisation on the
composition of amino acids in immature seeds of flageolet bean (Phaseolus vulgaris L.) cultivars. Food Chem 2010; 121(4):1171-1176.
https://doi.org/10.1016/j.foodchem.2010.01.066
5. Wang N, Hatcher DW, Tyler RT, Toews R, Gawalko EJ.
Effect of cooking on the composition of beans (Phaseolus vulgaris L.) and chickpeas (Cicer arietinum L.). Food Res Int 2010; 43(2): 589-594.
https://doi.org/10.1016/j.foodres.2009.07.012
6. Garcia JS, Magalhães CS, Arruda MAZ. Trends in
metal-binding and metalloprotein analysis. Talanta 2006; 15; 69(1):1-15.https://doi.org/10.1016/j.talanta.2005.08.041
7. Bressani R. Grain quality of common beans. Food Rev Int
1993; 9(2): 237-297.
https://doi.org/10.1080/87559129309540960
8. Juliana N, Pedro VO. Cooking effects on iron and proteins
content of beans (Phaseolus vulgaris L.) by GF AAS and MALDI-TOF MS. J Braz Chem Soc 2012;23(1):0103-5053. https://doi.org/10.1590/S0103-50532012000100022
9. Ramírez-Cárdenas L, Leonel AJ, Costa NMB, Reis FP. Zinc
bioavailability in Legumes. Food Res. Int 2010; 43:573. https://doi.org/10.1079/BJN/2002718
10. Mercy JN. Food Safety; Take life easy; eat, drink and be merry. Luke 12: 19b.Ghana Med J 2005; 39(2): 44–45. PMID: 17299541
11. Hoppner K, Lampi B. Folate retention in dried legumes after different methods of meal preparation. Food Res Int 1993; 26:45-48. https://doi.org/10.1016/0963-9969(93)90104-Q 12. United States Food and Drug Administration, Health and
Human Services: Code of Federal Regulations. Section 101.79-Health claims: folate and neural tube defects. 2012;2. 13. Quinteros A, Farre R, Lagarda MJ. Optimization of iron speciation (soluble, ferrous and ferric) in beans, chickpeas and lentils. Food Chemistry 2001; 75:365.
14. Harborne JB. Phytochemical Methods, London Chapman and Hall Limited 1973; 49-188.
15. Bohm BA, Koupai-Abyazani MR. Flavonoids and
condensed tannins from leaves of Hawaiian Vaccinium
reticulatum and V calycinum (Ericaceae). Pac Sci 1994;
48(4): 458-463. http://hdl.handle.net/10125/2298
16. Obadoni BO, Ochuko PO. Phytochemical Studies and comparative efficacy of the crude extracts of some homeostatic plants in edo and delta states of Nigeria. Global J Pure App Sci 2001; 8: 203-208.
https://doi.org/10.4314/gjpas.v8i2.16033
17. Amadi ES, Nwakpu K, Nworie O, Ogbu O. Evaluation of the in vitro effects of some medicinal plants on Escherichia coli. J Health Visual Sci 2004; 6:176-179.
https://doi.org/10.1055/s-0036-1596360
18. Trease GE, Evans WC. Pharmacognosy. A physician guide
to herbal medicine, 11thedn. Ballere Tindal, London, United
Kingdom 1989; 530.
19. Association of Official Analytical Chemists (AOAC).
Official methods of Analysis, (18thedn). Washington, DC
USA 2005
20. Pearson DA. The clinical analysis of food, (7th edn.)
Churchill Livingstone, Edinburgh 1976. https://trove.nla.gov.au/version/45250339
21. James CS. Analytical Chemistry of Foods. Backie Academic and Professional New York 1996.
22. Huber K, Brigide P, Bretas EB, Canniatti-Brazaca SG. Phenolic acid, flavonoids and antioxidant activity of common brown beans (Phaseolus vulgaris L.) before and after cooking. J Nutr Food Sci 2016; 6: 551.
https://doi.org/10.4172/2155-9600.1000551
23. Rauter AP, Dias C, Martins A, Branco I, Neng NR, et al.
Non-toxic salvia sclareoidesbrot. extracts as a source of
functional food ingredients: phenolic profile, antioxidant activity and príon binding properties. Food Chem 2012; 132: 1930-1935.
https://doi.org/10.1016/j.foodchem.2011.12.028
24. Xu BJ, Chang SKC. Total phenolic, phenolic acid, anthocyanin, flavan-3-ol, and flavonol profiles and antioxidant properties of pinto and black beans (Phaseolus vulgaris L.) as affected by thermal processing. J Agric Food Chem 2009; 57: 4754-4764.
https://doi.org/10.1021/jf900695s
25. Pitura K, Arntfield SD. Characteristics of flavonol glycosides in bean (Phaseolus vulgaris L.) seed coats. Food Chem 2019; 272:26-32.
https://doi.org/10.1016/j.foodchem.2018.07.220
26. Soetan KO, Oyewole OE. The need for adequate processing to reduce the anti-nutritional factors in plants used as human foods and animal feeds: A review. African J Food Sci 2009; 3(9): 223-232.
27. Mamiro PS1, Mwanri AW, Mongi RJ, Chivaghula TJ, Nyagaya M, Ntwenya J. Effect of cooking on tannin and phytate content in different bean (Phaseolus vulgaris) varieties grown in Tanzania. African JBiotech 2017; 16(20): 1186-1191. https://doi.org/10.5897/AJB2016.15657 28. Nuzhat H, Muhammad A, Samreen S, Muhammad IK,
Shahzad H. Effect of soaking and cooking on nutritional quality and safety of legumes. Nutrition Food Sci 2008; 38(6):570-577
https://doi.org/10.1108/00346650810920187
29. Bressani R. Bean grain quality-a review. Arch Latinoam Nutr 1989; 39:19–42.
https://doi.org/10.1080/87559129309540960
30. Nwali ON, Idoko A, Okolie JE, Ezeh E, Ugwudike PO, Rita ON, Ezenwali MO, Odo IA, Ani PN and Okolie SO. Comparative analysis of the phytochemical compositions of leaf, stem-bark and root of Azadirachta Indica (neem). Univ J Pharm Res 2018; 3(5): 46-50.
https://doi.org/10.22270/ujpr.v3i5.201
31. Oskoueian E, Abdullah N, Saad WZ, Omar AR, Ahmad S, Kuan WB, Zolkifli NA, Ho YW. Antioxidant, anti-inflammatory and anticancer activities of methanolic extracts from Jatropha curcas Linn. J Med Plants Res 2011; 5: 49– 57. https://doi.org/10.14202/vetworld.2018.99-103
32. Yadesa A, Biadge K. Effect of some traditional processing methods on nutritional composition and alkaloid content of lupin bean. Int J Bioorg Chem 2017; 2(4):174-179.
https://doi.org/10.11648/j.ijbc.20170204.13
33. Olaofe O, Sanni CO. Nutritional component of some non-conventional leaf vegetable consumed in Cameroon. Food Chem 1988; 30:73-77.
https://doi.org/10.3923/pjn.2007.712.717
34. Alhassan AJ, Muhammad IU, Idi A, Danagmbo MA, Ramatu Y, Mohammad A, Nasir A, Yaradua AI, Adamu SM, Alexander I. Phytochemical Screening and Proximate
Analysis of Balanitesa egyptiaca Kernel. Food Sci Qual
Manag 2018; 74:37-41.
https://doi.org/10.4103/0973-7847.79100
35. Omenna EC, Olanipekun OT, Kolade RO. Effect of boiling, pressure cooking and germination on the nutritional and antinutrients content of cowpea (Vigna unguiculata). ISABB J Food Agr Sci 2016; 6(1): 1-8.
https://doi.org/10.5897/ISABB-JFAS2016.0036
36. Nzewi D, Egbuonu ACC. Effect of boiling and roasting on the proximate properties of asparagus bean (Vigna Sesquipedalis). African J Biotech 2011; 10(54): 11239-44. https://doi.org/10.1089/jmf.2007.0700
37. Abete I, Parra D, Martinez JA. Legume-, fish, or high-protein-based hypocaloric diets: effects on weight loss and mitochondrial oxidation in obese men. J Med Food 2009; 12(1):100-108. https://doi.org/10.1089/jmf.2007.0700 38. Guy C. Ask the expert: legumes and resistant starch. The
Nutrition Source 2015. Retrieved from
www.hsph.harvard.edu/guy-crosbyl/
39. Behall KM, Howe JC. Contribution of fiber and resistant starch to metabolizable energy. Am JClinNutr 1995; 62: 1158S-1160S. https://doi.org/10.1093/ajcn/62.5.1158S 40. Jenkins DJA, Kendall CWC, et al. Effect of legumes as part
of a low glycemic index diet on glycemic control and cardiovascular risk factors in type 2 diabetes mellitus. Arch Intern Med 2012; 26; 172(21):1653-60.
https://doi.org/10.1001/2013.jamainternmed.70
41. Ejikeme PM, Obasi LN, Egbuonu ACC. Physico-chemical
and toxicological studies on Afzelia Africana seed and oil.
Afr J Biotechnol 2010; 9(13): 1959-1963. https://doi.org/10.5897/AJB09.965
42. United States Department of Agriculture, Health and Human Services. Chapter 4 in Dietary Guidelines for Americans,
7thedn. Washington, DC: U.S. Government Printing Office
2010. https://doi.org/10.3945/an.111.000430