INTRODUCTION
In water distribution systems both physico-chemical and microbiological indices can change. There are a lot of factors that have an effect on secondary contamination of water that can be supplied to consumers. The type and intensity of processes occurring within water supply systems decide on the form of contamination (suspended, colloidal or dissolved). However, the type of con-centration of contaminants penetrating into water depend on the amount and chemical composition of deposits in a water supply system, the number and kind of microorganisms living in biofilms, microbial metabolic pathways, biochemical pro-cesses and stability of flowing water [Kowal and Świderska-Bróż 2009, Pierścieniak 2009].
Chemical and microbiological stability of wa-ter in distribution systems is affected by the raw water quality [Jachimowski 2016] and reliability of treatment processes. Therefore, the main prob-lem of all water supply systems is the loss of
wa-ter stability during the transmission from wawa-ter treatment plant to customer [Łomotowski 2007, Kowal and Świderska-Bróż 2009].
Water is considered as chemically stable when it does not cause the precipitation of deposits, mainly calcium carbonate (CaCO3) [Świderska-Bróż and Wolska 2006, Biłozor et al. 2010]. The main indicators of contamination for chemically unstable water in the water distribution system are total iron and related turbidity, colour and the use of free chlorine [Świderska-Bróż i Wolska 2005]. However, biologically stable water does not support microbial growth. This is connected with the lack of organic and inorganic nutrients enabling microbial growth [Świderska-Bróż 2003, Świderska-Bróż and Wolska 2006, Kowal and Świderska-Bróż 2009, Biłozor et al. 2010].
Secondary bacterial growth in the water sup-ply system imposes high doses of disinfection agents to be used to inhibit microbial growth. This is why the kind and concentration of disinfectant used depend on the number of microorganisms
FACTORS AFFECTING WATER QUALITY IN A WATER SUPPLY NETWORK
Artur Jachimowski1
1 Department of Technology and Ecology of Products, Faculty of Commodity Science, Cracow University of
Economics, Rakowicka 27, 31-510 Kraków, Poland, e-mail: artur.jachimowski@uek.krakow.pl
Volume 18, Issue 4, July 2017, pages 110–117
DOI: 10.12911/22998993/74288 Research Article
ABSTRACT
An effect of factors determining water quality in the water supply network in Kraków is assessed. The data collected over a four-year research period included quality pa-rameters of water taken from the water distribution system in the period between 1 January 2011 and 31 December 2014. In the analysis the supply zones of four municipal water treatment plants in Krakow were considered. The selection of 29 water sampling points within the supply area allowed comparing water quality with respect to operational and technological aspects. Factor analysis enabled 4 compo-nents explaining correlations between tap water quality variables to be distinguished. It follows from the research performed that the obtained factors applied to 77% of overall water variability. The highest share was assigned to factor 1 that explained 32% of the chemical composition of water under consideration and was correlated with calcium, conductance, nitrates (V), magnesium and to a moderate extent with ∑ THM (with negative sign).
Keywords: factor analysis, secondary contamination of water, water supply network, water quality
and their resistance to a specified agent, pipe -line material and deposits that use disinfectant [Kowal, Świderska-Bróż 2009]. Water supply tubing is an ideal habitat both for heterotrophic and autotrophic bacteria. However, the develop-ment of biofilm depends on the quality of water flowing through the pipe network. The presence of assimilable organic carbon in water is a factor limiting the growth of heterotrophic microorgan-isms [Łomotowski 2007].
During the transmission of water in water sup -ply networks a deterioration of its taste and odour and increased colour and turbidity indices are of-ten observed. There is also a risk of an increase in the number of indicator bacteria. In addition, in water disinfected with chlorine or chlorine di-oxide the amount of disinfection by-products in-creases. Also, iron and manganese concentrations increase and water pH, hardness and alkalinity change [Łomotowski 2007, Bergel et al. 2013].
The aim of this paper is to determine an effect of some factors on water quality in the distribution system of the Water Treatment Plants at the Munic -ipal Water Supply and Sewerage Plant in Kraków. Application of factor analysis to identify the origin of chemical composition of water intend-ed for human consumption is presentintend-ed. This is a complex problem as water production is based on 4 water treatment plants (Raba, Rudawa, Dłubnia and Bielany) that use surface waters as a source of drinking water, except for one deep water intake. The analysis made in the years 2011 to 2014 pertained to selected physicochemical parameters determined in selected points of the water supply network.
SECONDARY CONTAMINATION OF
WATER IN DISTRIBUTION SYSTEM
The cause of deteriorating water quality may be sediments which build up on the inside of pipelines. The research performed has shown that iron sediments may occur inside water supply pipelines at iron concentration of 0.05 mg·dm-3.
This leads to an increase in iron concentration despite of good water chemical composition when pumping water into the network. This is caused by picking off sediments due to changes in water flow direction or rate in water distribu -tion network and iron penetra-tion into water by its dissolution. It has been demonstrated that in the latter case an appropriate oxygenation can
inhibit the diffusion of Fe(II) from the sediment into tap water [Weber 2010].
The quality of the treated water depends, to a large extent, on factors related to technical con-dition and the age of the water supply network [Gamrot et. al. 2001, Bergel 2012]. Pipe age that decides on failure rate is of special importance. A long period of use significantly accelerates the wear of pipe materials [Bergel et. al. 2013]. This increases the risk of water supply system failure [Tchórzowska-Cieślak 2010, Kwietniewski 2011, Rak and Tchórzowska-Cieślak 2013]. Hydraulic conditions in the water supply network (flow ve -locity, water pressure and too long water age as well as water supply outages have an important effect on the quality of water delivered to con -sumers [Świderska-Bróż and Wolska 2006].
One of the factors causing the deterioration of water supplied to customers is corrosion process-es in outdoor and indoor water pipprocess-es. Corrosion is enhanced by the presence of aggressive car-bon dioxide in water that deteriorates the passive films (oxide coatings). Corrosion rate is affected not only by water pipeline materials but also by physicochemical composition of water. The effect of corrosion is the deterioration of water supply network materials and enrichment of water deliv-ered to customers with dissolved forms of met-als. Therefore, the quality of water delivered to consumers depends primarily on processes that occur in the water distribution system. The water corrosivity index plays an important role in these processes [Januszewska et al. 2011].
Biofilms may be formed on the inner walls of water supply pipelines. They may increase the risk of microbiological contamination of wa-ter. As follows from the research carried out, the strongest water quality changes related to corro-sion and biofilms will occur in indoor water sup -ply systems of small diameter pipes.
In the water disinfection process chlorine wa-ter or chlorine dioxide solutions are used. Some water supply plants use sodium hypochlorite.
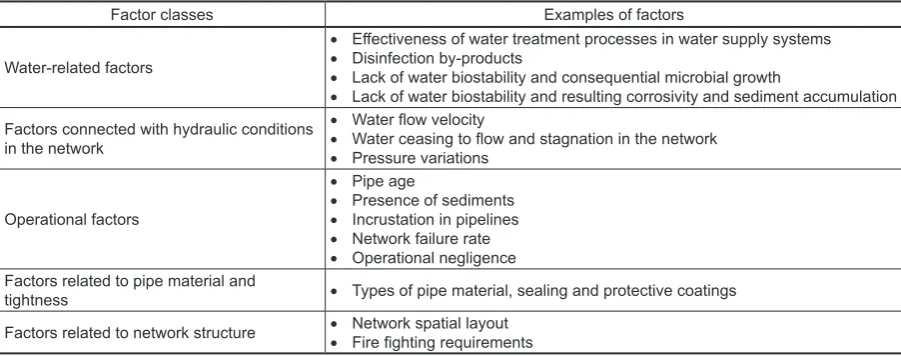
The key task of collective water supply sys-tems is to provide inhabitants with healthy water [Act of 7 June 2001]. However, this objective is not always achieved. This is observed in deterio-rating water quality in distribution systems for many years. There are various causes of second-ary contamination of water delivered to custom-ers. They may occur individually or coexist and interact, thus deteriorating the quality of water transferred in distribution systems. The thor-ough analysis allowed identification of the cru -cial factors involved. When classifying them the full range of causes of secondary contamination in the network was considered and the factors of especially strong influence on water quality (ac -cording to its severity) were highlighted [Kwiet -niewski et. al. 2012]. When considering the above assumptions the following division has been pro-posed, as presented in Table 1.
The factors listed above do not always affect individually the quality of water transferred in the network. A single factor may often cause chang-es in water quality in various areas of influence [Kwietniewski et. al. 2012].
However, Bergel and other researchers di -vide the factors affecting tap water quality into two categories: external and internal ones. The external ones include water contamination during failures and its resolving, expanding the pipelines and operation and repairs. The inner ones include sediment accumulation in pipes, sediment loosen-ing, pipe corrosion, chemical reactions in water, microbial growth on pipe walls and biological contamination (the so called biofilm) [Świderska-Bróż and Wolska 2007, Bergel et. al. 2009].
RESEARCH METHODOLOGY
The object of this study was to perform statis -tical analysis of laboratory water test results in the distribution network in Kraków. The determina -tion of tap water physicochemical parameters was carried out in the years 2011 – 2014. Test samples were taken at a specified point of the network on average every three months every year (Table 2). The mean values were computed from the results obtained over an 8-year period. The results of de -termination were made available from the Cen-tral Laboratory of the MPWiK S.A. of Kraków [Central Laboratory MPWiK S.A. 2015], and selected indices were determined according to the research method register [Central Laboratory MPWIK S.A. 2013].
The samples of treated water for laboratory testing were taken at points located in various Kraków districts. There were primarily public facilities such as schools, kindergartens, shops, petrol stations and offices.
The basic statistical parameters, i.e. mean, minimum and maximum values, standard devia-tion and coefficient of variadevia-tion were calculated for selected tap water quality parameters.
To identify processes deciding on the chem-istry of water taken and treated by the ZUW fac-tor analysis, principal component method was used. This technique allows the variability of all water parameters under examination to be anal-ysed simultaneously, and various sources of tap water contamination to be extracted as factors. Another possibility is to determine the percentage share of theses sources in forming water chemi-cal composition [Modelska and Burzyński 2007].
Table 1. Factors causing secondary contamination in water supply networks
Factor classes Examples of factors
Water-related factors
• Effectiveness of water treatment processes in water supply systems
• Disinfection by-products
• Lack of water biostability and consequential microbial growth
• Lack of water biostability and resulting corrosivity and sediment accumulation Factors connected with hydraulic conditions
in the network
• Water flow velocity
• Water ceasing to flow and stagnation in the network
• Pressure variations
Operational factors
• Pipe age
• Presence of sediments
• Incrustation in pipelines
• Network failure rate
• Operational negligence Factors related to pipe material and
tightness • Types of pipe material, sealing and protective coatings Factors related to network structure • • Network spatial layoutFire fighting requirements
The principal component analysis was used also to examine the water produced by 4 water treat -ment plants (Raba, Rudawa, Dłubnia and Biela -ny) that employ a highly advanced treatment technology [Adamczyk and Jachimowski 2014]. This is why only these parameters that had suf-ficient representations and showed diversification were used.
RESULTS AND DISCUSSION
The most important cause of secondary contamination of water introduced into the dis-tribution network from the treatment plant is the lack of its biological and chemical stability. However, there are conditions enhancing bac-terial growth and sedimentation dissolution in stable drinking water.
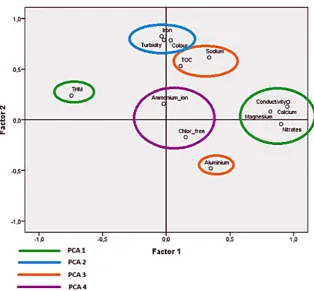
The following physicochemical indices were determined in tap water: free chlorine, colour, tur-bidity, pH, conductivity, iron, aluminium, sodium, ammonium ion, potassium, magnesium, calcium, ∑ chlorates(V) and chlorates(III), fluorides, chlo -rides, nitrates(III), nitrates(V), phosphates(V), sulphates(VI), copper, total organic carbon (TOC), ∑THM (total trihalomethanes). For the
above parameters the most important factors re-sponsible for water quality changes in the distri-bution system are presented in (Fig. 1). It follows from the correlation matrix of factor loadings that the examined waters from Rudawa, Dobczyce Reservoir, Dłubnia and Sanka differ in the num -ber and share of extracted factors (Table 3). Table 2. Water sampling points in the municipal water supply network in Kraków in the years 2011–2014
Item Sampling point Supply area Item Sampling point Supply area
1 ul. Zarzecze 106 – fire department
ZUW Rudawa
16 ul. Kutrzeby 4 – NZOZ Kraków Południe (Central Laboratory)
ZUW Raba
2 ds. Sosnowa 8 – Sera and Vaccines Manufacturing Company 17 ul. Kosiarzy 1 – MPWiK – Sewage Treatment Plant
3 ul. Stawowa 179 – school 18 Rynek Podgórski 1 – Kraków City Council
4 ul. Tokarskiego 1 – DS “Akropol” (dormitory) 19 ul. Komandosów 1 – SM Podwawelska
5 ul. Nałkowskiego 1 – health care centre 20 ul. Stoczniowców 7 – health care centre 6 ul. Łokietka 177 – Energoprzem 21 ul. Kantorowicka 77 – bakery
ZUWDłubnia
7 ul. Poronińska 7 – Samorządowe Przedszkole nr 145
ZUW Raba
22 os. Złotej Jesieni 1 – WSS im. L. Rydygiera
8 ul. Chałubińskiego 21 – sklep ogólnospożywczy „Olimp” 23 os. Górali 5 – Dom Kultury
9 ul. Stojałowskiego 1 – petrol station 24 os. Na Skarpie 8 – szkoła 10 ul. Cechowa 57 – school 25 ul. Mirowska 278 – RZGW
ZUW Bielany
11 ul. Babińskiego 29 – Krakowski Szpital Neuropsychiatryczny 26 ul. Astronautów 5 – sklep
12 ul. Spółdzielców 3, Spółdzielnia Mieszkaniowa na Kozłówce, 27 ul. Kamedulska 70 – health care centre
13 ul. Bieżanowska 40 – kindergarten 28 Tyniec, ul. Bolesława Śmiałego 7 14 ul. Brożka 3 – M.P.K.
29 Las Wolski – ZOO
15 ul. Gronostajowa 3 – kampus UJ
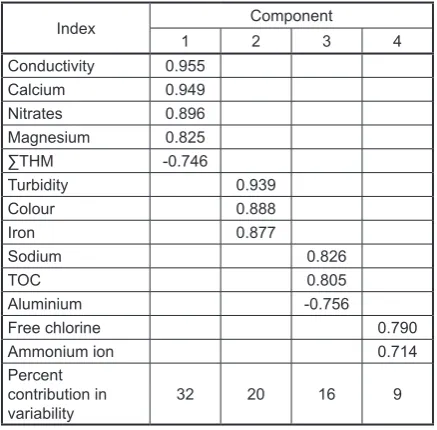
Table 3. Rotated component matrix – tap water
Index Component
1 2 3 4
Conductivity 0.955
Calcium 0.949
Nitrates 0.896
Magnesium 0.825
∑THM -0.746
Turbidity 0.939
Colour 0.888
Iron 0.877
Sodium 0.826
TOC 0.805
Aluminium -0.756
Free chlorine 0.790
Ammonium ion 0.714
Percent contribution in
variability 32 20 16 9
The analysis of waters coming from 4 main supply areas of the city of Kraków enabled 4 fac -tors that explain 77% of its chemical composition to be isolated. Based on factor loadings of water withdrawn at specified points of the water sup -ply network factor 1 that explains 32% of water chemical composition was isolated. During the analysis it was highly correlated with the follow-ing indices: calcium, conductivity, nitrates(V), magnesium and moderately with ∑THM (with negative sign). These indices have the largest contribution in multi-feature differentiation of tap water quality. The values of factor loadings indi-cate that water that contained a relatively large amount of nitrates(V) had both higher conductiv-ity and total hardness (sum of Ca2+ and Mg2+ions).
However, soft waters of the lowest conductivity among all examined samples had a relatively high concentration of disinfection by-products, i.e. ∑THM. These waters were produced at the ZUW Raba where gaseous chlorine is used.
Factor 2 that explains 20% variability of chemical composition is characterised by a strong correlation with turbidity, colour and iron. This indicates that the number of colour units in-creased with increasing iron concentration. Iron
cause water to turn a reddish brown colour and give water an unpleasant taste and odour and stimulates bacterial growth. In addition, the pres-ence of iron compounds in drinking water causes turbidity that enhances microbial growth.
Factor 3 representing 16% of variability is strongly correlated with sodium, total organic carbon and aluminium (minus sign). This indi-cates that the use of aluminium coagulants pro-motes removal of organic substances from water of lower sodium ion concentrations.
For Factor 4 that explains 9% of water chemi -cal composition, there is a strong relationship with free chlorine and a moderate with ammo-nium nitrogen. The content of ammoammo-nium ni-trogen is an important factor from the chlorine disinfection efficiency, as it forms chloramines in reaction with chlorine.
The principal component analysis carried out forms a general assessment model for water quality in the water supply system of the city of Kraków. This consists in determining quite new variables (principal components) to explain chem-ical composition variations for the examined wa-ter. Each of isolated factors has been represented as a linear combination of the original variables. Fig. 1. Plot of factor loadings for tap waters in the years 2011–2014
AN ASSESSMENT OF WATER QUALITY IN
A WATER SUPPLY NETWORK
The water quality indices at selected points of the water supply network that correspond to a specified plant were evaluated. Moni -toring covered the period between 2011 and 2014. The values of microbiological and physico -chemical parameters were compared with guide-lines contained in the Regulation of the Minister of Health on quality requirements for water in-tended for human consumption [Regulation of the Minister of Health of 13 November 2015].
When assessing the quality of water tak-en into the water supply network of the city of Kraków it should be concluded that monthly
means of analysed physicochemical indices in the period under investigation meet the requirements of national [Regulation of the Minister of Health of 13 November 2015] and European standards [EU Directive 98/83/EC of 3 November 1998]. It follows from the conducted research that the water produced at the ZUW Raba was of the best quality – the lowest values of physicochemical indices compared to those of other plants [Adam -czyk and Jachimowski 2012].
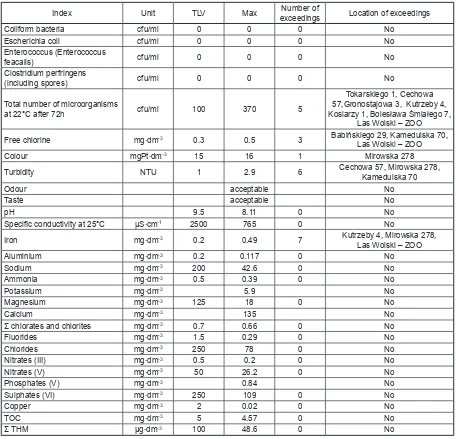
The maximum values of tap water quality in-dices are presented in Table 4.
In water intended for consumption the values of microbiological indices , i.e. group of coliform bacteria, Escherichia coli, Enterococcus and
Clos-tridium perfringens should be 0 cfu in 100 ml of
Table 4. An assessment of water quality in the municipal water supply network in Kraków in the years 2011–2014
Index Unit TLV Max exceedingsNumber of Location of exceedings
Coliform bacteria cfu/ml 0 0 0 No
Escherichia coli cfu/ml 0 0 0 No
Enterococcus (Enterococcus
feacalis) cfu/ml 0 0 0 No
Clostridium perfringens
(including spores) cfu/ml 0 0 0 No
Total number of microorganisms
at 22°C after 72h cfu/ml 100 370 5
Tokarskiego 1, Cechowa 57,Gronostajowa 3, Kutrzeby 4, Kosiarzy 1, Bolesława Śmiałego 7,
Las Wolski – ZOO
Free chlorine mg∙dm-3 0.3 0.5 3 Babińskiego 29, Kamedulska 70,
Las Wolski – ZOO
Colour mgPt∙dm-3 15 16 1 Mirowska 278
Turbidity NTU 1 2.9 6 Cechowa 57, Mirowska 278, Kamedulska 70
Odour acceptable No
Taste acceptable No
pH 9.5 8.11 0 No
Specific conductivity at 25°C µS∙cm-1 2500 765 0 No
Iron mg∙dm-3 0.2 0.49 7 Kutrzeby 4, Mirowska 278,
Las Wolski – ZOO
Aluminium mg∙dm-3 0.2 0.117 0 No
Sodium mg∙dm-3 200 42.6 0 No
Ammonia mg∙dm-3 0.5 0.39 0 No
Potassium mg∙dm-3 5.9 No
Magnesium mg∙dm-3 125 18 0 No
Calcium mg∙dm-3 135 No
Σ chlorates and chlorites mg∙dm-3 0.7 0.66 0 No
Fluorides mg∙dm-3 1.5 0.29 0 No
Chlorides mg∙dm-3 250 78 0 No
Nitrates (III) mg∙dm-3 0.5 0.2 0 No
Nitrates (V) mg∙dm-3 50 26.2 0 No
Phosphates (V) mg∙dm-3 0.84 No
Sulphates (VI) mg∙dm-3 250 109 0 No
Copper mg∙dm-3 2 0.02 0 No
TOC mg∙dm-3 5 4.57 0 No
Σ THM µg∙dm-3 100 48.6 0 No
examined water. The related requirements stipu-lated in the regulation were met. The total num-ber of microorganisms at 22°C after 72h should not exceed 100 cfu per 100 ml of water. These re-quirements have not been met at eight points of the water supply network, namely: Tokarskiego 1 (22 July 2014 – 130 cfu/ml), Cechowa 57 (3 October 2012 – 134 cfu/ml), Gronostajowa 3 (17 June 2014 – 104 cfu/ml), Kutrzeby 4 (31 August 2011 – 370 cfu/100 ml), Kosiarzy 1 (31 August 2011 – 110 cfu/100 ml), Stoczniowców 7 (19 August 2014 – 180 cfu/ml), Tyniec – Bolesława Śmiałego 7 (24 April 2013 – 112 cfu/100 ml) and Las Wol -ski – ZOO (24 April 2013 – 121 cfu100 ml).
If water is contains chlorine compounds ex-ceeding the applicable standard, free chlorine should be kept at a level of 0.3 mg∙dm-3. The
max-imum permissible chlorine concentration in wa-ter was exceeded at: Babińskiego St. 29 (4 April 2012 – 0.50 mg∙dm-3), Kamedulska 70 (1 March
2011 – 0.44 mg∙dm-3) and Las Wolski – ZOO (13
February 2012 – 0.38 mg∙dm-3).
Water colour should be acceptable for con-sumers and show no abnormal changes. Accord-ing to the regulation of the Minister of Health of 2007, the permissible value was set at 15 mgPt∙dm-3. This limit has been exceeded only
once – on 7 June 2011 at Mirowska St. 278 and was 16 mgPt∙dm-3.
According to legal regulations drinking wa-ter turbidity must be acceptable for consumers, and should show no abnormal changes and not exceed 1 NTU. This limit was exceeded once in water withdrawn at Cechowa 57 (31 July 2012 – 1.1 NTU), 5 times at Mirowska 278 (1 March 2011 – 1.5 NTU; 7 June 2011 – 2.9 NTU; 13 February 2012 – 1.5 NTU; 9 May 2012 – 1.2 NTU; 22 April 2014 – 2 NTU) and twice at Ka -medulska 70 (7 June 2011 – 1.26 NTU; 22 April 2014 – 1.5 NTU).
Odour and taste of water intended for sumption by humans were acceptable for con-sumers and did not exceed permissible standards. The examined water had pH ranging from 6.5 to 9.5, i.e. compliant with the quality requirements. The highest pH of 8.11 was recorded in water tak -en at Stoczniowców St. on 19 November 2014.
According to standards, conductiv-ity of clean water should be lower than 2500 μS∙cm-1. At sampling points this parameter
did not exceed permissible values. The highest conductivity of 765 μSm∙dm-3 was observed on 3
April 2012 at Tokarskiego St. 1.
Iron concentration should be kept at a level of 0.2 mg∙dm-3. An increased content of this element
was found 8 times: one at Kutrzeby 4 (31 Au -gust 2011 – 0.303 mg∙dm-3), 5 times at Mirows
-ka 278 (1 March 2011 – 0.490 mg∙dm-3; 7 June
2011 – 0.382 mg∙dm-3; 13 February 2012 – 0.479
mg∙dm-3; 9 May 2012 – 0.204 mg∙dm-3; 22 April
2014 – 0.308 mg∙dm-3) and twice at Las Wols
-ki – ZOO (9 May 2012 – 0.219 mg∙dm-3; 16 Janu
-ary 2013 – 0.228 mg∙dm-3).
Other parameter, namely aluminium, sodium, ammonium nitrogen, potassium, magnesium, cal-cium, Σ chlorates(V) and chlorates(III), fluorides, chlorides, nitrates(III), nitrates(V), sulphates(VI), copper, TOC and ΣTHM did not exceed permis -sible values stipulated in standards.
CONCLUSIONS
1. A plurality of factors determining drinking water quality causes that the quality is a func-tion of many parameters that have a different and variable contribution in the final microbio -logical and physicochemical composition. The factors associated with water, hydraulic condi-tions in the network, pipe material and sealing and network structure play an important role. 2. Factor analysis enabled 4 components explain
-ing a relationship between tap water quality indices to be distinguished. The obtained fac-tors applied to 78% of total water variability. The highest share was assigned to factor 1 that explained in 32% the chemical composition of water under consideration and was correlated with calcium, conductance, nitrates(V), mag-nesium and to a moderate extent with ∑ THM (with negative sign).
3. Within the ZUW Dłubnia drinking water sup -ply area an increase of ∑THM concentration with increasing distance from the plant was ob-served. It follows from the analysis carried out that water disinfection by-products (∑ THM) did not exceed permissible limits.
4. An increase in iron concentration at specified points of the network may indicate corrosion of pipelines.
REFERENCES
1. Adamczyk W., Jachimowski A. 2014. An effect of the Treatment Process on Drinking Water Quality in Cracow”, [W:] Szakiel J. (edit.) Commodity Sci-ence in Research and Practice. Achievements and challenges of commodity science in the age of glo-balization. PolishSociety of Commodity Science. Cracow. Poland, 7–19.
2. Adamczyk W., Jachimowski A. 2012. Drinking water quality in the city of Kraków in the years 2007 – 2010, [W:] Żuchowski J., Zieliński R. (edit.) Role of innovativity in quality creation. Sci-entific Publishing House Institute for Technology of Exploitation – PIB. Radom, 188–200.
3. Bergel T., Kaczor G., Bugajski P. 2013. Techni-cal conditions of water supply networks in small waterworks of the Małopolska and Podkarpackie Voivodeships. Infrastructure and ecology of rural areas, 3, 291–304.
4. Bergel T., Pawełek J., Rułka Z. 2009. Turbidity of water provided by the water supply systems in the Malopolskie Voivodeship. Environmental Pollu-tion Control, 31, 4, 61–64.
5. Bergel T. 2012. An age and a materials structure of small grouped water-supplies in Poland. Gas, Wa-ter and Sanitary Engineering, 10, 416–418. 6. Biłozor S., Nawrocki J., Raczyk-Stanisławiak U.,
Świetlik J. 2010. Qualitative characteristics of natu-ral waters [W:] Nawrocki J. (edit.) Water treatment: physical, chemical and biological processes. Part 1. Rev. 2. PWN Scientific Publishing House. Warsaw. 7. Central Laboratory MPWiK SA 2013. Register of
research methods. Cracow.
8. Central Laboratory MPWiK SA 2015. Results of laboratory analyzes of water quality indica-tors made at the Central Laboratory in the years 2007 – 2014. Own research. Cracow.
9. EU Council Directive 98/83/EC of 3 November 1998 on the quality of water intended for human consumption (Dz. U. L 330 of 5.12.1998), (http:// gis.gov.pl/ckfinder/userfiles/files/BW/98_83_ WE.pdf), [access on 17–06–2015].
10. Gamrot B., Kuś K., Malicka K., Ścieranka G. 2001. Influence of technical and operating conditions of the water distribution system on water quality. En-vironmental Pollution Control, 3 (82), 17–20. 11. Haas C. N., Karra S. B. 1984. Kinetics of
waste-water chlorine demand exortion, J. WPCF, 56, 2, 170–173.
12. Jachimowski A. 2016. Factors affecting water qual-ity before treatment. Ecological Engineering, vol. 18, 1, 118–125. DOI: 10.12912/23920629/67003. 13. Januszewska A., Bojanowska I., Ryłko E.,
Miło-sierna K. 2011. Influence of the chemical proper-ties of water on its corrosivity. Water Technology, 3(11), 31–32.
14. Kiéné L., Lu W. Lévi Y. 1998. Relative importance
of the phenomena responsible for chlorine decay in drinking water distribution systems, Wat. Scie. Tech., 38, 6, 219–227.
15. Kowal A. L., Świderska-Bróż M. 2009. Water pu-rification. Theoretical and technological founda-tions, processes and devices. PWN Scientific Pub-lishing House. Warsaw.
16. Kwietniewski M. 2011. Unreliability of water sup-ply and wastewater infrastructure in Poland based on field tests. XXV Scientific-Technical Confer-ence Building Failures. Miedzyzdroje., 127–140. 17. Kwietniewski M., Kowalska B., Wąsowski J.,
Chudzicki J., Kowalski D., Miszta-Kruk K. 2012. Problems of water quality management in distribu-tion systems. Gas, Water and Sanitary Engineering, 3, 117–121.
18. Łomotowski J. 2007. Causes of water quality changes in water supply systems. System Research Institute of Polish Academy of Sciences. Warsaw. 19. Modelska M., Buczyński S. 2007. Application of
factor analysis in hydrochemical research of se-lected Sudety Mts catchments. Geological Review, 55, 4,319–323.
20. Pierścieniak M., Trzcińska N., Słomczyński T, Wą-sowski J. 2009. Problem of secondary contamina-tion of water. Environmental Proteccontamina-tion and Natu-ral Resources, 39, 28–39.
21. Świderska-Bróż M., Wolska M. 2006. Major con-tributors to self-contamination of water in distribution systems. Environmental Pollution Control, 4, 29–34. 22. Świderska-Bróż M., Wolska M. 2005. The
prin-cipal parameters of water quality deterioration in distribution system. Engineering and Protection of Environment, 8, 2, 159–169.
23. Świderska-Bróż M. 2003. Lack of Biological Stability and the Implication it has for Tap Water Quality. Environmental Pollution Control, 4, 7–12. 24. Świderska-Bróż M., Wolska M. 2007. Influence of
hydraulic parameters on water pollution system. Environment Protection Engineering, 33, 4, 5–16. 25. Tchórzowska-Cieślak B. 2010. The risk of failure
of water network. Gas, Water and Sanitary Engine-ering, 3, 38–41.
26. Act of 7 June 2001 on collective water supply and collective sewage disposal (i.e. Dz. U. z 2006 r., No. 123, item 858 with later amendments). (http://isap.sejm.gov.pl/DetailsServlet?id=W DU20010720747), [access on 15–01–2016]. 27. Weber Ł. 2010. Secondary pollution of tap water
with iron. Causes and countermeasures on the ex-ample of the water supply system. Water Techno-logy, 6, 33–37.
28. Rak J. R., Tchórzewska-Cieślak B. 2013. Risks in the operation of collective water supply systems. Seidel-Przywecki. Warsaw.