YouChoose
: A Performance Interface Enabling
Convenient and Efficient QoS Support for
Consolidated Storage Systems
Xuechen Zhang
The ECE Department Wayne State University
Detroit, MI, 48202 Email: [email protected]
Yuhai Xu
The ECE Department Wayne State UniversityDetroit, MI, 48202 Email: [email protected]
Song Jiang
The ECE Department Wayne State UniversityDetroit, MI, 48202 Email: [email protected]
Abstract—Currently the QoS requirements for disk-based storage systems are usually presented in the form of service-level agreement (SLA) to bound I/O measures such as latency and throughput of I/O requests. However, SLA is not an effective performance interface for users to specify their required I/O service quality for two major reasons. First, for users, it is difficult to determine appropriate latency and throughput bounds to ensure their application performance without resource over-provisioning. Second, for storage system administrators, it is a challenge to estimate a user’s real resource demand because the specified SLA measures are not consistently correlated with the user’s resource demand. This makes resource provisioning and scheduling less informative and could greatly reduce system efficiency.
We propose the concept of reference storage system (RSS), which can be a storage system chosen by users and whose performance can be measured off-line and mimicked on-line, as a performance interface between applications and storage servers. By designating an RSS to represent I/O performance requirement, a user can expect the performance received from a shared storage server servicing his I/O workload is not worse than the performance received from the RSS servicing the same workload. The storage system is responsible for implementing the RSS interface. The key enabling techniques are a machine learn-ing model that derives request-specific performance requirements and an RSS-centric scheduling that efficiently allocates resource among requests from different users. The proposed scheme, named as YouChoose, supports the user-chosen performance interface through efficiently implementing and migrating virtual storage devices in a host storage system. Our evaluation based on trace-driven simulations shows thatYouChoose can precisely implement the RSS performance interface, achieve a strong performance assurance and isolation, and improve the efficiency of a consolidated storage system consisting of different types of storage devices.
I. INTRODUCTION
As storage consolidation provides a promising solution to the rising cost in today’s data-centric computing, the IT in-dustry quickly responds by providing all types of architectures of consolidated storages, from the file-level NAS [15] to the block-level SAN [28], from local enterprise storage servers to Amazon’s S3 on-line storage service [1]. Today’s technology is ready to create data centers comprising of tens of large arrays
of different types, multi-petabytes of capacities, and potential tens of GB/s of aggregate bandwidth.
While the technology is ready on the architectural and oper-ational aspects, there is a critical barrier to keep performance-sensitive users from using the service, which is the lack of an effective performance interface through which users can present their goals on quality of I/O service (QoS) and the system can efficiently meet the goals. As an example, Amazon’s cloud computing service (Amazon EC2) [2] allows users to specify a virtual computing system (named asinstance
in EC2) and upload their applications to run in the virtual system. All major aspects of an instance affecting applications’ performance can be clearly specified except I/O performance. For example, in a small instance there are 1.7GB memory, one processor equivalent to a 2007 Intel Xeon, and 160 GB storage. Since storage system are shared among instances, the I/O performance can only be specified with an indicator, eithermoderate or high. This vague QoS specification would deter many QoS-sensitive users from using the service to run their I/O-intensive applications, since it leaves applications’ performance highly unpredictable.
In shared storage systems like Stonehenge [16] and Fa-cade [20], users are allowed to present their QoS requirements in terms of I/O latency and throughput bounds, as part of level agreement (SLA) originally designed for service-level requests to application servers (See Figure 1). However, the adaptation raises a serious issue in the QoS manage-ment for application-level I/O requests to storage servers. As service-level performance of applications running on the application servers, such as throughput of transactions or exe-cution time of a scientific program, can be easily determined according to users’performance expectation, it is very hard, if not impossible, to determine corresponding response time or throughput bounds for the I/O requests issued to the storage server so that the service-level SLA goals are met. This is because many aspects of the I/O service are so dynamic that any static bounds cannot capture the real performance demands on individual requests.
First, I/O requests can be very bursty. Applications may be
c
E-Commerce SLA
(e.g., response time<100ms, throughput>100 trans./s) RSS (e.g., Seagate Barracuda 7200.10 hard drive) E Commerce Server
throughput 100 trans./s) hard drive)
RSS Network TPC server SLA RSS SLA RSS Consolidated storage server Search engine RSS SLA (e.g., turnaround
time < 10 minutes) server
Computing Service subscribers time < 10 minutes) Computing Server
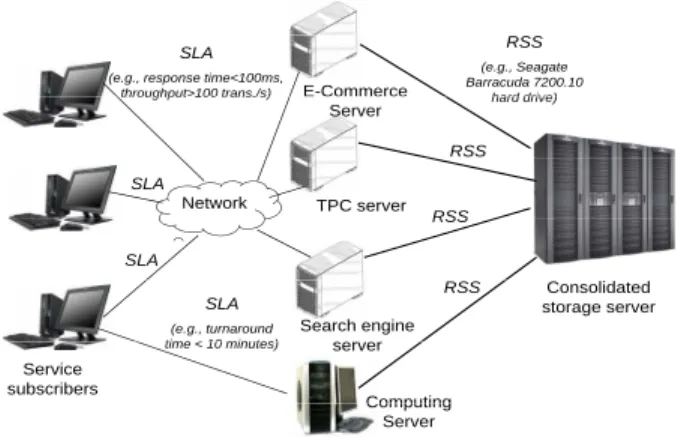
Fig. 1. There are three tiers in a typical system architecture involving
consolidated storage service: service subscribers, application servers, and storage server. While the SLA-like performance interface describing bounds on response time and throughput is suitable between service subscribers and application servers, a different performance interface is needed between application servers and storage server, such as the reference storage system (RSS) proposed in this paper.
designed to aggregate its I/O operations into several dedicated I/O phases, such as phases for data loading or data writing back, in anticipation that I/O system would be more efficient by serving requests in batch. The response time of a request issued in a busy period tends to be much larger than that in a quiet period. This is usually not a performance issue with users, who would also have the experience with their dedicated system. However, if a static response time bound is specified, all requests are treated indiscriminately on the same performance target. It would be unrealistic, for the server to keep response time from growing with the bursty requests considering limited resource in a system. If the performance target is determined based on requests issued in the quiet period, which actually imposes artificially strict latency bound on bursty requests, the resource has to be lavishly provisioned to meet the bound and the I/O service can be prohibitive to users.
Second, requests size can be highly variable. Requests of different sizes should come with different respond time bounds. As a request’s service time can be substantially influenced by its size [29], one fixed bound for all requests is fundamentally inaccurate. Moreover, determination of separate bounds for requests of sizes in different ranges is a tedious work and not flexible. A bandwidth bound, which specifies amount of data accessed in a unit time (MB/s) instead of number of I/O operations in a unit time (IOPS), is not subject to variation of request size. However, if a storage system guarantees the bandwidth bound, application designers would not have the incentive to aggregate small requests into one large request, making storage system’s efficiency being compromised.
Last but not least, the spatial locality of requests can vary. Spatial locality describes the sequentiality of continuously requested data on the storage device. The hard-disk-based stor-age systems are most sensitive to this workload characteristic,
because significant seek time is usually involved in accessing non-sequential data. For the flash-based solid-state disk (SSD), throughput of random write can be significantly lower than that of sequential access. The spatial locality is a highly elusive property that is hard for users to characterize.
If the bounds are determined by always assuming a random access pattern, users have to be conservative in setting the bounds, and the server would also conservatively plan its capability for the worst scenario. If the actual access pattern turns out to be sequential access, the application is likely to only receive performance as low as that with random access when the server resource is tight with high I/O demand. This is against the users’ experience with their dedicated storage systems, that is, I/O performance increases as workload’s spatial locality improves. One consequence of this experience is that users are not motivated to take efforts in optimizing their programs by replacing small and random I/O access with large and sequential access, which definitely causes grave impact on the efficiency of the storage server.
In this paper we propose to use reference storage system
(RSS) as performance interface for users to describe their QoS requirements. When a user creates a virtual storage device (VSD) hosted in a shared system, its performance is associated with an RSS, which can be a user’s dedicated local system, instead of a set of (artificial) bounds on request latency or throughput. A user is then guaranteed to receive I/O service whose quality is at least as good as that on the reference system regardless of instantaneous changes of data request pattern. The proposed scheme is named as YouChoose, as it allows a user to choose his own RSS as performance interface. Meanwhile, the host storage system does need to know the required latency for each of the requests from different users to schedule requests. To this end, YouChoose
trains a machine learning model off-line to mimic the chosen RSS and to on-line predict the latency that the RSS would produce for an incoming request. Relying on the latency,
YouChoose can efficiently maintain a VSD associated with
a pre-chosen RSS to meet its user’s QoS requirement. The architecture ofYouChooseis illustrated in Figure 2.
In summary, we made four contributions in the work.
• We propose a performance interface for users to conve-niently specify their I/O QoS requirements so that they are assured of QoS of their outsourced I/O service at least as good as that on their dedicated reference system. We adopt the machine learning technique to automatically abstract performance characteristics of a reference system for effective implementation of the performance interface.
• While a consolidated storage system is shared by multiple users, we propose a scheduling strategy to reduce per-formance degradation for a user’s virtual storage device (VSD) due to the interference among different VSDs, and to improve the entire system’s utilization.
• Modern storage systems are complex and hybrid,
con-sisting of hard disks, solid-state disks, and other types of devices. We design a migration policy to intelligently map a virtual device of specific QoS requirements to a
physical device of matching performance characteristics for high resource utilization.
• We built a storage system simulator, in which hard disks and solid-state disks are accurately simulated. Our eval-uation shows that YouChoose can precisely implement the RSS performance interface, achieve a higher resource utilization, and improve the efficiency of a consolidated storage system consisting of different types of storage devices. Application server 1 Application server 2 Application server n ….. iSCSI iSCSI FibreChannel Interconnection Fabric Request Streams RSS RSS RSS RSS RSS Performance Interface Interface VSD VSD VSD VSD VSD QoS-aware
controller controller controller
Scheduler
HDD disk arrayy SSD disk arrayy Hybrid disk arrayy y
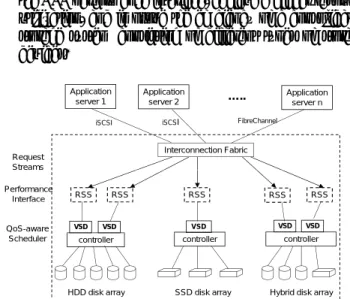
Fig. 2. The consolidated storage system (in the dotted line box) is shared
among multiple application servers. Performance interface is specified via ref-erence storage system (RSS) and quantified on-line using a machine-learning model. Each virtual storage device (VSD) has its performance interface, which is implemented with an efficient QoS-aware scheduler. Decision on VSD migration is made according to characteristics of I/O workloads, RSSs, and storage devices.
The rest of this paper is organized as follows. Section II discusses the related work; Sections III presents the design
of YouChoose; Section IV describes and analyzes experiment
results; and Section V concludes the paper. II. RELATEDWORK
As consolidated storage service promises significant bene-fits, QoS assurance for its users is one of the most critical issues to be addressed and much research work has been focusing on it, including QoS specification, characterization of storage systems’ performance, and QoS-aware scheduling.
A. Research on Performance Interfaces
The commonly used metrics for users to present their QoS requirements are throughput and response time of data access [16], [11]. A serious issue with the use of the simplistic parameters is that service quality can be significantly affected by the characteristics of I/O workloads. To mitigate the issue, researchers have developed I/O workload models to derive performance bounds [8], [30], [33], [35]. As a workload’s characteristics can vary in a large range, constraints have been introduced to guarantee QoS under the constraints. For example, in the pClock scheduling [11], response time of a request is bounded only if the request burstiness (the number of pending requests) and request arrival rate are less than pre-set thresholds. However, the relationship between the imposed
constraints and the guaranteed performance may not reflect the performance expectation from users. To provide flexibility, Cruz et al. introduced the notion of service curves to charac-terize service quality in the networking domain [9], [26], [31], [32]. With a service curve, QoS requirements can be expressed as a function of input traffic rates. Facade [20], a high-end storage system prototype, adopts this performance interface to allow higher response times when I/O request arrival rate increases. However, it is a challenge for users to determine a series of performance bounds, each associated with an I/O rate.
Spatial locality is a unique property for the storage system and even harder than I/O rate to be included in the performance interface. Performance bounds are specified without regard to sequential and random access in most systems [7], [10], [16], [11], [18], [20], [41], [13], [14]. An exception is the Argon storage server [37], in which a client requests a fixed fraction of a server’s capability, which is equivalent to setting perfor-mance bounds aware of spatial locality. However, by binding the QoS requirements proportionally to the host server’s ca-pability, a user cannot flexibly designate a performance model of his choice. Furthermore, to use the method, users need to be aware of the server’s total capability. In contrast, our
YouChoosescheme allows a user to choose any storage system
matching his performance needs as the reference system, which then serves as the performance interface.
B. Research on Characterizing Storage Systems’ Performance
To use a reference system as a performance interface, its performance behaviors must be well characterized to provide performance goals. For this purpose there are three methods, namely, analytic device modeling, simulation, and black-box modeling, to leverage.
Because of its nonlinear, state-dependent behavior, building accurate analytic models for the disk drive is a non-trivial task. In [27], Ruemmler and Wilkes developed analytic disk models that take into account head positioning, platter rotation, and data caching and read-ahead. The model is further fine-tuned by Worthington et al. [38], resulting in the widely used disk simulator, DiskSim [34], which represents the state of the art in disk simulation. DiskSim models almost all performance-relevant components of a disk, including device drivers, buses, controllers, adapters, caches. Compared with simulations, analytic models are much faster. However, they usually cannot capture as many details as simulators. Both approaches require human expertise on the target system. Thus these methods are called white box approach. The internal architectures of today’s storage systems have become more and more complex, and may include proprietary configurations and use of algorithms and optimizations that are not disclosed. Therefore, building an accurate model or simulator using the white-box method cannot be a general solution for defining any given storage system as a reference system. In contrast, the so-called black box approach treats the system as a black box without assuming the knowledge of its internal components or algorithms. In the approach, the training data
set, containing the quantified description of characteristics of input requests and their corresponding responses from the system, are recorded in a table [4], [24], fed into a statistical model [19], or a machine learning model [40], [22]. To predict response to an input, some form of interpolation is required. It is recognized that the accuracy of the method relies on the selection of training data set and design of feature vectors (the set of input characteristics) [19], [40]. In our proposed
YouChoose, we use the machine-learning method to model
the chosen reference storage system by selecting effective training data sets. In addition, the effectiveness ofYouChoose
scheduling depends only on the model accuracy with aggregate performance value for requests issued in a time slot, rather than for individual requests.
C. Research on QoS-Aware Scheduling
Many QoS-aware I/O scheduling policies guarantee I/O ser-vice quality by tagging requests from different request streams with deadlines (or finish times) calculated from users-specified performance bounds and estimated service times [16], [25]. While the service time is heavily dependent on spatial locality in the disk-based storage systems, the locality is usually not included in the performance interface and random access is usually assumed. However, this can cause resource over-provisioning. To fix this problem, Stonehenge [16] allows additional streams to keep joining the system until the system is found to be overloaded. They have to use the trial-and-error method because the performance interface does not contain information of spatial locality and planning of re-source provisioning is difficult. In contrast, VSD proposed in our paper comes with a well-defined performance interface containing each VSD’s resource consumption to enable well-planned scheduling. The resource consumption is also included in the Argon’s interface through setting explicit quanta of disk service time for each stream [37]. However, in a shared environment it is a challenge to know to which stream a service time should be accounted [25].
Consolidated storage systems could achieve a higher ef-ficiency and become more cost effective with data migra-tion. HP AutoRAID [39] balances I/O performance with data redundancy through hierarchical storage system design. It allows data to automatically migrate between a RAID-5 disk array of low speed and a RAID-1 disk array of high speed. Anderson et al. [5] discussed data migration due to optimized storage device configurations, which are obtained by customized analytic performance model. However, users’ QoS requirements are not included in both of the designs. Lu et al. [21] demonstrated that QoS of I/O services can be statistically guaranteed during data migration. However, the QoS requirement is simply presented with latency bound.
Our YouChooseis designed to improve system efficiency by
automating VSD migration among storage devices exhibiting different capabilities with different workloads, without com-promising their QoS requirements.
III. DESIGN OFYouChoose
In this section we will define a performance interface with a reference storage system (RSS) using a machine learning model. We then present the I/O scheduling strategy to ef-ficiently implement the interface. Finally, we will describe a virtual-storage-device (VSD) migration policy to improve storage system efficiency by considering characteristics of both I/O workloads and a hybrid storage system.
A. Defining Reference Systems as Performance Interface
By defining a reference system, we mean the consolidated storage server knows how the system would behave if a request, which is currently sent to the host server, was received by the reference system, or more specifically, the server knows what the request’s service time on the reference system was. As the machine learning model is general enough to predict service time in all types of storage systems, we choose to use the classification and regression tree (CART) machine-learning model [40] to obtain request service time on the reference system, or RSS, for its efficiency and simplicity.
Training
Workload Request Feature Vector (FV) R Workload ST1 FV1 Model 1 3 R1 R2 R3 Reference System ST2 ST3 FV2 FV3 Service Time Construction 3 . . . . . . . . (ST) Trained Storage Model 2 Rn . STn FVn (a) Train a CART model for a reference system 1Generate feature vector (FV) of requestR
1Generate feature vector (FVi) of request Ri 2
3
Measure service time (STi) of request Ri
F d i (FV ST) i t th CART d l 3Feed pairs (FVi, STi) into the CART model
Request Feature Vector 4 ST1 ST2 ST 4 5 R1 R ST3 . . Trained Storage Model 5 R2 R3 STn . . . .
(b) Use the CART model for prediction of service time
Rn
4 Generate feature vector (FVi) of request Ri(to be predicted) 5 The CART model predicts service time (STi ) for Ri
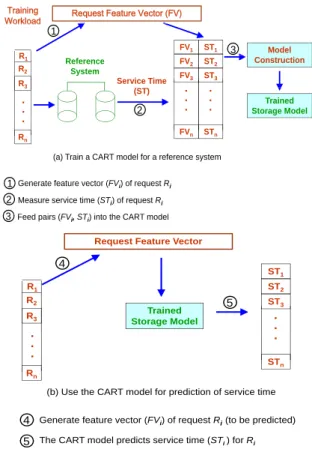
Fig. 3. Basic steps involved in: (a) the training a CART model for a reference system, and (b) using the model to predict per-request service time.
A user may choose a dedicated storage system as his RSS and the system administrator is responsible to profile the system by running representative workloads to obtain the I/O traces including requests and their service times. The I/O traces are used to train a machine-learning model representing the RSS. Figure 3 shows the basic steps involved
in training a model for a reference device and using the model to predict system response time. In the process, a request’s characteristics that affect its service time are abstracted into a set of measures, called feature vector. The vector together with measured service time of the request, as a member of the training data set, is then fed into the model. The measures in the feature vector include request size, on-disk location of requested data, and the gap between the locations of two consecutive requests. Note that number of outstanding requests is not included in the vector, because the model is used to predict request service time, rather than request response time. A trained model will be deployed in the host storage system to on-line predict the service time of a request on the RSS, instead of the time on the host system, by feeding the feature vector of the request into the model.
To allow the trained model to make accurate predictions, the training data set must provide a comprehensive coverage of workload characteristics. To this end, we developed a synthetic I/O request generator producing workloads covering a large spectrum of request size and spatial locality. In addition, we found that using part of real workload presented to the host system to train the model is helpful to improve the accuracy due to existence of self-similarity in a stabilized workload. This is possible if a user’s actual workload is known in advance or if the reference system is still available for profiling to collect training data set after the service is deployed. Because of complexity of storage devices, building a model of high accuracy for each individual request is hard. Fortunately, request-level accuracy is not required for our scheduling, and only accuracy for requests in a time window is needed. This makes it feasible to use the machine-learning method for implementing the RSS interface.
B. Supporting Virtual Storage Devices
When an RSS is chosen and its corresponding CART model is trained and deployed in the host system, a virtual storage device (VSD) is created for the RSS in a disk array and managed together with other VSDs. To allocate the resource to the hosted VSDs according to their QoS requirements, the scheduler needs to keep track of how the requirements are met for each VSD and schedule requests to these VSDs ac-cordingly. To this end,YouChooseuses a multi-clock schedul-ing framework, which sets up N + 1 clocks, including one reference clock (ref clock) for each of the N co-existing VSDs, and the wall clock (wall clock) (see Figure 4(a)). A reference clock of a VSD is advanced in this way: (1) When a VSD’s request arrives at the host system, its service time
(ref service time) on the VSD’s RSS is computed via the
RSS’s trained CART model and the VSD’s clock is advanced by the service time (ref clock += ref service time); (2) When it is the turn for the VSD to be served but the VSD does not have any pending requests, its reference clock is set to be the wall clock time (ref clock =wall clock). Using the clocks, YouChoose can easily monitor whether or not a VSD meets its performance requirement by simply comparing
ref clock and wall clock. The next VSD selected by the
Stream 1 Stream 2 Stream 3
Stream 1 Stream 2 Stream 3
QoS Scheduling Reference Clock 1 Reference Clock 2 Reference Clock 3 W ll Cl k Wall Clock (a) ( ) VSD 1 VSD 2 VSD 3 Slot K+2 Slot K+2 Slot K+1
Requested data spread l i l di k
Slot K
over multiple disks
(b)
Fig. 4. (a) Illustration of theYouChoosescheduling policy that implements the RSS performance interface. Besides the wall clock, each VSD, serving a stream of requests from applications, has its reference clock. A request is represented by a rectangle, whose height indicates the service time of the request on the chosen reference system. Thus, the reference clock tracks received service with respect to the reference system. Note that at a lower level each disk also has its disk scheduler, such as C-SCAN (not depicted). (b) Batching is used to minimize interference among VSDs. Requests to the same VSD are grouped into time slots of fixed size, and the sum of on-RSS service times of requests in a slot is not greater than the slot size. Slots of each VSD are numbered consecutively.
scheduler for service is the one whose reference clock is slower than the wall clock, which indicates the VSD’s perfor-mance has not kept up with that of its RSS. The gaps between the wall clock and each of reference clocks show quality of service for VSDs and tightness of resource provisioning. This framework enables YouChoose to automatically take all the dynamics of workload’s characteristics into account, including spatial locality, I/O rate, and request size, in the assurance of QoS. Furthermore, it does not need to quantify host-system’s physical resources consumed by each VSD in making the scheduling decision, which is a very challenging task [25].
When multiple VSDs are hosted on the same physical system, their interference can be a serious performance barrier. To mitigate the interference, YouChoose batches requests to the same VSD into time slots and schedules requests from the same slot together (see Figure 4(b)). All slots are of the same capacity in seconds, and the sum of the service times
VSD 1 VSD 2 VSD 3 VSD 4
HDD Array A 53% 12% 33% 2%
HDD Array B 10% 54% 30% 6%
SSD Array 8% 68% 16% 8%
TABLE I
AN EXAMPLE RESOURCE-CONSUMPTION MATRIX. IN THE EXAMPLE, THERE ARE FOURVSDS HOSTED ON THREE ARRAYS,INCLUDING TWO
HDDARRAYSAANDBAND ONESSDARRAYC. EACH ROW OF THE
MATRIX LISTS THE PERCENTAGE OF SERVICE TIME FOR ANYVSDON A PARTICULAR DEVICE ARRAY OVER TOTAL SERVICE TIME ON THE ARRAY.
THEREFORE,THE SUM OF THE PERCENTAGES IN A ROW IS100%. THE CHANGE OF PERCENTAGES IN THE MATRIX HINTS ACCESS PATTERNS OF THEVSDS. FOR EXAMPLE, VSD 1CHANGES ITS PERCENTAGE FROM53%
TO8%WHEN IT MOVES FROMHDDARRAYATO THESSDARRAY,
WHICH SHOWS IT’S PROBABLY A RANDOM WORKLOAD. VSD 2CHANGES
ITS PERCENTAGE FROM12%TO68%WHEN IT MOVES FROMHDDARRAY
ATO THESSDARRAYC,WHICH SHOWS IT’S PROBABLY A SEQUENTIAL WORKLOAD AND THE SYSTEM HAS OTHER SIGNIFICANT RANDOMVSDS. IF CURRENTLYVSD 1IS ONHDDARRAYAANDVSD 2IS ONSSD ARRAY,BOTH ARRAYS CAN SIGNIFICANTLY REDUCE THEIR LOADS IF WE
SWITCH THE HOSTS OF THE TWOVSDS. IN CONTRAST, VSD 4IS INSIGNIFICANT IN TERMS OF RESOURCE CONSUMPTION AND SHOULD BE
EXCLUDED FROM MIGRATION AS MIGRATION OF DATA CAN BE EXPENSIVE.
of requests held in a slot cannot exceed a slot’s capacity. Note that these are service times on the reference systems and are obtained from the CART models. Therefore, the RSS performance interface is maintained. In the case where there are too few requests in a slot of a VSD,YouChoosemay move requests from neighboring slots into the slot to improve disk efficiency.
C. Migrating Virtual Storage Devices
The consolidated system usually consists of heterogeneous devices, including arrays of hard drive disks (HDD) and solid-state disks (SSD). Because VSD is created based on a reference system, its actual resource demand is bounded by the capability of the reference system. Thus, a capacity planning is possible to determine the largest number of VSDs that can be co-hosted in a disk array with its known capability without performance violation. However, this is not necessarily translated into efficient use of the storage system, as the efficiency relies on both device and workload characteristics. The goal of VSD migration is to make the host system most efficiently used so as to accommodate as many VSDs as possible. This is achieved through migrating those significant but misplaced VSDs to the device arrays that can most efficiently host the VSDs, if such device arrays are available. A VSD becomes significant when it consumes a relatively large proportion of resources by being associated with a relatively powerful RSS and having a high request-arrival rate. A VSD is misplaced if there exists a device array that can more efficiently host the VSD and is able to make room to host the VSD. Therefore, a significant and misplaced VSD can be identified only when a VSD is deployed and the characteristics of other VSDs and all device arrays are known. To this end, we introduce the resource-consumption matrix.
As we know, all requests to a VSD are packed into the VSD’s slots, whose capacity is determined by the VSD’s RSS (see Figure 4(b)). For each VSD hosted on a shared storage system, we pick the same set of contiguous slots to form a slot group. The requests in a VSD’s slot group are used as a sample of the VSD’s characteristics including arrival rate, access pattern, and RSS requirements. Moreover, we train the CART models for each device array using the synthetic training data set described in Section III.A, and use the models to represent the arrays. On each device array, we feed the requests in each VSD’s slot group into the array’s model to obtain the service time for the VSD. We then calculate the percentage of a VSD’s service time on an array over total service time of all VSDs on the array, and write the percentage in the cell of the matrix for the VSD on the array (see an example in Table I). The percentage indicates the relative resource consumption for a VSD, or its significance, on an array. There can be two scenarios where the percentage for a VSD becomes smaller when its host is changed from array A to array B. In the first scenario, the VSD’s service time is reduced. For example, when the VSD has mostly random requests, array A is an HDD array, and array B is an SSD array. In the second scenario, other VSDs’ service times are increased. For example, when the VSD has mostly sequential requests, and some of other VSDs have random requests, array A is an SSD array, and array B is an HDD array. A significant reduction of the percentage indicates an opportunity to improve efficiency of the shared storage system. Migration manager ofYouChooseruns in the controller of the shared storage system to periodically take samples of VSD slots and update the matrix by executing the CART models. The manager monitors the matrix to identify a VSD whose resource consumption percentage can be reduced by more than a threshold value if it is migrated from its currently source device array to a destination array. If a VSD is consistently identified, the manager will check whether the destination array has spare capacity to hold the VSD or has one or multiple VSDs that can reduce their percentages by more than the threshold if they are migrated to the source array. If yes, these migration operations are carried out, which improves the system efficiency and allows more VSDs to be hosted with their QoS requirements met.
IV. PERFORMANCEEVALUATION
We built a trace-driven simulator to evaluate the perfor-mance of theYouChoosescheme. The simulator is designed to simulate consolidated storage system consisting of heteroge-neous devices, including arrays of hard drive disks and arrays of solid state disks. Each array can be configured to have different types of disks, number of disks, array organizations (RAID 1 vs RAID 5), and data striping patterns. The archi-tecture of the simulator is shown in Figure 2. The simulated consolidated storage system is shared by multiple application servers. I/O workloads from the applications are viewed as I/O request streams to different VSDs. Each VSD has its own RSS interface, which is converted into latency requirements
o r (%) ive Err o Re la ti Time (Seconds) (a) o r (%) ive Err o Re la ti Time (Seconds) (b) o r (%) ive Err o Re la ti Time (Seconds) (c)
Fig. 5. Relative errors of request service times with different window sizes.
on I/O requests by the trained CART models. Our simulator integrates the widely used DiskSim [34] to simulate the hard disk. DiskSim faithfully captures many details of a hard drive and has demonstrated a very high accuracy with validated hard disks. In the experiments, we simulated two validated hard disk models: QUANTUM TORNADO with 10025RPMs and an average seek time of 1.245ms (hereafter referred to as the fast disk) and SEAGATE ST32171W with 7200RPMs and an average seek time of 1.943ms(hereafter referred to as the slow disk). In addition, we patch the DiskSim software with a flash translation layer [3] implementing the DFTL page-level mapping scheme [12] to simulate the solid-state disk, which has a read speed of 32µs/page and a write speed of 101µs/page. For a disk array, the striping unit size is 4KB. The simulator has components to receive and enqueue requests from multiple streams and dispatch them to their respective VSDs. A centralized manager in the frontend controller makes decisions on VSD migrations.
The simulator is driven by both synthetic and real-world traces. The ratio of numbers of read requests and write requests is 2 : 1 in the synthetic traces. Size of each request is 4KB. To generate traces of various spatial locality, we adjust the probability with which the data requested in any two consecu-tive requests are contiguous and use the probability to quantify the spatial locality. Thus, a 0% spatial locality indicates fully random requests, in which none of two consecutive requests are for adjacent data, and 100% spatial locality indicates that the entire trace consists a sequence of requests for fully sequential data. In addition to the synthetic traces, we select four real-world traces. Three of them are widely used ones
(OpenMail [17], WebSearch [23]), and Financial [23]). The
fourth one (VideoStreaming) was collected when we continu-ously played movies in a local workstation. Trace OpenMail
was collected on a production e-mail system running the HP OpenMail application. Both traces WebSearch and Financial
are made available by the Storage Performance Council (SPC). Among them, WebSearch is collected from a popular search engine, and Financialis collected when an OLTP application runs in a financial institute. Except VideoStreaming, all the real-world traces contain mostly random requests. Among them,OpenMailandWebSearchare read dominant and
Finan-cial is write dominant. VideoStreamingcontains almost fully sequential reads.
In the following, we will present a series of experiments to evaluate the accuracy of implementing the RSS interface using the CART model, and the effectiveness of YouChoose
to meet its design goals.
A. Accuracy of the RSS Interface
To test how accurately a trained machine-learning CART model can represent an RSS chosen by YouChoose’s users as performance interface, we choose a RAID-0 disk array consisting of three slow disks as RSS. To train a CART model for the disk array, we generate a synthetic trace covering a full spectrum of spatial locality. Every synthetic trace consists of 10,000 mixed I/O requests of reads and writes. In addition, we randomly choose a segment of trace (5,000 requests) from the actual workload on the RSS’s VSD (WebSearch in this experiment). These traces are replayed on the disk array and the results are used to train the model. We then run the model with theWebSearchtrace (excluding the segment that has been used for the training purpose) and compare the service time of each request predicted by the model and that given by the RSS. The request’s relative error, which is the ratio of the absolute error between these two times and service time given by the RSS, is shown in Figure 5 (a).
The average relative error for all the requests is 24%, which is substantial but is within the range we have expected considering the generality of the model method. Fortunately the errors are roughly evenly distributed in the negative and positive sides in the graph. It is noted that it is the accuracy of the sum of the predicted service times for all requests placed in a VSD’s time slot that determines the accuracy of the RSS interface, rather than the accuracy for individual requests. For this reason, we calculate the window-wide relative error, which is the ratio of sum of service times predicted by the model and that given by the RSS, respectively, for all requests within a time window. Figure 5 (b) and (c) show the window-wide relative errors for window sizes of 0.04s and 0.08s, respectively. Apparently, as we increase the window size, the relative error is improved. When the window size is 0.08s, more than 85% of the relative errors are smaller than 15%.
0 100 200 300 400 500 0 20 40 60 80 100 Throughput (IOPS) Time (Seconds) (a) Spatial Locality (100%) Spatial Locality (75%) Spatial Locality (50%) Spatial Locality (25%) Spatial Locality (0%) 0 100 200 300 400 500 0 20 40 60 80 100 Throughput (IOPS) Time (Seconds) (b) Spatial Locality (100%) Spatial Locality (75%) Spatial Locality (50%) Spatial Locality (25%) Spatial Locality (0%) 0 100 200 300 400 500 0 20 40 60 80 100 Throughput (IOPS) Time (Seconds) (c) Spatial Locality (100%) Spatial Locality (75%) Spatial Locality (50%) Spatial Locality (25%) Spatial Locality (0%)
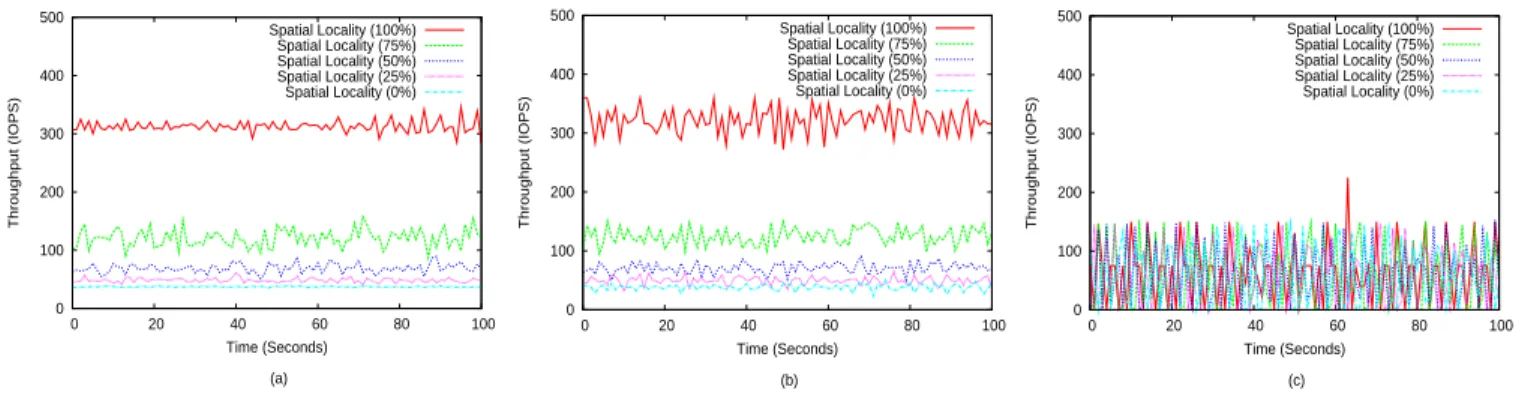
Fig. 6. Illustration of impacts of different spatial localities on the observed throughput in different scheduling policies. We use five synthetic workloads covering a full spectrum of spatial locality from 0% (fully random) to 100% (fully sequential) with 25% increment. (a) Throughput of the five workloads, each of which runs exclusively on the reference system; (b) Throughput of five VSDs, each associated with the same RSS as performance interface and
receiving one of the workloads. The scheduling policy isYouChoose. (c) Throughput of the five workloads that use the same throughput bound (100 IOPS)
as performance interface, The scheduling policy isVirtualClock.
In the aforementioned model training, we used a segment of real workload trace to allow the model to be more customized to a particular type of workload for higher accuracy. We expect that in most cases a segment of sample workload is available when a user chooses his RSS. However, when the sample trace is not available, or the workload is too dynamic to select a representative segment of trace, the model accuracy would be reduced. To investigate the issue, we train a CART model using only the synthetic traces and compare the CDF curves of window-wide relative errors of the models with and without using the sample workload (time window size of 0.08s). As shown in Figure 7, a representative sample of real workload does considerably improve the accuracy of the model. Meanwhile, even if the sample workload is not used for model training, the accuracy of the model is still acceptable with 80% of the errors less than 30%. In the following experiments, we use relatively small samples of actual workloads for model training.
Fig. 7. CDF curves of window-wide relative errors. The models are trained
either using only synthetic traces or using both synthetic traces and sample of actual workloads.
B. Spatial-Locality-Aware Performance Assurance
An important property of theYouChoosescheduling strategy is its built-in awareness of workloads’ spatial locality. That is, its scheduling decision is not made simply according to number of requests. Instead, it also accounts for cost of serving a request, which is mainly determined by the workload’s spatial locality. To evaluate the effectiveness of the scheduling strategy, we set up five VSDs on one host RAID-0 disk array consisting of eight fast disks. All VSDs are associated with the same RSS interface, a RAID-0 disk array consisting of two slow disks. We then feed five synthetic traces into the five VSDs, respectively. The traces uses 4KB requests, covering a full spectrum of spatial locality from 0% (fully random) to 100% (fully sequential) with 25% increment. All requests arrive quickly enough to saturate the disks.
Figure 6 (a) shows the throughput of the five workloads, each on its own dedicated reference storage system. Appar-ently, the observed throughput is correlated to the workload’s spatial locality – a more sequential access pattern produces a higher throughput. When the five workloads are placed on the five VSDs, respectively, on one host system, their throughputs are still correlated to their spatial locality, and each workload’s throughput is close to their counterpart in the dedicated RSS system as the host system is sufficiently power-ful (See Figure 6(b)). This result indicates that the scheduling strategy ofYouChoosefaithfully implements the performance interface specified with a chosen RSS, independent of spatial locality. For comparison, we useVirtualClock[9], the schedul-ing algorithm from which many storage policies are derived from [16], [11], to implement an SLA-like QoS interface. Each of the five workloads requires the same 100-IOPS throughput bound. Figure 6(c) shows the throughput of the workloads with the throughput bound. We can see that each of the workloads receives almost the same throughput but none of them consistently meets its QoS requirement. The same throughput received by each workload does not indicate that the host’s resource is equally provisioned to the workloads. In fact, the random ones receive much more service than the
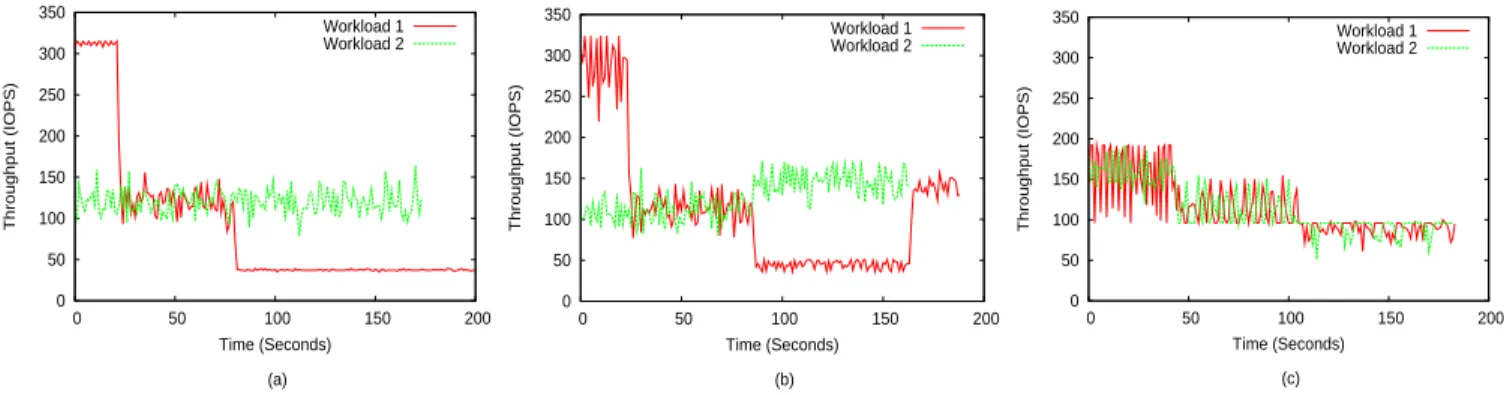
0 50 100 150 200 250 300 350 0 50 100 150 200 Throughput (IOPS) Time (Seconds) (a) Workload 1 Workload 2 0 50 100 150 200 250 300 350 0 50 100 150 200 Throughput (IOPS) Time (Seconds) (b) Workload 1 Workload 2 0 50 100 150 200 250 300 350 0 50 100 150 200 Throughput (IOPS) Time (Seconds) (c) Workload 1 Workload 2
Fig. 8. Throughput of two synthetic workloads. Workload 1 has three periods, each with a differing spatial locality (100%, 75%, and 0%). Workload 2 has
a uniform spatial locality (75%). (a) Each workload exclusively runs on the RSS system. (b) Each workload runs on its VSD. The two VSDs are co-hosted
on a host storage system and are associated with the same RSS. The scheduling policy isYouChoose. (c) The two workloads are co-hosted on a host storage
system and use the throughput-bound performance interface. The bound is 100 IOPS for both workloads. The scheduling policy isVirtualClock.
sequential ones by maintaining an equalized throughput. When the same QoS bound is requested for the workloads, it is usually intended that they are going to be fairly treated by the scheduler in terms of the amount of received service. If this was taken accounted of, at least the sequential workloads should have had their throughput bound met. In contrast, as the workloads specify the same RSS performance interface,
YouChoosedoes equally provide services to them. In addition,
we observe that the throughput of a workload in Figure 6(c) varies more greatly than that in Figure 6(b). The reason why
YouChoosecan reduce the variation is that it packs more
low-cost sequential requests in a VSD’s slot than random requests to ensure that each slot is of the same size. However, if the objective is to meet the throughput bound, each slot has the same number of requests, and the actual size of slot holding random requests can be much larger than that for sequential requests. While requests are scheduled in a slot-by-slot fashion to minimize overhead, the variation of the slot size causes the large throughput variation, which is usually undesirable.
C. Performance Isolation
Performance isolation is an important design objective for a policy scheduling requests from different users with QoS requirements. For YouChoose, this means workload on one VSD should not interfere with other VSDs. Specifically, the performance requirement of the workload on one VSD should not be violated because of the change of access pattern in the workloads on other VSDs sharing the same host system. To evaluate the effectiveness of YouChoose on this aspect, we generate two synthetic traces. One of them (Workload 1) has three segments of requests, each with a differing spatial locality (100%, 75%, and 0%), running on one VSD; the other one (Workload 2) has 75% spatial locality and runs on another VSD. These two VSDs are associated with the same RSS, a RAID-0 disk array composed of two slow disks. A RAID-0 disk array of three fast disks is employed to host these two VSDs.
Figure 8 (a) shows throughput of the two synthetic work-loads running on their respective dedicated reference systems.
As shown in Figure 8(b), with the YouChoose scheme, the trend of throughput curves of the two workloads is similar to that in their dedicated runs on the RSS. When Workload 1 reduces its spatial locality from 100% to 75%, its resource demand would significantly increase if the same throughput was to be maintained, probably resulting in reduced resource provisioning to Workload 2. However, YouChoosebounds re-source allocation to a VSD with its associated RSS regardless workloads’ spatial locality, when the resource is competed by multiple VSDs. Therefore, we see Workload 1’s throughput is accordingly reduced to 112 IOPS at the 28th second, and further reduced to 39 IOPS at the 81th second when its spatial locality keeps reducing to 0%. In the meantime, the throughput of Workload 2 is only insignificantly affected, showing the increased demand from Workload 1 does not cause the loss of resource allocated to Workload 2. Of course, when Workload 2 comes to its end, the host can use the released resource to serve Workload 1 at the 165th second. Figure 8(c) shows the throughput when throughput-bound QoS requirement is required. We can see that the throughput of Workload 2 is accordingly reduced whenever Workload 1 reduces its spatial locality and increases its resource demand. To keep the two workloads to have the same throughput at any circumstance, the scheduler is hard to maintain performance isolation when the resource is constrained.
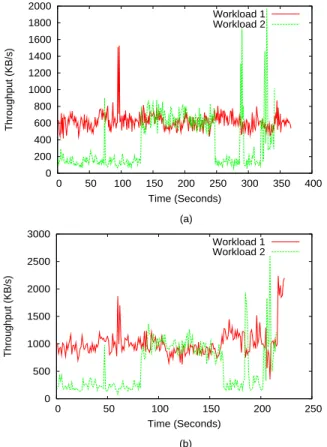
To observe howYouChoosewould perform with real-world workloads, we run a segment of WebSearch trace (referred to as Workload 1) on VSD 1, and initially run a segment
of OpenMail trace on VSD 2, followed by a segment of
another WebSearch trace and a segment of Financial trace (referred to as Workload 2). We change the component traces of the Workload 2 to show how differing spatial locality and arrival rate would affect the throughput. Figure 9 (a) shows throughput of the two workloads, each running on its dedicated RSS. When Workload 2 changes from the OpenMailtrace to
the WebSearch trace, the throughput increases due to
Web-Search’s higher spatial locality. When the trace further changes
toFinancial, the throughput decreases because of the reduced
VSD1 VSD2 VSD3 VSD4 VSD5 VSD6 VSD7
HDD Array A 7.6%* 7.6%* 7.6% 31.0% 7.6% 7.6% 31.0%*
HDD Array B 8.4% 8.4% 8.4% 29.0% 8.4%* 8.4%* 8.4%
SSD Array 14.2% 14.2% 14.2%* 14.5%* 14.2% 14.2% 14.5%
TABLE II
THE RESOURCE-CONSUMPTION MATRIX FOR A HYBRID HOST STORAGE SYSTEM CONSISTING OF THREE DISK ARRAYS(TWOHDDARRAYSAANDB AND ONESSDARRAYC). SEVENVSDS ARE HOSTED IN THE SYSTEM. AMONG THEM, VSD 4ANDVSD 7HAVEWebSearchAS THEIR WORKLOADS,THE
OTHERVSDS HAVEVideoStreamingAS THEIR WORKLOADS. THE ASTERISK INDICATES THE DISK ARRAY ON WHICH AVSDIS HOSTED.
0 200 400 600 800 1000 1200 1400 1600 1800 2000 0 50 100 150 200 250 300 350 400 Throughput (KB/s) Time (Seconds) (a) Workload 1 Workload 2 0 500 1000 1500 2000 2500 3000 0 50 100 150 200 250 Throughput (KB/s) Time (Seconds) (b) Workload 1 Workload 2
Fig. 9. Throughput of two real-world workloads on the dedicated RSS
system (a) and on the host system (b). Workload 1 consistently uses the
WebSearch trace. Workload 2 includes traces OpenMail, WebSearch, and
Financial, running in a one-after-one manner in this order.
(b) shows throughput of the two workloads co-hosted on the host disk array. We can find that the trends of two VSDs’ throughput curves are similar to their counterparts in Figure 9 (a). One difference between them is that the throughput on the host system is higher than that on the dedicated RSS, because the system has extra capability to provide the VSDs with more services than they require. For their throughput improvements, we can see that the extra capability is allocated to the two workloads in proportion to their RSS capability. In this example, both VSDs use the same RSS. However, Workload 1 has a higher spatial locality, and thus it receives a larger throughput increase. Figure 9 (b) clearly shows that the throughput of Workload 1 is insignificantly affected by the changes of spatial locality and arrival rate. In particular, when
Workload 2 runs into theFinancialtrace with a much reduced arrival rate, it cannot fully use the reserved RSS capability and the released capability helps improve VSD-1’s throughput.
D. Efficiency of Multi-array Host System
A consolidated system may consist of hybrid storage devices like HDD and flash-based SSD. In this section, we evaluate the impact of VSD migration on the efficiency of the host systems. We configure three disk arrays: an HDD array of four fast disks (HDD array A), another HDD array of six fast disks (HDD array B), and an SSD array of six solid-state disks (SSD array). To make the experiment manageable, we let all VSDs use the same RSS, an array of two slow disks, and only two traces,VideoStreamingandWebSearch, are used to form workloads. These two traces represent sequential and random access patterns, respectively. For a number of VSDs to be hosted in the hybrid system, we set a sequentiality factor to control the number of VSDs using VideoStreaming
as their workload. The factor is defined as the ratio between the number of VSDs receiving the VideoStreamingworkload and the total number of VSDs in the system. For example, if we have ten VSDs with a factor of 0.7, there are seven VSDs receiving sequential requests from VideoStreaming, and the rest receiving random requests fromWebSearch. Furthermore, we assume that initially the VSDs on any disk array take their workloads from the two traces in a proportion consistent with the factor. We stress the host system by keeping adding VSDs onto it until no spare capability in any array is available. VSDs are initially placed on the disk array with the largest spare capability. In the process, the pre-set sequentiality factor is maintained for all the VSDs in the system, and is also maintained for the VSDs on disk arrays when theYouChoose
migration policy is disabled.
When the YouChoose migration policy is in effect, a resource-consumption matrix is maintained to track how ef-ficiently a VSD’s hosted on a disk array. Table II shows the matrix when there are seven VSDs in the system and the factor is 0.7. We use 10% as the threshold value for making migration decision. The table shows that VSD 7 is currently on HDD array A with a service-time percentage of 31.0%, and a migration to the SSD array can reduce the percentage to 14.5%. The migration will be carried out as the percentage is reduced by 16.5%, larger the 10% threshold. As the SSD array still has spare capability, none of its currently hosted VSDs needs to be migrated out.
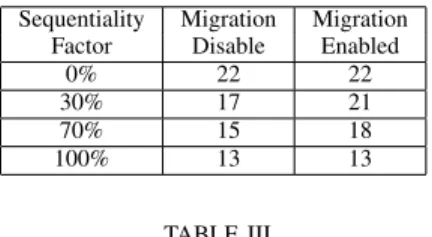
Sequentiality Migration Migration
Factor Disable Enabled
0% 22 22
30% 17 21
70% 15 18
100% 13 13
TABLE III
ACOMPARISON OF THE LARGEST NUMBER OFVSDS A HYBRID STORAGE
SYSTEM CAN HOLD WITHOUT PERFORMANCE VIOLATION WHEN THE
YouChooseMIGRATION POLICY IS DISABLED OR ENABLED.
Table III shows the largest number of VSDs that can be held in the system without performance violation with the migration policy enabled or disabled at four different sequentiality factor values. In the table, we see that as the factor value is 0 or 1, i.e., the VSDs all with random workload or all with sequential workload, migration does not make a difference. Actually the migration is not activated because it cannot improve system efficiency. It is observed that the more random-workload VSDs there are, the larger number of VSDs can be accommodated in the system. This is because the chosen RSS is a hard-disk based array, which is inefficient in serving random work-load. While a flash-based SSD array exhibits only moderate performance advantage over the HDD array with sequential workload, it exhibits a much better performance than the HDD array with random workload. In addition, the existence of random workload and SSD arrays allow the migration strategy to identify opportunity for efficiency improvement through migrating random workload to the SSD array and moving sequential workload out of the SSD array. With the factor values of 0.3 and 0.7, 24% and 20% more VSDs, respectively, can be held in the system. Apparently, in a real prototyping of the design, a tradeoff must be made between the improved efficiency and the cost of VSD migration. The tradeoff can be implemented by adjusting the threshold value for activating migration.
V. CONCLUSIONS
In this paper, we propose theYouChoosescheme to support using user-chosen storage system (RSS) as a performance interface for I/O requests. Compared with traditional interfaces like throughput and latency bounds, RSS provides a highly effective method for users to specify I/O performance require-ment and for system administrators to cap a user’s resource consumption and to efficiently schedule resource. Note that
YouChoose can accommodate a best-effort VSD.
Further-more, the performance interface with fixed latency/throughout bounds is only a special case of the RSS interface, in which the CART model generates a constant service time as the performance requirement.
By leveraging machine-learning technique,YouChoosedoes not need to explicit consider many dynamics in the service of I/O requests, such as spatial locality and arrival rate, that are usually hard to be accounted in the designs. The RSS
interface is efficiently supported with a multi-clock scheduling framework and an efficiency-improvement migration strategy. Our experiment evaluation using synthetic and real-world traces shows that YouChoose can faithfully implement QoS requirement specified with the RSS interface and provide strong performance isolations. In addition, the VSD migration
in YouChoose can increase system efficiency by matching
characteristics of storage devices and workloads.
ACKNOWLEDGMENTS
We thank the anonymous reviewers for their constructive comments that helped us to improve the paper. This research is supported by U.S. NSF CAREER award CCF-0845711 and CRI-0708232.
REFERENCES
[1] Amazon Simple Storage Service (Amazon S3),
http://aws.amazon.com/s3/.
[2] Amazon Elastic Compute Cloud (Amazon EC2),
http://aws.amazon.com/ec2/.
[3] A simulator for various FTL schemes, PSU Computer Systems Lab,
http://csl.cse.psu.edu/?q=node/322.
[4] E. Anderson, “Simple table-based modeling of storage devices”, In
Technical Report HPL-SSP-2001-04, HP Laboratories, 2001.
[5] E. Anderson, M. Hobbs, K. Keeton, S. Spence, M. Uysal, and A. Veitch,
“Hippodrome: running circles around storage administration”, InProc.
of the USENIX Conference on File and Storage Technologies (FAST ’02), 2002.
[6] M. Bhadkamkar, J. Guerra, L. Useche, S. Burnnett, J. Liptak, R. Rangaswami, and V. Hristidis, “BORG:block-reorganization for
self-optimizing storage systems”, In Proc. of the USENIX Conference on
File and Storage Technologies (FAST ’09), 2009.
[7] J. Bruno, J. Brustoloni, E. Gabber, B. Ozden, and A. Silberschatz, “Disk
scheduling with quality of service guarantees”, In Proc. of the IEEE
International Conference on Multimedia Computing and Systems, 1999. [8] M. Calzarossa and G. Serazzi, “Workload characterization”, In
Proceed-ings of the IEEE, 81(8), 1993.
[9] R. Cruz, “Quality of service guarantees in virtual circuit switched
networks”, In IEEE Journal on Selected Areas in Communications,
13(6), 1995.
[10] D. Chambliss, G. Alvarez, P. Pandey, D. Jadav, J. Xu, R. Menon, and T. Lee, “Performance virtualization for large-scale storage systems”, In
Symposium on Reliable Distributed systems, 2003.
[11] A. Gulati, A. Merchant, and P. Varman, “pClock: an arrival curve based
approach for QoS guarantees in shared systems”, InProc. of the 2007
ACM SIGMETRICS Conference, 2007.
[12] A. Gupta, Y. Kim, B. Urgaonkar, “DFTL:A flash translation layer employing demand-based selective caching of page-level address
map-pings”, InProc. of ASPLOS’09, 2009.
[13] A. Gulati, I. Ahmad, C. A. Waldspurger. PARDA: Proportional
Alloca-tion of Resources for Distributed Storage Access. InProc. of the 8th
USENIX Conference on File and Storage Technologies (FAST), 2009. [14] A. Gulati, A. Merchant, and P. Varman. mClock: Handling Throughput
Variability for Hypervisor IO Scheduling. InProc. of the 9th USENIX
Symposium on Operating System Design and Implementation, 2010. [15] G. Gibson and R. Meter, “Network Attached Atorage Architecture”,
Communications of the ACM, 43(11), 2000.
[16] L. Huang, G. Peng, and T. Chiueh, “Multi-Dimensional Storage
Virtu-alization”, InProc. of 2004 ACM SIGMETRICS Conference, 2004.
[17] Hewlett-Packard Company, Palo Alto, CA. “OpenMail technical refer-ence guide”, 2.0 edition, 2001.
[18] W. Jin, J. Chase, and J. Kaur, “Interposed proportional sharing for
a storage service utility”, In Proc. of the 2007 ACM SIGMETRICS
Conference, 2007.
[19] T. Kelly, I. Cohen, M. Goldszmidt, and K. Keeton, “Inducing models of
black-box storage arrays”, InTechnical Report HPL-SSP-2004-108, HP
[20] C. Lumb, A. Merchant, and G. Alvarezg, “Facade: virtual storage
devices with performance guaratees”, InProc. of the 2003 USENIX
Annual Technical Conference, 2003.
[21] C. Lu, G. Alvarez, and J. Wilkes, “Aqueduct: Online data migration
with performance guarantees”, InProc. of the Conference on File and
Storage Technologies (FAST ’02), 2002.
[22] M. Mesnier, M. Wachs, R. Sambasivan, A. Zheng, and G. Ganger, “Mod-eling the relative fitness of storage”, InProc. of the ACM SIGMETRICS Conference, 2007.
[23] OLTP Application and Search Engine I/O, UMASS Trace Repository,
http://traces.cs.umass.edu/index.php/Storage/Storage.
[24] F. Popovici, A. Arpaci-Dusseau, and R. Arpaci-Dusseau, “Robust,
portable i/o scheduling with the disk mimic”, In Proc. of the 2003
USENIX Annual Technical Conference, 2003.
[25] G. Peng and T. Chiueh, “Availability and fairness support for storage
QoS guarantee”, InProc. of 2008 IEEE ICDCS Conference, 2008.
[26] S. Recker, W. Geisselhardt, and I. Wolff, “Service curve based routing subject to deterministic QoS constraints”, InProc. of the 10th Interna-tional Conference on Telecommunications, 2003.
[27] C. Ruemmler and J. Wilkes, “An introduction to disk drive modeling”, InIEEE Computer, 27(3), 1994.
[28] Storage Area Network, http://en.wikipedia.org/wiki/
Stor-age area network.
[29] S. Schlosser, J. Schindler, S. Papadomanolakis, M. Shao, A. Ailamaki, C. Faloutsos, and G. Ganger, “On multidimensional data and modern
disks”, In Proc. of the 4th USENIX Conference on File and Storage
Technologies (Fast ’05), 2005.
[30] E. Smirni and D. Reed, “Workload characterization of input/output inten-sive parallel applications”, InProc. of the 9th International Conference on Computer Performance Evaluation: Modeling and Techniques and Tools, 1997.
[31] H. Sariowan, R. Cruz, and G. Polyzos, “Scheduling for quality of service guarantees via service curves”, InProc. of the 4th International Conference on Computer Communications and Networks, 1995. [32] I. Stoica, H. Zhang, and T. Ng, “A hierarchical fair service curve
algorithm for link-sharing, real-time and priority services”, InProc. of the ACM SIGCOMM ’97, 1997.
[33] N. Tran and D. Reed, “Arima time series modeling and forecasting for adaptive I/O prefetching”, InProc. of the 15th international conference on Supercomputing, 2001.
[34] The DiskSim simulation environment (version 3.0),
http://www.pdl.cmu.edu/DiskSim/.
[35] S. Uttamchandani, L. Yin, G. Alvarez, J. Palmer, and G. Agha, “Chamelon: a self-evolving, fully-adaptive resource arbitrator for storage
systems.”, In Proc. of the annual conference on USENIX Annual
Technical Conference, 2005.
[36] M. Wang, K. Au, A. Ailamaki, A. Brockwell, C. Faloutsos, and G. Ganger, “Storage device performance prediction with cart models”, In
Proc. of the 12th MASCOTS Conference, 2004.
[37] M. Wachs, M. Abd-El-Malek, E. Thereska, and G. Ganger, “Argon: performance insulation for shared storage servers”, InProc. of the 6th USENIX Conference on File and Storage Technologies (FAST ’07), 2007. [38] B. Worthington, G. Ganger, and Y. Patt, “Scheduling algorithm for
modern disk drives”, InProc. of the ACM SIGMETRICS Conference,
1994.
[39] J. Wilkes, R. Golding, C. Staelin, and T. Sullivan, “The HP AutoRAID
hierarchical storage system”, InACM Transactions on Computer
Sys-tems, 14(1), 1996.
[40] M. Wang, K. Au, A. Ailamaki, A. Brockwell, C. Faloutsos, and G.Ganger, “Storage device performance prediction with cart models”, InProc. of the 12th MASCOTS Conference, 2004.
[41] J. Zhang, A. Sivasubramaniam, Q. Wang, A. Riska, and E. Riedel, “Storage performance virtualization via throughput and latency control”, InACM Transanction on Storage, 2(3), 2006.