Segmenting Online Customers Based on their Lifetime Value and RFM Model by Data Mining Techniques
Azarnoosh Ansari, PhD. Assistant Professor of Management Department, University of Isfahan, Iran
Shermineh Ghalamkari PhD. Student of Management,
University of Isfahan
Abstract
Nowadays, marketing managers are more concerned with identifying and understanding customer behavior in the online space. Since the customers in online space are not visible, it is much essential to have more information about them to provide better services. Customer segmentation is one way to improve the customer problems in an online space. Identifying characteristics of customers and optimal resource allocation to them according to their value to the company is one of the major concerns in the field of customer relationship management and determining factors in E-business success. The purpose of this study is clustering customers online of a mobile sales website based on their lifetime value and RFM model. At the proposed framework in this study after determining the values of RFM model include recently, frequency and monetary of purchase and weighting them using Shannon entropy, a self-organizing map is applied to the segmentation of customers. The customers are categorized into four main segments and characteristics of customers online in each of the segments are identified. Mobile sales website customers are identified by segmenting customers in terms of the pyramid of customer lifetime value. Finally, suggestions are proposed to improve customer relationship management system.
Keywords: Shannon entropy, customer lifetime value, online space, RFM Model
Introduction
Nowadays customer needs and their purchasing patterns have been changed
significantly, therefore, in order to satisfy the needs of various customers, implementing
and using a variety of customer-oriented- marketing -strategies for competitive advantage
are inclined )Ko, Kim, Kim, & Woo, 2008). Developed relationships with customers can lead into the formation of loyal customers, maintaining them, and ultimately profitable.
Therefore, to address the issue of accepting customers relationship management (CRM) is one of the priorities of each business. Organizations must learn how to focus on their
product or service to the customer to focus on their movements. Their customers as an asset
competitive world, organizations have to make it up to the customer and his satisfaction
rather than mass production, are important. Organizations have recognized that customers
are their most important assets, Therefore relationships with customers are viewed as useful
interactions that need to be properly managed (Plakoyiannaki, 2005). Identify customers
involve analysis of target customers and to classify customers that leads into profitable groups of customers are based on their characteristics are. One of the most widely used
approaches to predict customers' behavior in the debate, is clustering. Clustering or
segmenting customers include all customers are divided into major groups that are more
similar to one another (Ngai, Xiu, & Chau, 2009).
This study combines a Multi -Criteria -Decision -Method and a data mining
framework for clustering mobile internet customers' behavior prediction are provided for
the field to identify key customers, choose the right marketing strategies and optimal
allocation of resources according to the characteristics of each customer segment in order to
improve the performance of customer relationship management system that can be
provided. The proposed model is based on customer lifetime value and the RFM model.
RFM model is used to extract customer buying behavior patterns and three factors recency
shopping(R), purchase frequency(F) and monetary value of purchases(M) for each customer is considered. The special feature of this study compared with previous studies
can be combined by customer segmentation based on customer lifetime value has pointed
as pyramid, also in this study, to avoid weighting the experts' opinions in parameters model,
the method of Shannon's entropy has been used and according to the intelligence and speed
of neural networks in data analysis, the self-organizing neural network is used for
clustering. Thus there are rules that can be used for clustering clients undiscovered.
The Research Necessity
In recent years competition among mobile online sellers in order to attract new
customers, retain existing customers and making them loyal have been shaped. For this
reason it is essential that mobile online sellers, like other organizations to know their
customers well, design their related processes and the understanding of the relationship with customers to design and implement appropriate communication system. Considering
the importance of customers' relationship management in attracting and retaining customers
in the online environment, the main question is how to identify key customers? Customer
lifetime value, a concept that is very helpful from this point of view. Value of this concept
is that the customer provides to the organization during the course of their life. Many
organizations collect and store large amounts of data about their customers but their
inability to discover hidden and valuable knowledge from this data since the data are not
transformed into knowledge and data storage is wasted. Business owners desire to extract
information to gain more profit. One area that is growing rapidly in this field, data mining
in customer relationship management systems is used in this study.
Research Questions
- How to prioritize the importance of each RFM indicators?
-Could mobile online customers be divided into several segments, or clusters, and what
are the characteristics of each cluster of customers?
-Which online customers for mobile sellers is more benefit able?
Literature Review
Self-organizing networks, many applications in different fields such as science,
engineering (Jounela, Vermasvuori, Enden, & Haavisto, 2003), medicine(Moshou, Hostens,
Papaioannou, & Ramon, 2005), etc., which is one of them data mining and analysis of
complex spaces(Seo & Obermayer,2004).Yamada (2004) Self organizing networks to
identify and classify different environments, based on the work has used. Abonyi, Nemeth ,
Vincze, and Arva (2003) by analysis of processes, the quality of production is estimated
using Self organizing networks. Kate & Alan (2003) also are classified web pages by using self-organizing mappings. The various investigations on customer segmentation,
identification and analysis of their behavior has been, included Hsieh (2004) research on
the creation, integration between behavioral variables and scoring variables RFM, using
artificial neural networks, bank customers that can be classified. Zakrzewska and Murawski
(2005) used electronic banking clustering method DBSCAN they also used K-Means
clustering algorithm.
Sohrabi and Khanlari (2007) in their study based on RFM, customer lifetime value
calculated for a private bank and using a clustering approach, K-Means, customers divided
into 8 clusters and their characteristics were analyzed. Wu, Chang, and Lo (2009) using
RFM model and K-Means clustering method to analyze customer value a company engaged
in equipment manufacturing industry. After preparing the data, customers based on RFM
indicators were clustered into six different groups and characteristics of the customer's clusters were analyzed by using analysis of customer lifetime value. Namvar, Gholamian,
and KhakAbi, (2010) in their study, RFM analysis of the data and to calculate the lifetime
value of customers were using K-Means algorithm. Mo, Kiang, Zou, and Li (2010) in their
study of e-banking customer segmentation initially applying the techniques to reduce the
size of self-organizing network for market segmentation and clustering were used. Li, Dai,
and Tseng (2011) also analyzed the characteristics of customers in a knitting factory
developed based on RFM model using K-Means algorithm showed that customers were
Customer Lifetime Value
Customer lifetime value which titles such as: Customer value, lifetime value, customer
profitability, consumer rights, has been examined in several studies (Hwang, Jung, & Suh
2004). Generally Customer lifetime value, the value that customer provides for the
organizations during of their life time. In this concept, in addition to present customer's value , potential and future value for the company are pointed out and the main purpose of
its calculation, and creating a perceptions of weight in order to allocate resources to their
customers. There are various definitions of customer lifetime value, represents the views
and methods that differ from respect to this issue. The most commonly proposed methods
to determine customer lifetime value are: Net Present Value (NPV), Share of Wallet
(SOW), Markov Chain, Past Customer Value (PCV), Return on Investment (ROI) and
RFM model. RFM model that is used in the current study, are discussed the following.
RFM Model
RFM model was first introduced by Hughes (1994) and one of the most common and
widely used methods for determining the value of the customer, it considers three various
criteria (Buttle, 2004). The RFM model has not only proposed financial attitudes and Main Trend Analysis Method is a non-financial issue to the customer's specifications (Cheng &
Chen, 2009) .The modeled parameters are defined as follows:
Recency Shopping: This index refers into time between the last purchases taken by
customer for particular period. The lower distance, indicating the high value of this index in
the mentioned model.
Purchase Frequency: This indicator shows the number of transactions that a customer
has done during a specific period of time. Higher numbers of transactions, indicate the high
value of this index in the model.
Monetary Value of Purchases: This index represents the amount of money a customer
in transactions for a specific time period, has spent. Higher amount of money spent,
indicate high value of this index in the model.
In this model, it is assumed that customers with high value of the parameters of the model are the best customers, of course, so long they behave in the future as in the past
(Keiningham, Aksoy, & Bejou, 2006).
Data Mining and Customer Segmentation
Due to the rapid growth of information technology, the volumes of data stored in
databases are increasing rapidly. To analyze stored data and transform them into useful
information and knowledge for organizations are needed as powerful tools. Data mining is
a valuable tool that in the recent years, it is widely used to extract information, search for
discovery of relationships, patterns and trends as significant items with huge volume of
information stored in the database with the technology of pattern recognition that can be
investigated (Kantardzic, 2003).
One application for data mining is clustering. Clustering is to part a data set into
clusters so that similar to other members of a cluster is more similar to other cluster members (Kim & Sohn, 2004). The clustering makes it possible to identify, control and
manage the data easier to perform (Guha, Rastogi, & Shim, 1998). Clustering analysis is a
set of methodologies for the automatic division of samples into number of groups so that
samples within a group are similar and different samples of groups are not similar (Ngai et
al., 2009). A general conclusion from the analysis of clustering, a general description is
each cluster for a more in-depth analysis of the properties of the data set is needed (Lee &
Chen, 2005). In the cycle of customer relationship management, customer segmentation
and customer analysis can be an essential element in the customer's identification step
would name. According to the research, various data mining techniques for customer
segmentation has been used between them by neural network that have the maximum use
(Kuo, 2001).Table 1 shows the studies done in the field of customer identification.
Table 1
Different Data Mining Techniques Used to Identify Customers
CRM elements Data mining
functions Data mining techniques
References
Segmentation Assortment
Decision tree Kim et al , 2006
Self-organizing map, decision tree and Markov chain model
Ha et al , 2002
Clustering K-Means
Dennis et al ,2001
Data envelopment analysis, self-organizing map & decision tree Lee & Park ,2005
Target customer analysis Regression
Logistic regression Hwang et al , 2004
Classification Decision tree
Chen et al ,2003; Wu et al, 2005; Yu et
al,2005
Clustering Self-organizing map
Lee et al , 2004
Visualization Customer map
Woo et al , 2005
Shannon Entropy Weighting Method
In decision making sciences, different ways for weighting of factors have been
proposed that regarding the matter of decision, could be used. Shannon entropy is used in
this study that It is a concept in information theory .Implemented Entropy is a method for
physical and social sciences and also in the information theory where represents the
uncertainty resulting from a message. Implementation steps of this method are as follows:
The first, the initial decision matrix X [xij]m n is normalized. This way of normal
matrixN [nij]m n is obtained. Then uncertainty of each index is calculated.
1
[ ( )]; 1, 2.... m
j ij ij
i
E k n Ln n j n
In this equation k is replaced and m represents the number of rows for the decision
making matrix.
1 ( )
k
Ln m
Then the reliability is calculated for each index. dj 1 Ej(j 1, 2,... )n
In the end, weight of each index is calculated. This way, index weights or criteria are
computed.
1
( 1, 2,... ) j
j n
j j
d
w j n
d
(Hwang & Yoon, 1970)Neural Network Self-Organizing
An artificial neural network as a large number of highly interconnected processing elements that use a mathematical model, computational model or non-linear statistical data
modeling tools for information processing to be applied and represent complex input/output
relationships. Neural networks self-organizing, the most important and powerful networks
are available for data mining (Kohonen, 2001). These networks are often used to analyze
complex data spaces. Philosophy- base self- organizing networks, mapping the
high-dimensional spaces into two high-dimensional spaces or three high-dimensional spaces so that at least
information is lost and hidden information in relation to the data can be detected and
displayed.
The neural network self-organizing/self-organizing map is especially suitable for data
survey since it has a prominent visualizing property. It creates a set of prototype vectors
representing the data set and carries out a topology, preserving projection of the prototypes from the dimensional input space onto a low-dimensional grid. A self-organizing map is a
type of artificial neural network that is trained using unsupervised learning to produce a
low-dimensional (usually two-dimensional), discretized representation of the input space of
the training samples, and called a map. Self-organizing maps are different from other
artificial neural networks this means that they use a neighborhood function to preserve the
topological properties of the input space.
The self-organizing map copies the function of ‘grouping by categories’ operated by
human brain and each output processing element would affect one another. After learning,
elements, which means that they would have similar connection weight. Self-organizing
map could reflect an input value onto a spot of area, and the spots around neighboring areas
have similar functions (Saggaf, Toksoz, & Marhoon, 2003).
The self-organizing maps in general, a two-layered structure with an input layer and an
output layer. Each layer is composed of neurons so that the input layer neurons are responsible for data transfer to network and their number is equal with vectors dimension in
the input space. Neurons in the output layer according to the specific neighborhood
relationships are defined and the interaction between them on each other, providing the
network's output. Self-organizing network training is based on unsupervised learning
algorithm and Euclidean distance (Chang & Lai, 2005).
Method
This is an analytical- survey research to determine the relationship among variables that
has been carried out. The research community is all internet customers shopping for mobile
in Isfahan. A sample of 750 customers of these sites was considered .It is worth mentioning
that customers were reviewing their information in the databases are complete .Research
has been conducted on an autumn quarterly. To collect data related to indicators of RFM from the databases Mobile retail websites have been used. To determine weights of RFM
model parameters from Shannon entropy method has been used and the relative importance
of the indicators was specified. Besides, for customers clustering and their clustering
properties analysis of self-organizing networks in MATLAB has been used.
Data Analysis
Research analysis process includes the following steps:
Step one: To collect and sort data based on RFM model parameters. Sorting data is an important step in the process that the accuracy of the result is strongly correlated with how
to do it. Then data related to the index values of RFM was extracted from customers'
databases, pre-processing and data preparation stage was performed according to the code
allocated to any customer. For data pre-processing, activities of eliminating inadequate and incomplete data were performed.
New exchange index amount means the distance of the days in which the customer for
the last time has visited the mobile phone selling website and proceeded to deposit or
withdraw the money. Exchange frequency means the number of times which in the
mentioned timeframe, the customer is referred to a selling mobile phone website. Exchange
monetary means the total amount of money that the customer has deposited to or
withdrawed from his account. Thus, we show the amount of deposited money with a plus
Step two: Normalization of RFM Model indices
Considering that self-organizing network training is based on the Euclidean distance,
normality of network training data can greatly affect the output maps. And so, normalizing
the input data is an important step in self-organizing network training. Indices using the
following formulas between the numbers 0 to 1 became normal.
max min min
max min max min max min
; ;
R R F F M M
R F M
R R F F M M
In the above relationships R,F, and M are the original quantities of indices, R max ,F
max, and M max are the maximum quantities of indices, R min , F min, and M min are the minimum quantities of indices, R’ , F’ ,and M’ are normalized quantities of indices.
Step Tthree: Weighting RFM Model indices
In order to obtain relative weighting indices, the Shannon Entropy method is used and
ultimately, the weight of each indice is shown respectively with WR, WF, and WM.
According to output of this method, the relative weights of new exchange indices are
determined equivalent to 0.60, the exchange frequency is equivalent to 0.30 and exchange
monetary is equivalent to 0.10.
Step four: Determining the values of indices in RFM Model for each customer
The value of each index is determined by multiplying its normalized number and its
weight. The value of these indices are shown respectively with R”, F”, and M”. In other words, we have:
; ;
R F M
RR W FF W MMW
Step five: Determining the Aaverage value of RFM Model indices
The average value of each of these indices has been determined by dividing the total
value of that index in all customers to the total number of customers.
; ;
R F M
R F M
n n n
Average of each of these indices for new exchange is obtained equivalent to 0.364, for
the frequency of indices equivalent to 0.084 and for the monetary value of exchange
equivalent to 0.092.
Step six: Clustering the customers
For customers clustering, self-organizing network clustering techniques were used and
the results obtained from the network output were analyzed in the form of graphic maps.
phone. Lots of research has been done on the number of neurons in the maps layer.
Kohonen & Makisara (1984) recommends the formula of 5 n for the number of neurons in
the maps layer in which n is the number of training data. In this study we used the same
equation and considering that the number of training data has been 750 samples, 125
neurons in maps have been selected in map layer. After performing all processes, at the
end, five sections or information clusters are obtained and each customer is placed in one of
these clusters. Customers belonging to each of these sectors in terms of examined features, have a close resemblance to each other and are very different in characteristics from the
existing customers in other sectors. Clustering results are listed in Table 2.
Table 2
Clustering the Customers of Selling Mobile Websites in Self-organizing Neural Network Method
Clusters 1
2 3
4
Number of customers 39 %
37% 8%
16%
Average age of customers 42.12 27.35 38.63 56.12 Sex female 38% 46% 55% 26% male 62% 54% 45% 74% Marital Status single 22% 65% 38% 8% Married 78% 35% 62% 92% Education under diploma 2% 4% 2% 15% diploma 20% 15% 13% 45% Bachelor's degree 52% 44% 25% 13% Masters 18% 35% 45% 2%
PhD or higher 8%
2% 15%
25%
Step seven: Determining the average value of RFM Indices in each cluster
The average value of each of the indices in each cluster is shown with these signs: MM’, MF’’, MR’ and has been determined by dividing the total value of the clustering index to the number of customers.
; ;
R F M
R F M
M M M
n n n
Step eight: Clustering analysis
This analysis is done by comparing the average value index of each cluster with the
average value of index in the data and also with comparing the clusters scores in each
index. This comparison clarifies that the average value of each of the RFM indices in each
cluster relative to the average value of these indices in the total data is placed in what
a cluster is better than the average index value in the total data, and it is shown with this symbol: (↑). Unfavorable status is a situation in which the average index value in a cluster is not better than the average index value in the total data, and it is shown with this symbol: (↓)
Step nine: Calculating the lifetime value of customers in each cluster
Customer lifetime value in each cluster is calculated from the total average weight of
RFM index value in that cluster:
R R F F M M
CLV W M W M W M
The results of Seventh to ninth steps are shown in Table 3.
Table 3
Status of Clusters
Clusters 1 2 3 4 Recency Shopping R M
The average value 0.363 0.404 .315 .374 Rank Third first Fourth second Purchase Frequency F M
The average value 0.098 0.084 0.078 0.074 Rank first second Third Fourth
Monetary Value of Purchases MM The average value
0.115 0.076 0.095 0.081 Rank first Fourth second Third
Situation average index value )MR MFMM)
) ↓،↑، ↑ ( (↑،↑،↓)
) ↓، ↓، ↑ ( ) ↑،↓،↓ (
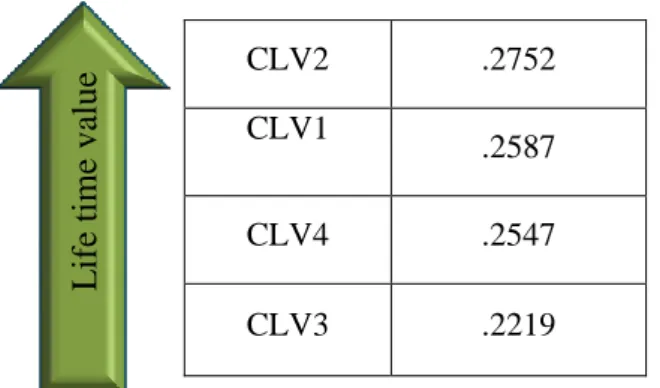
Life time value 0.2587
0.2752 0.2219
0.2547
Step ten: Customers analysis based on their lifetime value
In this step, customers in each cluster are shown according to their lifetime value in
terms of customer value pyramid which is illustrated in Figure 1. In this pyramid, the
customer lifetime value in four main clusters is discussed. As we move from the lower level of the pyramid to the higher levels, clusters have more lifetime value. In other words, by
moving towards the top of this pyramid, we encounter customers with greater value and
CLV2 .2752
CLV1
.2587
CLV4 .2547
CLV3 .2219
Figure 1. Pyramid of customers' lifetime value in selling mobile phone website
Thus, according to the customer lifetime value pyramid, customers of cluster 2 had the
highest value and importance for selling mobile phone website. Customers of this cluster
make up 27/5 percent of total customers of mobile phone sales website, their average age is
approximately 27 years, they are most male and single , mainly having Bachelor degree
and to some extent MA. These customers have recently visited mobile phone sales
websites, the number of referrals, but their referrals monetary value is low.
After cluster 2, customers of cluster 1 are of great importance for mobile phone sales
website. This cluster contains 39% of all customers who have an average age of almost 42 years. They are mostly male and married, they mostly have Bachelor degree or to
somewhat diploma. These customers had not recently visited mobile phone sales website
and their referral monetary value is high, but the number of referrals are low.
The next priority is to cluster 4, which covers the largest number of customers.
Customers of this cluster make up 16 percent of total customers; their average age is about
56 years. They most are married, and hold diploma degree. Cluster 4 customers have
recently visited website of selling mobile phone but the number of referrals and their
reference monetary value is low.
Cluster 3 is the next priority with the minimum number of customers, namely 8% of
them are included. The average age of the customers in this cluster is approximately 38 years, and most of them are married and have masters and to somewhat Bachelor's
degree. But the numbers of referrals are low and the monetary value is high for the mobile
phone sales and their reference monetary value is low.
Conclusions
In this study, for segmentation of a private mobile phone sales website in Isfahan based
on their lifetime value, RFM model and the techniques of Multi Criteria decision making
and data mining within a particular process has been used.
Providing cluster analysis in order to get a more accurate study of the characteristics of
customers in the clusters and also, the final customers segmentation based on their lifetime
value in the form of customers lifetime value pyramid is one of the things that is applied in
L
if
e ti
me va
this study. Another special feature of this research is using Shannon Entropy method for
weighting RFM indices that is a logical approach and it does not apply the personal
opinions of experts. Also, self-organizing neural networks method is used that is one of the
most accurate methods in the field of data mining and clustering.
Based on the above findings, customers of mentioned website are divided into four clusters which regarding the customer lifetime value, clusters 2, 1, 4 and 3 respectively
ranked in first to fourth. According to the customer value pyramid, selling mobile website
should attempt a lot and respect the customers of these clusters in order to maintain the
customers with their value (the highest lifetime value) in clusters 2 and 1. Thus, it is
recommended that in order to keep these customers, the websites communicate and interact
more with them and tries to keep these customers faithful to the websites. Because cluster 3
customers have the least lifetime value and a significant number is included in it, so it is
best that a more precise study on the causes of low levels of each of the RFM values indices
of the customers is done. In this regard, the mobile sales website should communicate and
interact with the customers through telephone calls, email, SMS, etc. to seek the causes of
the gap in customer purchase process and try to solve and cope with it. Mobile selling
website considering a special volumetric discount for customers of cluster 3 could also try in order to improve RFM indices level and consequently, increasing customers lifetime
value of this cluster and if possible decreases the next customers turn a ways.
It should be noted that customer buying behavior is not constant and consumer
purchasing information in the website will also change. A set of rules that is received in a
special time is validated for a specific time period and then becomes obsolete, so the
customer relationship management system must be adaptable to time. It is recommended
that in future studies a larger data set in terms of time domain be used which almost
certainly result in the creation of stronger results and a wider range of applied knowledge
concerning behavioral features of the customers. On the other hand, alternate time cutting
of the database company makes possible the implementation of dynamic data mining based
on RFM model to determine the customers lifetime value which considering that its results
reflects the changes in the customer behavior, can play an important role in marketing and improving customer relationship management .
References
Abonyi J., Nemeth S., Vincze C., & Arva P. (2003). Process analysis and product quality
estimation by Self-Organizing Maps with an application to polyethylene production.
Computers in Industry, 52(3), 221– 234.
Buttle, F. (2004). Customer relationship management: Concepts and tools. Elsevier
Butterworth Heinemann.
case-based reasoning in wholesaler’s new-release book forecasting. Expert Systems with
Applications, 29(1), 183–192.
Cheng, Ch. & Chen, Y. (2009). Classifying the segmentation of customer value via RFM
model and RS theory. Expert systems with applications, 36, 4176-4184.
Guha, S., Rastogi, R., & Shim, K. (1998). Cure: An efficient clustering algorithm for large databases. Proceedings of the ACM SIGMOD Conference (pp. 73-84).
Hsieh, N. (2004). An integrated data mining and behavioral scoring model for analyzing
bank customers. Expert Systems with Applications, 27, 623-633.
Hughes, A. M. (1994). Strategic database marketing. Chicago: Probus Publishing.
Hwang, H., Jung, T., & Suh, E. (2004). An LTV model and customer segmentation based
on customer value: a case study on the wireless telecommunication industry. Expert
Systems with Applications, 26, 181-188.
Jounela S. L., Vermasvuori M., Enden P., & Haavisto S. (2003). A process monitoring
system based on the Kohonen self-organizing maps. Control Engineering Practice,
11(1), 83–92.
Kantardzic, M. (2003). Data mining: Concepts, models, methods, and algorithms.
Piscataway,NJ: wiley – inter science, IEEE Press.
Kate, A. S., & Alan Ng (2003). Web page clustering using a self-organizing map of user
navigation patterns. Decision Support Systems, 35, 245– 256.
Keiningham, T. L., Aksoy, L., & Bejou, D. (2006). Approches to measurement and
management of customer value. Journal of Relationship Marketing, 5(2), 37-54.
Kim, Y. S., & Sohn, S. Y. (2004). Managing loan customers using misclassificationpatterns
of credit scoring model. Expert Systems with Applications, 26, 567-573.
Ko, E., Kim, S. H., Kim, M., & Woo, J. Y. (2008). Organizational characteristics and the
CRM adoption process. Journal of Business Research, 61, 65–74.
Kohonen, T. (2001). Self- organizing maps, Springer series in information sciences.
Springer, 30.
Kohonen, T., & Makisara, k. (1984). Phonotypic maps –insightful representation of
phonological features for speech recognition. Los Alamitos, CA.: IEEE Computer Soc.
Press, 182 -185.
Kuo, R. J. (2001). A sales forecasting system based on fuzzy neural network with initial
weights generated by gGenetic algorithm. European Journalof Operational
Research,129 (3), 496-517.
Lee, T. S., & Chen, I. F. (2005). A two-stage hybrid credit scoring model using artificial
neural networks and multivariate adaptive regression splines. Expert Systems with
Applications, 28(4), 743-725.
Li, D., Dai, W., & Tseng, W. (2011). A two stage clustering method to analyze customer
manufacturing business. Expert Systems with Applications, 38(6), 7186-7191.
Mo, J. Y., Kiang, M., Zou, P., & Li, Y. (2010). A two-stage clustering approach for
multi-region segmentation. Expert Systems with Applications, 37(10), 7120-7131.
Moshou, D., Hostens, I., Papaioannou, G., & Ramon, H. (2005). Dynamic muscle fatigue
detection using self-organizing maps. Applied Soft Computing, 5(4), 391–398.
Namvar, M., Gholamian, M R. ,& KhakAbi, S. (2010). A two phase clustering method for
intelligent customer Segmentation. International Conference on Intelligent Systems,
Modelling and Simulation, IEEE 2010.
Ngai, E.W.T., Xiu, L., & Chau, D.C.k. (2009). Application of data mining techniques in
customer relationship management: A literature review and classification. Expert
Systems with Applications, 36(2), 2592-2602.
Plakoyiannaki, E .(2005). How do organisational members perceive CRM? Evidence from
a U.K. service firm. Journal of Marketing Management, 21(3/4), 363-392.
Saggaf, M.M., Toksoz, M.N. ,& Marhoon, M.I. (2003). Seismic facies classification and
dentification by competitive neural networks. Geophysics, 44, 1041-1063.
Seo, S., & Obermayer, K. (2004). Self-organizing maps and clustering methods for matrix
data. Neural Networks, 17(8/9), 1211–1229.
Sohrabi, B. & Khanlari, A. (2007). Customer lifetime value (CLV) measurement based on
RFM model. Iranian Accounting & Auditing Review, 14(47), 7-20.
Wu, H., Chang, E., & Lo, Ch. (2009). Applying RFM model and K-means method in
customer value analysis of an outfitter. International Conference on Concurrent
Engineering, New York.
Yamada, S. (2004). Recognizing environments from action sequences using self-organizing
maps. Applied Soft Computing, 4, 35–47.
Zakrzewska, D., & Murlewski, J. (2005). Clustering algorithms for bank customer