Heuristic-based multiobjective time-cost optimization problem
considering risk and uncertainty impact
Solomon Sackey*, Muritala Adebayo Isah
Department of Civil Engineering, Kyungpook National University, 80 Daehakro, Daegu 41566, Korea. Orcid.org/0000-0002-1367-857X
ABSTRACT
It is the goal of project planners to complete a project at a minimal time and cost. Additional demand for resources which result in increased cost is required to complete the project within a shorter time period. This problem of time-cost trade-off (TCT) has led to several studies conducted to find an optimal solution using different optimization techniques such as the heuristic method and other optimization techniques. However, in these studies using the heuristic method, the researchers mainly use deterministic activity durations to model the TCT problem. TCT analysis using deterministic durations will only produce deceiving results which are unrealistic. With activity durations likely to deviate from actual durations, this study presents a heuristic-based approach for time-cost optimization by taking into account the impact of risk and uncertainty of activity duration. This was done using a probabilistic approach through simulation to develop realistic durations and use these durations as input to reschedule the critical path method network. A numerical example problem was applied and the results were compared to existing studies to understand the impact of risk and uncertainty on TCT analysis. This approach will guide decision-makers in making efficient and effective decisions in TCT optimization problems.
Keywords: Multiobjective optimization, Risk, Simulation, Time-cost trade-off, Uncertainty Submitted: 15-02-2019, Accepted: 01-03-2019, Published: 29-03-2019
INTRODUCTION
Completing projects at a minimal time and within a minimum cost are the main objectives of construction projects. The need for work from contractors has resulted in clients tightening their requirements. Project managers are under intense pressure to complete the project under tight deadlines subject to huge penalties if they failed to complete the project within the stipulated deadline. One of the best solutions to meeting deadline projects has been the use of crashing technique to shorten the project duration. However, as the project’s duration is reduced, the total project cost increases and the more the project’s duration is shortened, the more the total cost increases. This means that there is a trade-off between time and cost which requires an optimum solution to complete the project. Feng et al.[1] argued that the less expensive the resources
used, the more duration they require to complete an activity.
Hegazy[2] supports this argument with an example that using
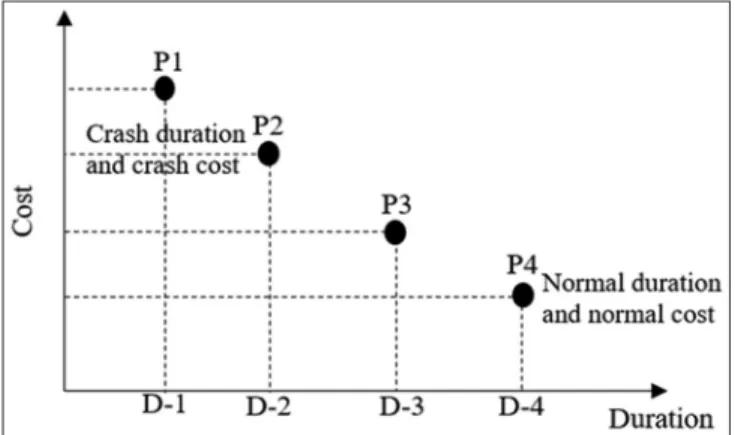
more productive equipment or hiring more workers may save time but may result in increased cost. Figure 1 depicts the relationship of time-cost trade-off (TCT), showing the normal and crash duration and the corresponding normal cost and crash cost for completing an activity using different construction options as P1, P2, P3, and P4. In any case, resource allocation decisions made during the early start of the activities control the overall project time and cost of the project. Finding the most desirable duration and cost to complete a project is the major challenge of project planners. However, since a project
should be executed to yield a profit for the organization, project planners must utilize effective means to complete the project
within a limited time. The critical path method (CPM) has been the project planners’ favorite project planning technique. The CPM helps to identify the critical activities which may impact the overall project’s completion duration if delayed. This presents project planners the opportunity to identify those critical activities and use the appropriate resources to complete
Address for correspondence: Solomon Sackey, Department of Civil Engineering, Kyungpook National University, 80 Daehakro, Daegu 41566, Korea. Tel.: +821028815232. E-mail: [email protected]
ISSN Number (2208-6404) Volume 3; Issue 1; March 2019
each activity. Hence, to perform TCT analysis, activities on the critical path can be crashed to reduce their duration and using
optimum resources to minimize the total project cost. Several
studies have been conducted on TCT problems to discuss the feasible techniques to solve TCT problems in construction projects.
TCT concept has been defined and explained in many ways
by different authors. The TCT is defined by Abbasnia et al.[3]
as a process to identify suitable construction activities for speeding up and for deciding how much so as to attain the best possible savings in both time and cost. The TCT can also be
defined as the process of finding the optimum time at which the
project can be completed within a desirable minimum cost. In
their research, Azaron et al.[4] applied genetic algorithm (GA)
technique to develop a multiobjective model for TCT problem
in program evaluation and review technique (PERT) network with generalized distribution of activity durations. Al Haj and
EL-Sayegh[5] presented a nonlinear integer programming model
developed to solve the time-cost optimization problem by taking into account the impact of total float loss. Eshtehardian
et al.[6] also investigated stochastic TCT problems using GA
and fuzzy logic theory that accounts for uncertainties in cost to help select specific risk levels. In an attempt to characterize the
amount of variability in networks, Bowman[7] proposed a model
for stochastic gradient-based TCTs in PERT networks using simulation to solve TCT problems. Criticizing the existing
GA-based approach for solving TCT problems, Li et al.[8] presented
an integrated machine learning and GA which generates time-cost curves from historical data to solve TCT problems.
Pathak and Srivastava[9] also formulated a model that integrates
a fuzzy logic framework with hybrid metaheuristic to solve
TCT problems within an uncertainty environment. Yang[10]
analyzed the impact of budget uncertainty on project TCT and
found that a higher degree of budget uncertainty presents a
tighter financial constraint, which needs an extra contingency.
Vanhoucke[11] proposed a new brand-and-bound algorithm
that uses lower bound calculation for discrete TCT problem without using time-switch constraints. The author proposed this model to improve the previous model developed by Yang and Chen,[12] who used time-switch constraints. Ke et al.[13] studied
modeling stochastic project TCTs with time-dependent activity
durations. Ballesteros-Perez et al.[14] recently studied nonlinear
TCT models of activity crashing: Application to construction scheduling and project compression with fast tracking. Chua et al.[15] also proposed a model using GA to solve conventional
TCT problems with resource consideration. Robinson[16] used
a dynamic programming solution to solve cost-time trade-off
for CPM. In providing a modification to existing models with
fuzzy sets theory, Zheng and Ng[17] developed a model for
stochastic time-cost optimization model by incorporating fuzzy
sets theory and non-replaceable front. Elbeltagi et al.[18] used
five different evolutionary-based optimization models (GA, memetic algorithm, particle swarm optimization [PSO], ant
colony, and shuffled frog leaping) to solve TCT problem and
compared their results. Aminbakhsh and Sonmez[19] presented
a discrete PSO method for the large-scale discrete TCT
problem.[20] In another study presented a hybrid
simulation-optimization approach for the robust discrete TCT problem. Mixed-integer nonlinear programming optimization model
was developed by Klanšek and Pšunder[21] to solve nonlinear
discrete TCT problems.
The heuristic method has been and still remains one of the
most useful techniques to solve TCT problems. Siemens[22]
was among the first to have used the heuristic method, through cost ratio approach to solve TCT problems. Recently, some
researchers have also used the heuristic algorithm to model
time-cost optimization in a construction project. Biswas
et al. and Nikoomaram et al.[23,24] adopted a heuristic method
to develop a model to solve different TCT problems in construction projects.
Despite the useful application of the heuristic method to solve TCT problems, these models mainly use deterministic durations to model the TCT problem. However, in reality,
activities may not be completed as planned. Some activities
may take a longer time to complete, while others may take a shorter time to complete. The uncertainties in the activity duration may affect the project duration, as well as the cost. Using deterministic activity durations may lead to the wrong selection of construction options (resource allocation), thus leading to selecting the wrong optimum solution to TCT problem. Uncertainty variables may include productivity rate, on-time availability of resources on site before starting an activity, and weather conditions. Hence, to improve the accuracy of optimum solution in TCT analysis, this study
presents a heuristic-based approach for time-cost optimization
by taking into account the impact of risk and uncertainty of activity duration. This was done by using a probabilistic approach through simulation to develop realistic durations and use these durations as input to reschedule the critical
path method (CPM) network. Simulation deals with the
uncertainties of activity duration in a project.
This study developed a multiobjective time-cost optimization problem in CPM-PERT network using realistic (random)
durations through simulation as input. Developing a
heuristic-based time-cost optimization problem by considering the risk
and uncertainty of activity duration will guide decision-makers
in making efficient and effective decisions in TCT optimization
problems.
MATERIALS AND METHODS
network. The next subsections will explain how the simulation durations are calculated and computational steps involved in
solving a heuristic-based time-cost optimization problem.
In almost all cases, the previous research papers on time-cost
optimization through crashing of activity duration have been
applied on construction projects. Therefore, this paper will also focus on applying the model on a simple construction project.
Generating Random Duration
To account for the uncertainty of activity duration, Monte Carlo simulation is applied. Activity duration can be simulated using probability distributions. In this study, we used triangular distribution to model random durations. In the triangular distribution technique, the expected duration of activity i (eDi) can be calculated using Eqn. (1)
eDt=(ai+mi+bi)/3 (1)
Where, aiis the optimistic duration of activity i, mi is the most likely duration of activity i, and bi is the pessimistic duration of activity i. However, we used the probability distribution of triangular distribution to generate random or simulated duration for each activity. In each activity, a triangular distribution was assigned and the random duration was generated. We show how simulation durations using the triangular distribution
were modeled in Microsoft Excel. We first established the
optimistic, most likely and pessimistic durations for each activity. Then, we created a custom variable called Cvar using Eqn. (2), after which random number between 0 and 1 were generated. Finally, random activity durations were generated using Eqn. (3).
var − = − i i i i m a C
b a (2)
(
)
(
)
(
)
(
)
(
)
var,
* * var ,
1 1 var * 1
≤ = + − − − − i
i i i i i
i
rand C
SimDur a b a IF rand C
C rand
(3)
Where, SimDuri is the simulation duration for activity i and randi is a random number generated for activity i.
These generated random durations are further simulated many times, and in this study, we used 10,000 iterations to
find realistically eDi. Visual basic for application (VBA) was
used to perform this iteration, and these generated durations become the actually expected durations to be used to prepare the network diagram (with activity uncertainty taken care of).
Cost-slope Computational Algorithm
The cost-slope method is the main heuristic method for TCT analysis deployed to reduce the project duration based on the fundamental assumption that the relationship between time and cost is linear. With this common assumption, cost slope of
activity i is defined by Hegazy[25] as the rate at which the direct
cost increases when the duration of that activity is reduced by a unit of time. To calculate the cost slope of each activity in the network, Eqn. (4) was used.
− = − i i i i i Cc Nc Cs
Nd Cd (4)
Where, Csi is the cost slope of activity i, Cci is the crash cost of activity i, Nci is the normal cost of activity i, Ndi is the normal duration of activity i, and Cdi is the crash duration of activity i.
Computational Steps Involved in Optimizing the Heuristic-based TCT Problem
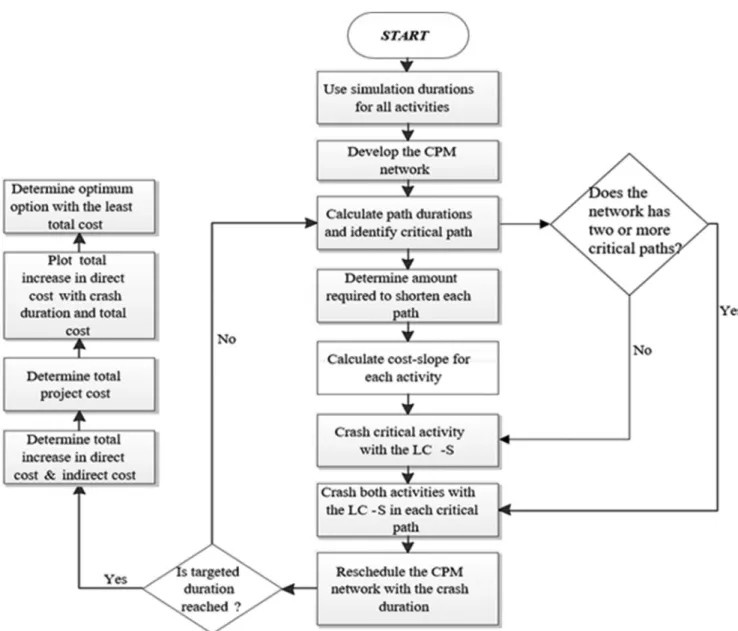
The objective here is to minimize the total cost of shortening the project duration to meet specific deadline such that the project’s profit is not much affected:
a. Use the simulation durations for all activities b. Develop the CPM network
c. Calculate and identify all the paths in the network (path with the longest expected duration = critical path) d. Determine the amount required to reduce each path in the
CPM network. The amount to be reduced on each path can be computed using Eqn. (5)
Λpath–j=ePCompath–j–tPCom (5)
Where, Λpath–j is the amount to be reduced on path j, ePCompath–j is the expected project completion time on path j, and tPCom is the targeted project completion time. e. Calculate and tabulate the cost slope for each activity as
well as defining the maximum crashing amount
f. Crash the critical activity with the least cost slope (LC-S) first based on the maximum amount to be crashed. If two
or more critical paths occur, crash the activity appearing in both paths, or crash both activities with the minimum cost slope in each path.
g. Reschedule the CPM network using the crashed duration
for that activity and calculate the project duration if the critical path does not change, continue to crash the activity until its maximum crash duration is exhausted.
h. Determine the total direct cost by multiplying the cost slope of the activity by the amount reduced, as well as the corresponding indirect cost by multiplying the estimated cost per day by the expected project duration.
i. Continue from step (g) until the deadline duration is reached.
resultant crash duration. Plot also the total project cost (direct + indirect costs) on the same graph and determine the optimum option with the least total cost.
The flowchart of the heuristic-based TCT optimization which
describes the steps involved in analyzing the TCT problem is
depicted in Figure 2.
NUMERICAL EXAMPLE PROBLEM AND
ANALYSIS
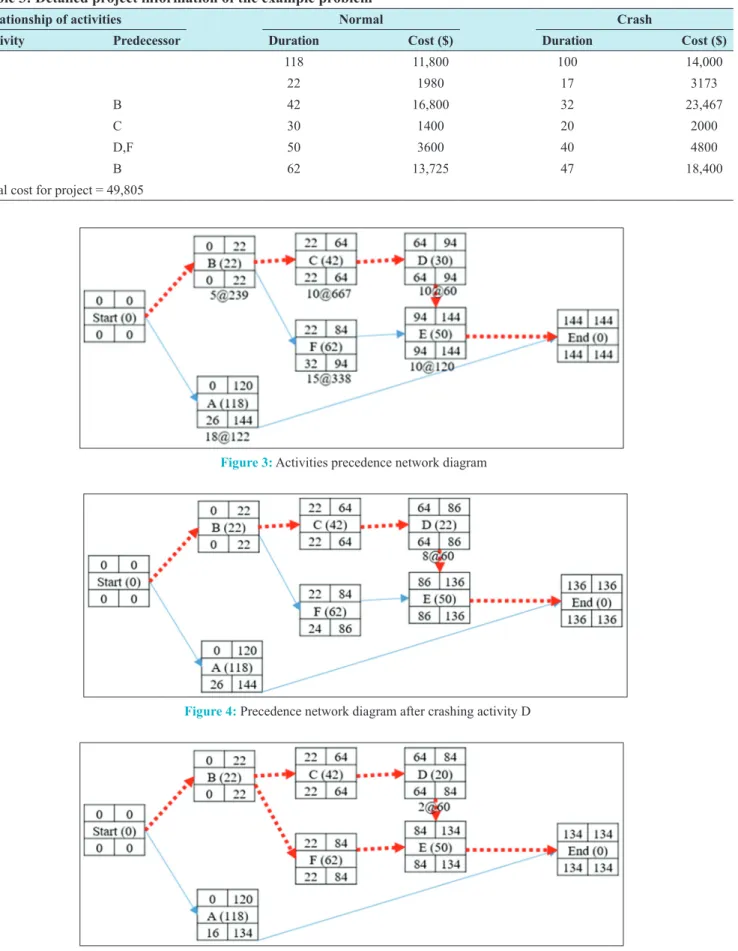
An example problem from a small construction project is considered to demonstrate the applicability and the impact of duration uncertainties on heuristic-based multiobjective TCT analysis. The scheduling project considered was previously applied to solve TCT problem by Biswas et al., 2016, using the heuristic method. For example, problem consists of six activities. The indirect cost of the project is assumed as $100/day. The project data with deterministic durations are shown in Table 1, which consist of activity names and their corresponding durations. Using the deterministic durations, the project was scheduled to be completed in 140 days.
Computational Steps
With reference to the data of the example problem, realistic durations through simulation were developed as shown in Table 2. These random durations are to be used as the expected duration of each activity. To avoid decimals in the activity
durations, any duration above 0.5 days was taken as 1 day. Table 3 shows the realistic durations of the activities, as well as the crash duration, normal cost, and the crash cost. Deploying the forward and backward technique, the early start time, early
finish time, late start time, and late finish time durations were
calculated to determine the total project completion time. The expected project completion time from the network diagram is 144 days and the critical path is B-C-D-E. The total direct cost of all the activities amounts to $49,805.
To expedite the project, an optimization approach was used to
reduced the project completion time of 144 days. In normal project crashing, reducing the duration increases the direct cost but decreases the indirect cost. Therefore, if the indirect cost is less than the direct cost, then an optimal or minimal cost can be achieved. Hence, the project can be crashed until the activity indirect cost becomes greater than its direct cost resulted from crashing the duration. However, in this study, a
target completion time of 124 days was used to find the optimal
cost of reducing the project duration of 144 days.
The network diagram in Figure 3 consists of three paths: Path 1 (B – C – D – E) = 144 days; Path 2 (B – F – E) = 134 days, and Path 3 (A-End) = 118 days. Determining their amount to be crashed, Path 1 can be crashed by a total of 20 days (144–124) while Path 2 can be crashed by a total of 10 days (134–124). Path 3 needs not to be crashed since its completion time is less than the targeted completion time. In Table 4, the calculation of the cost slope of all the activities is presented. It is important to compute the cost- slope of all the activities and not just the critical path activities, in that the path can change after crashing an activity and will need such information.
Using these realistic expected durations from simulation, the CPM network is drawn as depicted in Figure 3. With the cost slope of each activity computed, the detailed analysis of the cycle computation of the total direct cost and indirect cost resulting from crashing the critical activities duration can be
summarized as follows:
• 1st cycle: This cycle uses the initial CPM data, where
the total project completion duration = 144 days. Indirect cost = 144 days *100/day = 14400 and total direct cost = 49805. Total project cost = (49805+14400) = 64205
• 2nd cycle: Identify critical path and activity with LC-S
Critical path = B – C – D – E = 144 days.
Activity with the LC-S of this critical path = activity D (60) and
this activity can be crashed by at least 8 days. Therefore, activity D becomes 22 days and the CPM is recalculated as shown in Figure 4. There will not be any change in the critical path. The total project completion duration = 136 days. Indirect cost = 136 days *100/day = 13600 and total direct cost = 49805 + (8*60) = 50285. Total project cost = (50285 + 13600) = 63885.
Figure 1: Time-cost relationship of an activity Table 1: Project data with deterministic durations Activity Predecessor Normal duration
A 120
B 20
C B 40
D C 30
E D,F 50
• 3rd cycle: Identify critical path and activity with LC-S.
No change in critical, Critical path = B – C – D – E but duration = 136 days.
Activity with LC-S of this critical path is still = activity D (60)
which can further be crashed by 2 days. Therefore, activity D reaches its maximum crash duration of 20 days and the CPM is recalculated as shown in Figure 5. The total project completion duration = 134 days. Indirect cost = 134 days *100/day = 13400 and total direct cost = 49805 + [(2*60) + (8*60)] = 50405. Total project cost = (50405 + 13400) = 63805
• 4th Cycle: Identify critical path and activity with LC-S. Here,
two paths are critical: Path 1: B – C – D – E = 134 days and
Path B – F – E = 134 days. The LC-S in Path 1 is activity
D but cannot be crashed anymore since its maximum crash
duration is exhausted. In Path 2, the LC-S is activity E which
is also the least considering Path 1 when D is out. In this situation, both B and E can be crashed. Activity B and E both can crash by at least by 5 days. Hence, activity B becomes
Figure 2: Flowchart of the heuristic-based time-cost trade-off optimization
Table 2: Realistic duration of activities generated through simulation
Activity Predecessor Realistic (random) duration
A 117.66
B 21.65
C B 41.68
D C 29.94
E D,F 49.96
Figure 3: Activities precedence network diagram
Figure 4: Precedence network diagram after crashing activity D
Figure 5: Precedence network diagram after crashing activity D second time Table 3: Detailed project information of the example problem
Relationship of activities Normal Crash
Activity Predecessor Duration Cost ($) Duration Cost ($)
A 118 11,800 100 14,000
B 22 1980 17 3173
C B 42 16,800 32 23,467
D C 30 1400 20 2000
E D,F 50 3600 40 4800
F B 62 13,725 47 18,400
17 days and activity E becomes 45 days (359; sum of 239 cost slope of B and 120 cost slope of E) and the network is recalculated as depicted in Figure 6. The total project completion duration = 130 days. Indirect cost = 124 days *100/day = 12400 and total direct cost = 49805 + (5*359) = 51600. Total project cost = (50330 + 12400) = 64000
In Table 5, the summary of the analysis results is presented.
The first column shows the project duration, while the next
columns show the corresponding indirect, direct, and the
total costs resulting from optimizing the project duration by
shorting the original project duration of 144 days in an attempt of expediting the project.
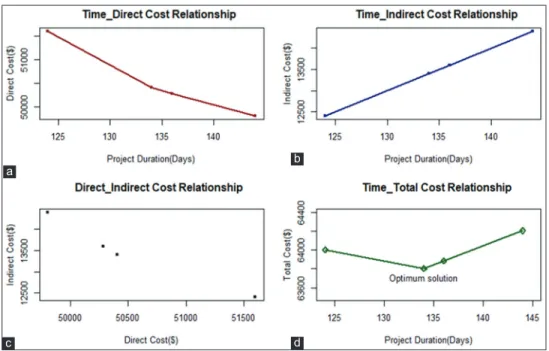
Figure 7 presents detailed results of the time-cost optimization
problem. Figure 7 consists of four solutions: (a) Time-direct cost relationship, (b) time-inTime-direct cost relationship, (c) direct-indirect cost relationship, and (d) time-total cost relationship. It can be seen in Figure 7a that as project duration is crashed to a minimum duration, the direct cost of the project increases. On the other hand, in Figure 7b, reducing the total project duration decreases the indirect cost linearly. The direct-indirect cost relationship in Figure 7c shows that as direct cost increases as a result of shortening the project duration, indirect cost decreases. The optimal
Figure 6: Precedence network diagram after crashing activity B and E
Table 4: Cost slope of activities in the network
Activity Normal Crash Cost slope
Duration Cost ($) Duration Cost ($)
A 118 11,800 100 14,000 122
B 22 1980 17 3173 239
C 42 16,800 32 23,467 667
D 30 1400 20 2000 60
E 50 3600 40 4800 120
F 62 13,950 47 18,800 338
Figure 7: (a-d) Project time-cost relationship
a b
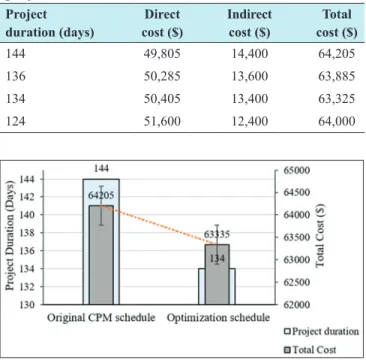
solution, for example, problem is depicted in Figure 7d, where the optimum solution occurred at 134 days and at a minimum total project cost of $63,805. In Figure 8, the comparison of the original project schedule of time and cost against the total project’s time and cost after crashing the project for the expedition is presented.
DISCUSSION AND RESULTS
This section discusses the results from the analysis of the TCT problem. Time and cost, which are independent of each other, are the two important attributes of any project. It is the objective of the project management team to complete the project within a minimum time and at the same time within a minimum cost. However, it is not easy to satisfy these two
conflicting objectives at the same time. Optimization has been
identified as the most suitable technique to model this kind of
the problem of conflicting factors where an attempt to optimize
(reduce) one objective increases the other objective factor. The results in Figure 7a show that as the project original duration is shortened through crashing, i.e., from 144 days to 124 days, the total direct cost increased from $49,805 to $51,600. The results in Figure 7b and Figure 8 show a decrease in the total project cost from $64,205 to $63,325 as project duration reduces. However, at some point, the total project cost increases again as the project is further reduced. After 134 days, where the total cost occurred at a minimum of $63,325, the total cost increased again to $64,000 at a duration of 124 days. This explains the
real behavior of projects and the concept of optimization in construction projects. The time-cost optimization, for example,
problem results in a minimum total project cost of $63,325 and with a total project duration of 134 days. The minimum total cost is achieved because every time the project duration is reduced, the total indirect cost is decreased. This suggests that the project can be done in 134 days instead of the original 144 days, and within a minimum cost of $63,325, saving about $880 from the original CPM schedule of $64,205. The results of this study are accurate and reliable and are better than the results presented by Biswas et al., 2016, who used deterministic activity durations in the TCT problem and found the optimum solution at 130 days. However, because this study incorporated risk and uncertainty analysis using probabilistic approach through simulation to generate realistic (random) activity durations, an accurate optimum solution was achieved at 134 days and a minimum total cost of $63,325. An accurate and reliable optimum solution from the TCT analysis will help the project management team to make better decisions on effectively allocating resources to complete the project.
CONCLUSION
The goal of this study was to apply a heuristic approach to
analyze a multiobjective time-cost optimization problem by
considering the impact of risk and uncertainty of activity durations on achieving the optimum solution of the TCT problem under consideration. The study used a probabilistic approach through simulation to develop realistic durations and use these durations as input to reschedule the CPM network. A heuristic technique was used to crash the activity durations and the total project duration. A total of 10 days was reduced from the original CPM schedule of 144 days which has considered uncertainties in the activity durations. This reduction increased the total direct cost of the project from $49,805 to $50,405. This indicates that about 13.9% decrease in total project duration is achieved by increasing the total cost of the project by just 1.2%, which is quite satisfactory.
Developing a heuristic-based time-cost optimization problem
by considering the risk and uncertainty of activity duration
will guide decision-makers in making efficient and effective decisions in TCT optimization problems.
REFERENCES
1. Feng CW, Liu L, Burns SA. Using genetic algorithms to solve construction time-cost trade-off problems. J Comput Civil Eng 1997;11:184-9.
2. Hegazy T. Optimization of construction time-cost trade-off analysis using genetic algorithms. Can J Civil Eng 1999;26:685-97. 3. Abbasnia R, Afshar A, Eshtehardian E. Time-cost trade-off
problem in construction project management, based on fuzzy logic. J Appl Sci 2008;8:4159-65.
4. Azaron A, Perkgoz C, Sakawa M. A genetic algorithm approach for the time-cost trade-off in PERT networks. Appl Math Comput 2005;168:1317-39.
Table 5: Summary of associated costs of crashing the project duration
Project
duration (days) cost ($)Direct Indirect cost ($) cost ($)Total
144 49,805 14,400 64,205
136 50,285 13,600 63,885
134 50,405 13,400 63,325
124 51,600 12,400 64,000
5. Al Haj RA, EL-Sayegh SM. Time cost optimization model considering float-consumption impact. J Constr Eng Manag 2015;141:4015001.
6. Eshtehardian E, Afshar A, Abbasnia R. Time cost optimization: Using GA and fuzzy sets theory for uncertainties in cost. Constr Manag Econ 2008;26:679-91.
7. Bowman RA. Stochastic gradient-based time-cost tradeoffs in PERT networks using simulation. Ann Oper Res 1994;53:533-51. 8. Li H, Cao JN, Love PE. Using machine learning and GA
to solve time-cost trade-off problems. J Constr Eng Manag 1999;125:347-53.
9. Pathak BK, Srivastava S. Integrated fuzzy HMH for project uncertainties in time cost tradeoff problem. Appl Soft Comput 2014;21:320-9.
10. Yang IT. Impact of budget uncertainty on project time-cost tradeoff. IEEE Trans Eng Manag 2005;52:167-74.
11. Vanhoucke M. New computational results for the discrete time/ cost trade-off problem with time-switch constraints. Eur J Oper Res 2005;165:359-74.
12. Yang HH, Chen YL. Finding the critical path in an activity network with time-switch constraints. Eur J Oper Res 2000;120:603-13.
13. Ke H, Weimin MA, Chen X. Modeling stochastic project time cost trade-offs with time-dependent activity durations. Appl Math Comput 2012;218:9462-9.
14. Ballesteros-Perez P, Elamrousy K.M, Gonzalez-Cruz M.C. Non-linear time-cost trade-off models of activity: Applications to construction scheduling and project compression with fast-tracking. Autom Constr 2019;97:229-40.
15. Chua DK, Chan WT, Govindan KA. Time-cost trade-off model
with resource consideration using genetic algorithm. Civil Eng Syst 1997;14:291-311.
16. Robinson DR. A dynamic programming solution to cost-time tradeoff for CPM. Manag Sci 1975;22:158-66.
17. Zheng DX, Ng ST. Stochastic time cost optimization model incorporating fuzzy sets theory and non-replaceable front. J Const Eng Manag 2005;131:176-86.
18. Elbeltagi E, Hegazy T, Grierson D. Comparison among five evolutionary-based optimization algorithms. Adv Eng Inform 2005;19:43-53.
19. Aminbakhsh S, Sonmez R. Discrete particle swarm optimization method for the large-scale discrete time cost trade-off problem. Expert Syst Appl 2016;51:177-85.
20. Said SS, Haouari M. A hybrid simulation-optimization approach for the robust discrete time/cost trade-off problem. Appl Math Comput 2015;259:628-36.
21. Klanšek U, Pšunder M. MINLP optimization model for the nonlinear discrete time cost trade-off problem. Adv Eng Softw 2012;48:6-16.
22. Siemens N. A simple CPM time-cost tradeoff algorithm. Manag Sci 1971;17:354-63.
23. Biswas SK, Karmaker CL, Biswas TK. Time-cost trade-off analysis in a construction project problem: Case study. Int J Comput Eng Res 2016;6:10.
24. Nikoomaram H, Lofti FH, Jassbi J, Shahriari MR. A new mathematical model for time cost trade-off problem with budget limitation based on time value of money. Appl Math Sci 2010;4:3107-19.
25. Hegazy T. Computer-Based Construction Project Management. Upper Saddle River, NJ: Prentice Hall; 2002.