Original Research Article
Mismatch negativity in children with cochlear implant
Mai Hamid
1*, Mona Ahmed Kotait
2, Enaas Ahmad Kolkaila
2INTRODUCTION
Children with severe to profound prelingual hearing loss experience significant auditory deprivation which places them at risk for difficulties with oral language. The delay in early precursors of oral language leads to deficits in vocabulary development, morphology, syntax, academic achievement, as well as social development.1
Cochlear implant surgery has become a common practice for deaf children, especially those who receive little or no benefit from hearing aids.2 This electronic device bypasses the damaged outer hair cell of the cochlea through direct electrical stimulation of the auditory nerve
fibers.3 However, stimulating the auditory nerve with up to 22 active electrodes cannot be compared to its stimulation by thousands of inner ear hair cells. Accordingly, frequency discrimination is lower with CI.4
Although cochlear implants (CIs) are highly successful neural prostheses, speech perception outcomes varies and may be unpredictable.5 The performance of an implant is strongly associated with the auditory processing abilities of the patient and the integrity of the central auditory pathways. Indeed, performance is correlated with duration of hearing loss, age at onset of hearing loss (pre, peri, or post-lingual) and etiology of hearing loss.6 Other factors such as age at implantation, intelligence quotient (IQ), preoperative CT scan showing the survival of spiral
ABSTRACT
Background: Cochlear implant provides a great opportunity for children with severe to profound sensorineural
hearing loss to restore normal hearing. Identifying mismatch negativity (MMN) in cochlear implant recipients helps to assess the role of central auditory structures in processing speech stimuli in those patients. The objective of the present study is to evaluate tone and speech discrimination in cochlear implanted children using mismatch negativity test.
Methods: MMN was recorded in 35 children. They were divided into two groups. Control group consisted of 15 normal hearing children, their age ranged from 3-11 years. Study group consisted of 20 children fitted with unilateral CI, and their age matched the control group. Two oddball paradigms were used; the first was tone bursts (1000 Hz as standard stimulus and 1050 Hz as deviant stimulus). The second was synthesized speech stimuli (/da/ as standard stimulus and /ga/ as deviant one). Both paradigms were presented at 75 dB SPL.
Results: All cochlear implanted children included showed MMN on using both oddball paradigms. Comparing results
of both groups revealed statistically significant differences in MMN latency and amplitude. There was a significant positive correlation between MMN latencies and the implantation age as well as the duration of hearing loss before implantation.
Conclusions: MMN provides an objective tool to assess the auditory discrimination abilities in cochlear implanted children which may help in their rehabilitation and also in the optimum setting of their devices.
Keywords: Cochlear implants, Mismatch negativity, Auditory discrimination
Audiovestibular Medicine, 1Ministry of Health, 2Tanta University, Egypt
Received: 28 February 2019
Revised: 18 June 2019
Accepted: 21 June 2019
*Correspondence:
Dr. Mai Hamid,
E-mail: dr.mai.hamid.1987@gmail.com
Copyright: © the author(s), publisher and licensee Medip Academy. This is an open-access article distributed under
the terms of the Creative Commons Attribution Non-Commercial License, which permits unrestricted non-commercial use, distribution, and reproduction in any medium, provided the original work is properly cited.
ganglion cells and the device settings used were found to be associated with changes in auditory performance. However, all these parameters still do not completely explain why implanted patients differ in speech performance.7
Normal brain is able to perceive minute changes in the acoustic environment. Mismatch negativity (MMN) has been gaining impetus as a measure to assess discrimination. MMN is defined as “an electric brain response, a negative component of the event related potential (ERP), elicited by any discriminable change (deviant) in some repetitive aspect of auditory stimulation (standard), usually peaking around at 100-200 ms from onset”.8
Identifying MMN in cochlear implant recipients provides an opportunity to assess the processing of speech stimuli. So, this work was designed to study MMN in CI patients as MMN results can indicate how the brain discriminates
encoded speech parameters. Thereby providing
knowledge of the minimal cues required for processing speech via a cochlear implant.
METHODS
Study design
A case-control study.
Study place and period
The study was conducted in Audiology Unit,
Otorhinolaryngology department, Tanta University
Hospitals, from November 2016 to January 2018.
Selection criteria of patient
Children with cochlear implant of more than 6 months who are regular users with satisfactory aided response. Their age ranged from 4 to 10 years, with no neurological or developmental abnormalities.
Procedure
Thirty five children were enrolled in this work. Subjects were divided into two groups: control group which consisted of 15 normal hearing children. Their age ranged from 3-11 years, with no oto-rhinolaryngologic problems. The study group consisted of 20 cochlear implanted children. All children who had unsatisfactory aided response were excluded from this study.
Full audiological history was obtained from all participants in this study. Otological examination and basic audiological evaluation were performed for the control group. Aided sound field evaluation was done for the study group in a sound treated booth using warble tone through loudspeakers located at 45˚ azimuth at a
distance of 50 cm from the sitting patient at frequency range of 250-4000 Hz.
MMN was elicited using two odd ball paradigms; the first was tone bursts (1000 Hz as standard stimulus and1050 Hz as deviant stimulus). The second was synthesized speech stimuli (/da/ as standard stimulus and /ga/ as deviant stimulus). In both paradigms the stimuli were presented at 75dB SPL. Loudspeakers were located at 0˚ azimuth at a distance of 50 cm from the child‟s sitting. Ear plugs were fitted to the non-stimulated ear in the control group to minimize its contribution to the recording.
MMN was calculated in the difference waveform which was obtained by equipment subtraction of the standard stimulus trace from the deviant stimulus one. The MMN responses were identified visually as the prominent negativity that occurs between 100 and 250 ms.
Ethical approval
This study was approved by the Research Ethics Committee of Tanta University on June 2016 with approval code 30997/06/16.
Statistical analysis
Results were collected, tabulated and statistically analyzed using the computer package SPSS for windows, release 16 SPSS Inc. Chicago, III, USA.
RESULTS
In this study, the age range of the control group was 3-11 years with the mean of 6.96±2.41 years. They were 5 males (33.3%) and 10 females (66.7%). The age of the study group ranged from 4-10 years with the mean of 7.50±1.72 years. There was no statistical significant difference between both groups regarding the age range.
The study group consisted of 11 males (55%) and 9 females (45%). Ten children (50%) had cochlear implant on the right side, while the other ten children (50%) were implanted on the left side.
loss before implantation in children with right CI group was 3.60±1.44, while in those with left CI was 3.00±1.45 with no statistical significant difference between both study subgroups (p=0.367). The mean of duration of CI in children with right CI group was 3.05±1.51, while in those with left CI was 2.75±1.08 with no statistical significant difference between both study subgroups (p=0.617) (Table 1).
Regarding the MMN results, all the cochlear implanted children as well as normal hearing subjects participated in this study elicited a MMN response to both types of stimuli used in the oddball paradigms. As regard results of MMN using tone stimuli, the MMN mean latencies were 194.36±22.02 and 242.45±37.76 ms in the control and study groups respectively. There was a statistically significant difference in MMN latency between both groups. The MMN mean amplitudes were 3.47±0.79 and 2.38±0.56 μv in the control and study groups respectively. There was a statistically significant difference in MMN amplitude between both groups. The MMN mean duration was 78.47±40.64 and 77.72±41.41 ms in the control and study groups respectively which was not statistically significant. The MMN mean area was 269.37±143.17 and 180.49±102.12 in the control and study groups respectively which was statistically significant (Table 2).
Table 1: Demographic data of the study group.
Variable
Right CI (n=10)
Left CI (n=10)
Independent samples t-test
N (%) N (%)
Gender
Male 6 (60) 5 (50)
Female 4 (40) 5 (50)
Type
AB 4 (40) 3 (30)
MED-EL 6 (60) 7 (70)
Phonology
Single words 3 (30) 0 (0)
2-3 word
sentence 7 (70) 10 (100)
Cause of HL
Specific 2 (20) 1 (10)
Non-specific 8 (80) 9 (90)
Age at CI (years) t= 2.071
P= 0.053
Mean±SD 5.30±1.51 3.85±1.61
Duration of HL (years) t= 0.925
P= 0.367
Mean±SD 3.60±1.44 3.00±1.45
Duration of CI (years) t= 0.508
P= 0.617
Mean±SD 3.05±1.51 2.75±1.08
Table 2: Comparison between control group and study group using tone stimuli in MMN.
Groups Independent
samples t-test
Control (N=30) Study (N=20)
Range Mean±SD Range Mean±SD T P
Latency 152.80-237.10 194.36±22.02 175.00-299.60 242.45±37.76 5.142 0.001
Amplitude 2.07-4.70 3.47±0.79 1.27-3.21 2.38±0.56 -5.654 0.001
Duration 24.80-180.80 78.47±40.64 15.20-144.80 77.72±41.41 -0.064 0.949
Area 53.32-594.64 269.37±143.17 33.14-406.37 180.49±02.12 -2.561 0.014
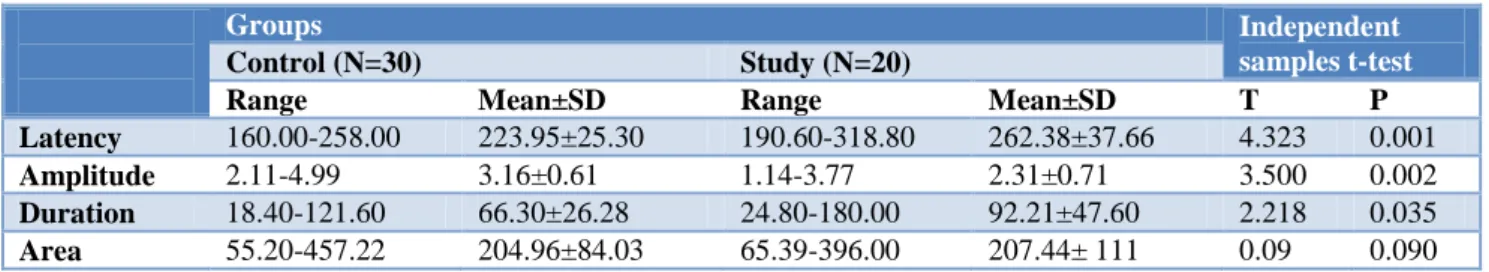
Table 3: Comparison between control group and study group using speech stimuli in MMN.
Groups Independent
samples t-test
Control (N=30) Study (N=20)
Range Mean±SD Range Mean±SD T P
Latency 160.00-258.00 223.95±25.30 190.60-318.80 262.38±37.66 4.323 0.001
Amplitude 2.11-4.99 3.16±0.61 1.14-3.77 2.31±0.71 3.500 0.002
Duration 18.40-121.60 66.30±26.28 24.80-180.00 92.21±47.60 2.218 0.035
Area 55.20-457.22 204.96±84.03 65.39-396.00 207.44± 111 0.09 0.090
For MMN by speech stimuli, the mean latencies were 223.95±25.30 and 262.38±37.66 ms in the control and study groups respectively. While the MMN mean amplitudes were 3.16±0.61 and 2.31±0.71 μv in the control and study groups respectively. The MMN mean durations were 66.30±26.28 and 92.21±47.60 ms in the control and study groups respectively. The MMN mean area was 204.96±84.03 and 207.44±111 in the control and study groups respectively. Statistical analysis
revealed significant difference in latencies, amplitudes and duration while there was no statistically significant difference in MMN area between both groups (Table 3).
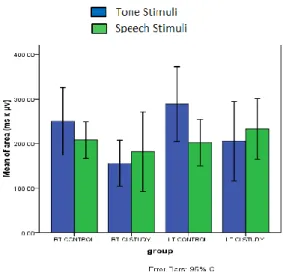
results of MMN in response to tone and speech stimuli in the study group, showed no statistically significant difference between the two elicited stimuli (Figures 1, 2, 3).
Figure 1: Latency of MMN using tone and speech stimuli between control and study groups.
Figure 2: Amplitude of MMN using tone and speech stimuli between control and study groups.
Figure 3: Area of MMN using tone and speech stimuli between control and study groups.
DISCUSSION
Results of this work showed that cochlear implanted children had longer latencies and smaller amplitudes in comparison to age matched, normal hearing children on using tone stimuli. Our results agreed with Gabr who reported delayed MMN latencies in cochlear implanted children despite their morphological similarity to that recorded in normal hearing subjects.9 Furthermore, Hahne et al and Obuchi et al also reported delayed latencies and smaller amplitudes in CI patients than in normal hearing controls.10,11 This finding may be related to difficulties faced by CI subjects in using temporal and spectral cues. They appeared to require longer time to process the incoming information as compared to the normal hearing subjects.
On the other hand, results of this work disagreed with Torppa et al. These authors reported comparable latencies and amplitudes of MMN responses in early cochlear implanted children (mean age 6 years, 10 months) and normal hearing controls on using tone stimuli.12 Furthermore, on using speech stimuli (/da/ as a standard stimulus and /ga/ as a deviant one), the CI children showed longer latencies, duration and smaller amplitudes in comparison to normal hearing children in the control group. These findings suggest the smaller activation of the auditory cortex by the more complex speech stimuli in cochlear implant users due to the limited recruitment of the auditory cortex in those patients when performing more difficult perceptual tasks.13
On the other hand, our results disagreed with Kraus et al, who reported that the MMN waveforms in cochlear-implant users are strikingly similar to those recorded from normal listeners. They also reported that this similarity implied that central auditory system‟s response to these speech stimuli was consistent, independent of whether the stimulus was processed through a normal cochlea or mediated by a cochlear implant. Remarkably, despite the limited input provided by an implant (compared to a normal cochlea), the brain appeared to process the signals in a relatively normal fashion. The authors also reported that the absence of MMN in the „poor‟ implant user suggested that MMN might reflect the behavioral speech discrimination ability, although they stated that this relationship needed to be determined by further studies.14
Moreover, results of our work disagreed with those of Elkayal et al. These authors evaluated factors that influence cochlear implant performance. They found a statistically significant difference between speech perception and benefit from cochlear implant and MMN presence or absence within its normal latency: 91.7% of patients with fair benefit and 100% of patients with good benefit had a good and robust MMN response.15
when comparing the responses of the right sided and left sided cochlear implanted children on using either tone or speech stimuli. This result agreed with Roman et al. These authors evaluated the possible effect of the side of implantation on a subset of evoked responses and did not find any significant difference in latencies and amplitudes of responses between right and left cochlear implanted patients. These findings suggest that electric stimulation of the auditory nerve activates both hemispheres. So, the side of cochlear implantation is not a predictive factor of auditory perception skill.7
On the other hand, our results disagreed with Rahman et al, who assessed thirty one cochlear implanted children between four and five years of age. They found significant difference between right side implantees and left side implantees in MMN latency and amplitude. This result may be attributed to the alternative neural strategies that permit speech comprehension mainly in the various speech-processing left hemisphere regions after CI.16 In our study, latencies of MMN elicited by speech were longer than those elicited by tone stimuli although the difference did not reach the significant level. This might be related to the more complexity of speech syllables which require more processing time. Our results also agreed with Kileny et al. These authors reported that different types of stimuli used to evoke auditory responses had a consistent effect on peak latencies. Although none of the differences reached significant level.17
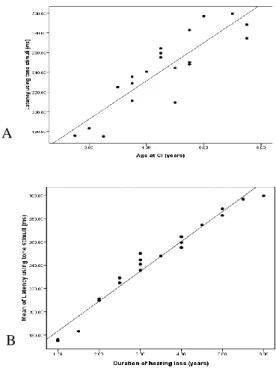
Figure 4: Correlation between MMN latency using tone stimuli and age at CI (A) and duration of hearing
loss (B).
In the current work, there was a statistically significant positive correlation between MMN latency and the age at
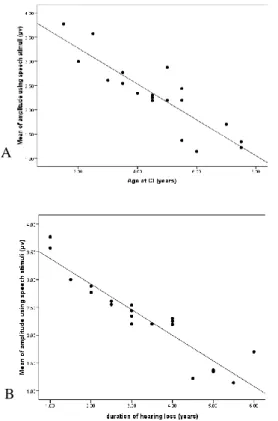
implantation, as well as between MMN latency and the duration of hearing loss on using either type of stimuli (Figures 4, 5). While for MMN amplitude, there was a negative correlation between MMN amplitude and the age at implantation, as well as between MMN amplitude and the duration of hearing loss on using either type of stimuli (Figures 6, 7).
Figure 5: Correlation between MMN amplitude using speech stimuli and age at CI (A) and duration of
hearing loss (B).
Figure 6: Correlation between MMN amplitude using tone stimuli and age at CI (A) and duration of hearing
loss (B).
B A
A
B
These findings imply that better test results in the form of shorter latencies and higher amplitudes are obtained with earlier implantation age and shorter duration of hearing loss before implantation. These results are in agreement with the data in support of “earlier is better” for postoperative outcomes. However, it is important to recognize that even children implanted over 2 years of age still derive significant benefit from cochlear
implantation. Families should be educated and
appropriately counseled regarding realistic expectations. They should also be teached to consider the age at activation as a critical variable in this process.18
Figure 7: Correlation between MMN amplitude using speech stimuli and age at CI (A) and duration of
hearing loss (B).
CONCLUSION
From the current study, we can conclude that cochlear implanted children exhibit fine auditory discrimination abilities on using both tone and speech stimuli in MMN. The results showed delayed latencies and reduced amplitudes when compared to normal hearing peers. There is a significant correlation between the MMN response and the implantation age as well as the duration of hearing loss before implantation. Our results also suggest that the MMN could be applied as an objective measure of the neurophysiologic events underlying speech discrimination in implanted children.
Funding: No funding sources Conflict of interest: None declared
Ethical approval: The study was approved by the Institutional Ethics Committee
REFERENCES
1. Spencer PE, Marschark M. Evidence-based practice
in educating deaf and hard-of-hearing students. Oxford University Press; 2010.
2. Cruz I, Quittner AL, Marker C, DesJardin JL. Identification of effective strategies to promote language in deaf children with cochlear implants. Child development. 2013;84(2):543-59.
3. Silva LAF, Couto MIV, Magliaro FC, Tsuji RK, Bento RF, de Carvalho ACM, et al. Cortical maturation in children with cochlear implants:
Correlation between electrophysiological and
behavioral measurement. PloS ONE.
2017;12(2):171-7.
4. Zeng F G, Tang Q, Lu T. Abnormal pitch perception
produced by cochlear implant stimulation. PLoS ONE. 2014;9:e88662.
5. Holden LK, Finley CC, Firszt JB, Holden TA,
Brenner C, Potts L G, et al. Factors affecting open-set word recognition in adults with cochlear implants. Ear and hearing. 2013;34(3):342.
6. Kelly AS, Purdy SC, Thorne PR.
Electrophysiological and speech perception
measures of auditory processing in experienced adult cochlear implant users. Clin Neurophysiol. 2005;116:1235-46.
7. Roman S, Canevet G, Marquis P, Triglia JM,
Liegeois-Chauvel C. Relationship between auditory perception skills and mismatch negativity recorded in free field in cochlear-implant users. Hear Res. 2005;201:10-20.
8. Naatanen R, Escera C. Mismatch negativity: clinical and other applications. Audiol Neurotol. 2000;5(3-4):105-10.
9. Gabr TA. Mismatch negativity (MMN): indexing
auditory discrimination in cochlear implants. Hear Balan Commun. 2018;16(1):21-8.
10. Hahne A, Mainka A, Leuner A, Mürbe D. Adult cochlear implant users are able to discriminate basic tonal features in musical patterns: Evidence from
event-related potentials. Otol Neurotol.
2016;37(9):360-8.
11. Obuchi C, Harashima T, Shiroma M. Auditory
evoked potentials under active and passive hearing conditions in adult cochlear implant users. Clin Exp Otorhinolaryngol. 2012;5:6-9.
12. Torppa R, Salo E, Makkonen T, Loimo H,
Pykalainen J, Lipsanen J, et al. Cortical processing of musical sounds in children with Cochlear Implants. Clin Neurophysiol. 2012;123(10):1966-79.
13. Zhang F, Benson C, Fu QJ. Cortical encoding of pitch contour changes in cochlear implant users: a A
mismatch negativity study. Audiol Neurotol. 2013;18(5):275-88.
14. Kraus N, Micco AG, Koch DB, McGee T, Carrell T,
Sharma A, et al. The mismatch negativity cortical evoked potential elicited by speech in cochlear-implant users. Hear Res. 1993;65(1-2):118-24.
15. Elkayal VSA, Mourad MI, Elbanna MM, Talaat
MAM. Evaluation of factors that influence cochlear implant performance. Advan Arab Acad Audio-Vestibul J. 2016;3:1-8.
16. Rahman TTA, Nada IM, Kader HAA, Monem
AAA. Neural representation of speech in pediatric cochlear implant recipients. Egypt J Otolaryngol. 2017;33(2):535.
17. Kileny PR, Boerst A, Zowlan T. Cognitive evoked potentials to speech and tonal stimuli in children with implants. Otolaryngol Head Neck Surg. 1997;117:161-9.
18. Gifford RH. Cochlear implant candidacy in
children: audiological considerations. In pediatric cochlear implantation. New York, NY: Springer; 2016: 27-41.
Cite this article as: Hamid M, Kotait MA, Kolkaila EA.