404 THE BALTIC JOURNAL
OF ROAD AND BRIDGE ENGINEERING 20 1 8/13 (4)
* Corresponding author. E-mail: [email protected] Copyright © 2018 The Author(s). Published by RTU Press
This is an Open Access article distributed under the terms of the Creative Commons Attribution License (http://creativecommons.org/licenses/by/4.0/), which permits unrestricted use, distribution, and reproduction in any medium, provided the original author and source are credited. ISSN 1822-427X/eISSN 1822-4288
2018 Volume 13 Issue 4: 404–415 https://doi.org/10.7250/bjrbe.2018-13.425
ROBUSTNESS OF THE MULTI-ATTRIBUTE
UTILITY MODEL FOR BRIDGE
MAINTENANCE PLANNING
ZAHARAH ALLAH BUKHSH1*, IRINA STIPANOVIC1,2,
SANDRA SKARIC PALIC2, GIEL KLANKER3
1Dept of Construction Management and Engineering, Faculty of Engineering Technology, University of Twente, Enschede, The Netherlands 2Infra Plan Consulting Ltd., Zagreb, Croatia
3Rijkswaterstaat Ministry of Infrastructure and the Environment, Utrecht, Netherlands
Received 24 November 2017; accepted 14 November 2018
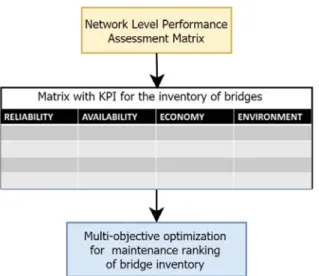
Abstract. Optimisation of maintenance planning is an essential part of bridge management. With the purpose to support maintenance planning, a multi-objective decision-making model is introduced in this paper. The model is based on multi-attribute utility theory, which is used for the optimisation process when multiple performance goals have to be taken into account. In the model, there are several parameters, which are freely chosen by the decision maker. The model is applied to the inventory of 22 bridges, where four Key Performance Indicators were determined for four performance aspects: reliability, availability, costs and environment. A sensitivity analysis is performed by changing risk tolerance parameter and attribute weights to determine the robustness of the model. The Multi-Attribute Utility model and sensitivity analysis presented in this paper will help decision-makers to examine the robustness of the optimal solution by dynamically changing the critical parameters.
405
Giel Klanker
Robustness of the Multi-Attribute Utility Model for Bridge Maintenance Planning
Introduction
406 THE BALTIC JOURNAL
OF ROAD AND BRIDGE ENGINEERING
20 1 8/13 (4)
alternating risk attitude through the risk tolerance parameters and performance attribute weights for all performance aspects. Multi-Attribute Utility Theory provides a systematic approach to decision making by accommodating multiple performance goals, uncertainty and preferences of infrastructure managers, thus enabling complex problems involving many parameters to be solved. Modern decision-making processes dealing with bridge management have to go far beyond choosing an optimal solution based on just single indicators (i.e. the lowest long-term cost). There is a need to have decision models that are capable of implementing multiple performance criteria.
1.
Multi-Attribute Utility Model
407
Giel Klanker
Robustness of the Multi-Attribute Utility Model for Bridge Maintenance Planning comparing a number of bridges. These bridges are often referred to as
alternatives in MAUT.
Multi-Attribute Utility Theory involves the single decision maker who is willing to make certain trade-off among the performance goals while exposed to uncertainty and risk (Keeney & Raiffa, 1993). The uncertainty is usually originated because of unavailable and dynamic nature of data, and involvement of multiple stakeholders. For instance, in the bridge planning the exact estimation of a number of users affected due to maintenance activity is difficult to define. Multi-Attribute Utility Theory integrates a body of mathematical utility models and a range of decision assessment methods to assist in decision ranking problem (Thevenot, Steva, Okudan, & Simpson, 2006). The single attribute utility function is calculated for each performance aspect which reflects the risk attitude of the decision maker.
The mathematical formulation of MAUT is represented as follows:
U(x) = k1U(x1) + k2U(x2) + ⋯ + knU(xn), (1)
where U(x) − multi-attribute utility value of each alternative x; k − a scaling constant that provides the relative importance of each performance indicator (attribute i); Ui(xi)− a single attribute utility value
of each performance indicator ifor the alternative x.
where U(x) − multi-attribute utility value of each alternative x; k − a scaling constant that provides the relative importance of each performance indicator (attribute i); Ui(xi)− a single attribute utility value of each performance indicator i for the alternative x.
𝑈𝑈𝑈𝑈𝑖𝑖𝑖𝑖(𝑋𝑋𝑋𝑋𝑖𝑖𝑖𝑖)=𝐴𝐴𝐴𝐴 − 𝐵𝐵𝐵𝐵𝑒𝑒𝑒𝑒 �𝑅𝑅𝑅𝑅𝑅𝑅𝑅𝑅𝑥𝑥𝑥𝑥𝑖𝑖𝑖𝑖 �
, (2)
where A and B− scaling constants; RT− risk tolerance.
The general steps to apply MAUT on decision-making problem, e.g. maintenance planning are summarised as follows:
1. Identify the decision objectives and define the attributes relevant to the problem;
2. Quantify the attributes in a form that structures and represent the defined decision objectives and goals in utility functions;
3. Calculate the single utility function for each attribute by estimating the indifference point(s) and risk attitude of a decision maker(s). These steps establish a relationship between the attributes values and their utility scores based on preferences structures of the decision maker(s);
4. Determine the relative importance of attributes build on the weighting assigned by the decision maker(s);
5. Compute the aggregative utility score for each alternative by either multiplicative form of addictive form. The total aggregative score ranks the alternatives, where an alternative that is the perfect fit in a realisation of decision objective is ranked at highest.
2. Case study
An example case is provided to illustrate the application of MAUT for the bridge maintenance planning. The objective of this decision-making exercise is to rank the bridges alternatives regarding four KPIs reliability (KPI-Condition Index (CI)), economy Maintenance Costs (MC)), environment (KPI-Environmental Costs (EC)) and availability (KPI-User Delay Costs (UDC)). The decision problem of maintenance planning presented in this case study requires the ranking of 22 bridges in an order where the condition level can be maximised, and at the same time MC, UDC and EC can be minimised. It is noted that the minimisation of one attribute might result in maximisation of the other one. For instance, to minimise the UDC an agency needs to employ more resources which result in increased owner costs. Therefore, a trade-off among these attributes has to be performed (Borgonovo & Cillo, 2017). With the definition of KPIs, the single utility function of each attribute is calculated. In this exercise, authors played the role of a decision maker to estimate the indifference point and the general risk attitudes. A decision maker is provided with a lottery question representing the 50−50% probability of having best (i.e. minimum MC) and worst (i.e. maximum MC) as shown in Figure 2. The median value between the maximum and minimum MC is called the Expected Value (EV), which is 123.73.
(2) where A and B − scaling constants; RT − risk tolerance.
The general steps to apply MAUT on decision-making problem, e.g. maintenance planning are summarised as follows:
1. Identify the decision objectives and define the attributes relevant to the problem;
2. Quantify the attributes in a form that structures and represent the defined decision objectives and goals in utility functions;
3. Calculate the single utility function for each attribute by estimating the indifference point(s) and risk attitude of a decision maker(s). These steps establish a relationship between the attributes values and their utility scores based on preferences structures of the decision maker(s);
4. Determine the relative importance of attributes build on the weighting assigned by the decision maker(s);
408 THE BALTIC JOURNAL OF ROAD AND BRIDGE ENGINEERING
20 1 8/13 (4)
2. Case study
An example case is provided to illustrate the application of MAUT for the bridge maintenance planning. The objective of this decision-making exercise is to rank the bridges alternatives regarding four KPIs reliability (KPI-Condition Index (CI)), economy (KPI-Maintenance Costs (MC)), environment (KPI-Environmental Costs (EC)) and availability (KPI-User Delay Costs (UDC)). The decision problem of maintenance planning presented in this case study requires the ranking of 22 bridges in an order where the condition level can be maximised, and at the same time MC, UDC and EC can be minimised. It is noted that the minimisation of one attribute might result in maximisation of the other one. For instance, to minimise the UDC an agency needs to employ more resources which result in increased owner costs. Therefore, a trade-off among these attributes has to be performed (Borgonovo & Cillo, 2017). With the definition of KPIs, the single utility function of each attribute is
Figure 2. Lottery question to discern Maintenance Costs
Figure 3. Single Utility Score of Maintenance Costs probability (p)
probability (p)
Maintenance Costs, u/m2
409
Giel Klanker
Robustness of the Multi-Attribute Utility Model for Bridge Maintenance Planning calculated. In this exercise, authors played the role of a decision maker to
estimate the indifference point and the general risk attitudes. A decision maker is provided with a lottery question representing the 50−50% probability of having best (i.e. minimum MC) and worst (i.e. maximum MC) as shown in Figure 2. The median value between the maximum and minimum MC is called the Expected Value (EV), which is 123.73.
In practice, an owner is often unable to achieve minimum costs as desired. Therefore, MAUT has a concept of Certainty Equivalent (CE) which is the indifference point of a decision maker between the maximum (worst) and minimum (best) maintenance costs. In this case,
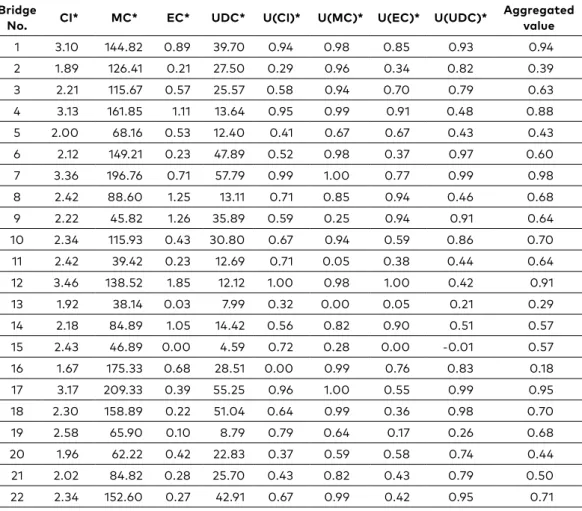
Table 1. Multi-Attribute Utility model results for a group of 22 bridges
Bridge
No. CI* MC* EC* UDC* U(CI)* U(MC)* U(EC)* U(UDC)* Aggregatedvalue
1 3.10 144.82 0.89 39.70 0.94 0.98 0.85 0.93 0.94
2 1.89 126.41 0.21 27.50 0.29 0.96 0.34 0.82 0.39
3 2.21 115.67 0.57 25.57 0.58 0.94 0.70 0.79 0.63
4 3.13 161.85 1.11 13.64 0.95 0.99 0.91 0.48 0.88
5 2.00 68.16 0.53 12.40 0.41 0.67 0.67 0.43 0.43
6 2.12 149.21 0.23 47.89 0.52 0.98 0.37 0.97 0.60
7 3.36 196.76 0.71 57.79 0.99 1.00 0.77 0.99 0.98
8 2.42 88.60 1.25 13.11 0.71 0.85 0.94 0.46 0.68
9 2.22 45.82 1.26 35.89 0.59 0.25 0.94 0.91 0.64
10 2.34 115.93 0.43 30.80 0.67 0.94 0.59 0.86 0.70
11 2.42 39.42 0.23 12.69 0.71 0.05 0.38 0.44 0.64
12 3.46 138.52 1.85 12.12 1.00 0.98 1.00 0.42 0.91
13 1.92 38.14 0.03 7.99 0.32 0.00 0.05 0.21 0.29
14 2.18 84.89 1.05 14.42 0.56 0.82 0.90 0.51 0.57
15 2.43 46.89 0.00 4.59 0.72 0.28 0.00 -0.01 0.57
16 1.67 175.33 0.68 28.51 0.00 0.99 0.76 0.83 0.18
17 3.17 209.33 0.39 55.25 0.96 1.00 0.55 0.99 0.95
18 2.30 158.89 0.22 51.04 0.64 0.99 0.36 0.98 0.70
19 2.58 65.90 0.10 8.79 0.79 0.64 0.17 0.26 0.68
20 1.96 62.22 0.42 22.83 0.37 0.59 0.58 0.74 0.44
21 2.02 84.82 0.28 25.70 0.43 0.82 0.43 0.79 0.50
22 2.34 152.60 0.27 42.91 0.67 0.99 0.42 0.95 0.71
410 THE BALTIC JOURNAL OF ROAD AND BRIDGE ENGINEERING
20 1 8/13 (4)
the chosen CE is 90. Considering the risk tolerance value of 70, Eq. (2) becomes:
Figure 2. Lottery question to discern Maintenance Costs
In practice, an owner is often unable to achieve minimum costs as desired. Therefore, MAUT has a concept of Certainty Equivalent (CE) which is the indifference point of a decision maker between the maximum (worst) and minimum (best) maintenance costs. In this case, the chosen CE is 90. Considering the risk tolerance value of 70, Eq. (2) becomes:
𝑈𝑈𝑈𝑈
𝑖𝑖𝑖𝑖(𝑋𝑋𝑋𝑋𝑖𝑖𝑖𝑖)= 1.09
−
1.88
𝑒𝑒𝑒𝑒�70𝑥𝑥𝑥𝑥𝑖𝑖𝑖𝑖�
.
(3)
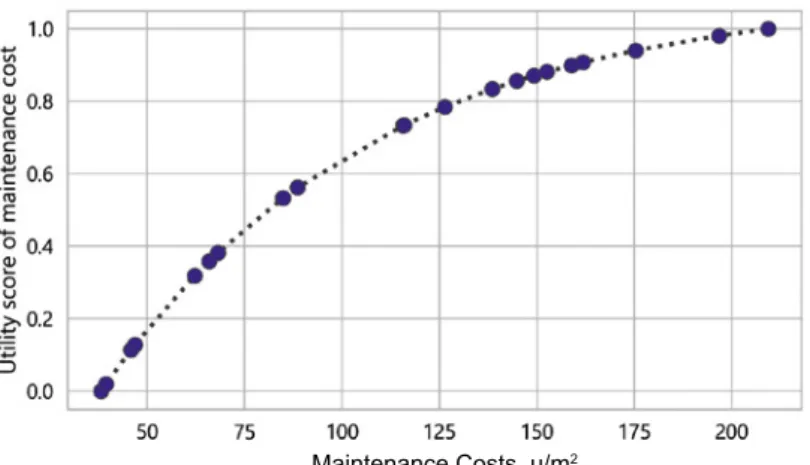
The single utility function of MC (i. e. U(MC)) reduces the values from 0 to 1 representing the utility values of real numbers concerning the defined objective. Figure 3 shows the graph of MC concerning the assigned utility values.
Figure 3. Single Utility Score of Maintenance Costs
Single utility scores of downtime (UDC), condition rating (CI) and environmental costs (EC) are computed in the same manner. Table 1 shows the actual data and the computed single utility value of each performance indicator. Finally, to obtain the total aggregative value for each bridge, where the additive multiple attribute function shown in Eq. (1) is used. The relative importance of performance indicators is defined by k factor considering the possibility of having
(3) The single utility function of MC (i. e. U(MC)) reduces the values from 0 to 1 representing the utility values of real numbers concerning the defined objective. Figure 3 shows the graph of MC concerning the assigned utility values.
Single utility scores of downtime (UDC), condition rating (CI) and environmental costs (EC) are computed in the same manner. Table 1 shows the actual data and the computed single utility value of each performance indicator. Finally, to obtain the total aggregative value for each bridge, where the additive multiple attribute function shown in Eq. (1) is used. The relative importance of performance indicators is defined by k factor considering the possibility of having the multiple performance goals. A direct rating method is used as represented below:
the multiple performance goals. A direct rating method is used as represented below:
𝑘𝑘𝑘𝑘(𝑥𝑥𝑥𝑥𝑖𝑖𝑖𝑖) = 𝑟𝑟𝑟𝑟𝑟𝑟𝑟𝑟𝑟𝑟𝑟𝑟𝑒𝑒𝑒𝑒(𝑥𝑥𝑥𝑥𝑖𝑖𝑖𝑖) ∑𝑛𝑛𝑛𝑛𝑗𝑗𝑗𝑗=1(𝑥𝑥𝑥𝑥𝑗𝑗𝑗𝑗), (4)
where k(xi) − weighting factor of each attribute i across all alternatives; rate(xi) −
rate/weight assigned by an expert for attribute i.
Table 1. Multi-Attribute Utility model results for a group of 22 bridges Bridge
No. CI* MC* EC* UDC* U(CI)* U(MC)* U(EC)* U(UDC)* Aggregated value 1 3.10 144.82 0.89 39.70 0.94 0.98 0.85 0.93 0.94 2 1.89 126.41 0.21 27.50 0.29 0.96 0.34 0.82 0.39 3 2.21 115.67 0.57 25.57 0.58 0.94 0.70 0.79 0.63 4 3.13 161.85 1.11 13.64 0.95 0.99 0.91 0.48 0.88 5 2.00 68.16 0.53 12.40 0.41 0.67 0.67 0.43 0.43 6 2.12 149.21 0.23 47.89 0.52 0.98 0.37 0.97 0.60 7 3.36 196.76 0.71 57.79 0.99 1.00 0.77 0.99 0.98 8 2.42 88.60 1.25 13.11 0.71 0.85 0.94 0.46 0.68 9 2.22 45.82 1.26 35.89 0.59 0.25 0.94 0.91 0.64 10 2.34 115.93 0.43 30.80 0.67 0.94 0.59 0.86 0.70 11 2.42 39.42 0.23 12.69 0.71 0.05 0.38 0.44 0.64 12 3.46 138.52 1.85 12.12 1.00 0.98 1.00 0.42 0.91 13 1.92 38.14 0.03 7.99 0.32 0.00 0.05 0.21 0.29 14 2.18 84.89 1.05 14.42 0.56 0.82 0.90 0.51 0.57 15 2.43 46.89 0.00 4.59 0.72 0.28 0.00 -0.01 0.57 16 1.67 175.33 0.68 28.51 0.00 0.99 0.76 0.83 0.18 17 3.17 209.33 0.39 55.25 0.96 1.00 0.55 0.99 0.95 18 2.30 158.89 0.22 51.04 0.64 0.99 0.36 0.98 0.70 19 2.58 65.90 0.10 8.79 0.79 0.64 0.17 0.26 0.68 20 1.96 62.22 0.42 22.83 0.37 0.59 0.58 0.74 0.44 21 2.02 84.82 0.28 25.70 0.43 0.82 0.43 0.79 0.50 22 2.34 152.60 0.27 42.91 0.67 0.99 0.42 0.95 0.71
*Note: CI − Condition Index; MC − Maintenance Costs; EC − EnvironmentalCosts; UDC
− User Delay Costs; U(CI) − Utility of Condition Index; U(MC) − Utility of Maintenance Costs; U(EC) − Utility of EnvironmentalCosts; U(UDC) − Utility of User Delay Costs.
Based on the aggregated values, the ranking of the bridges can be performed, where multiple performance goals are taken into account, i.e. the MC is kept at minimum and CI is maximised.
(4)
where k(xi) − weighting factor of each attribute i across all alternatives;
rate(xi) − rate/weight assigned by an expert for attribute i.
Based on the aggregated values, the ranking of the bridges can be performed, where multiple performance goals are taken into account, i.e. the MC is kept at minimum and CI is maximised.
3. Robustness assessment of Multi-Attribute
Utility model for risk attitude
The risk attitude of the decision maker is categorised as risk-taking, risk-averse, and risk-neutral. Figure 4 shows the resulting utility graph based on the risk attitude of the decision maker. The utility values are shown by plotting the attribute values in x-axis and utility values on
y-axis ranging from 0 to 1. A risk avoiding attitude result into a concave down graph of utility values whereas risk-taking preferences show the concave up a graph of utility values.
The robustness of the multi-attribute model is assessed by performing the local sensitivity analysis. The local sensitivity analysis captures the effect on the output of the model due to a small change in input parameters., There are two subjective measures in the multi-attribute model that must be defined by a decision maker. The subjective measures are risk attitude of decision makers and the
1.09 – 1.88
Figure 2. Lottery question to discern Maintenance Costs
In practice, an owner is often unable to achieve minimum costs as desired. Therefore, MAUT has a concept of Certainty Equivalent (CE) which is the indifference point of a decision maker between the maximum (worst) and minimum (best) maintenance costs. In this case, the chosen CE is 90. Considering the risk tolerance value of 70, Eq. (2) becomes:
𝑈𝑈𝑈𝑈
𝑖𝑖𝑖𝑖(𝑋𝑋𝑋𝑋𝑖𝑖𝑖𝑖)= 1.09
−
1.88
𝑒𝑒𝑒𝑒�70 𝑥𝑥𝑥𝑥𝑖𝑖𝑖𝑖�
.
(3)
The single utility function of MC (i. e. U(MC)) reduces the values from 0 to 1 representing the utility values of real numbers concerning the defined objective. Figure 3 shows the graph of MC concerning the assigned utility values.
Figure 3. Single Utility Score of Maintenance Costs
411
Giel Klanker
Robustness of the Multi-Attribute Utility Model for Bridge Maintenance Planning
weights assigned to each attribute by decision maker as shown in Chapter 1.
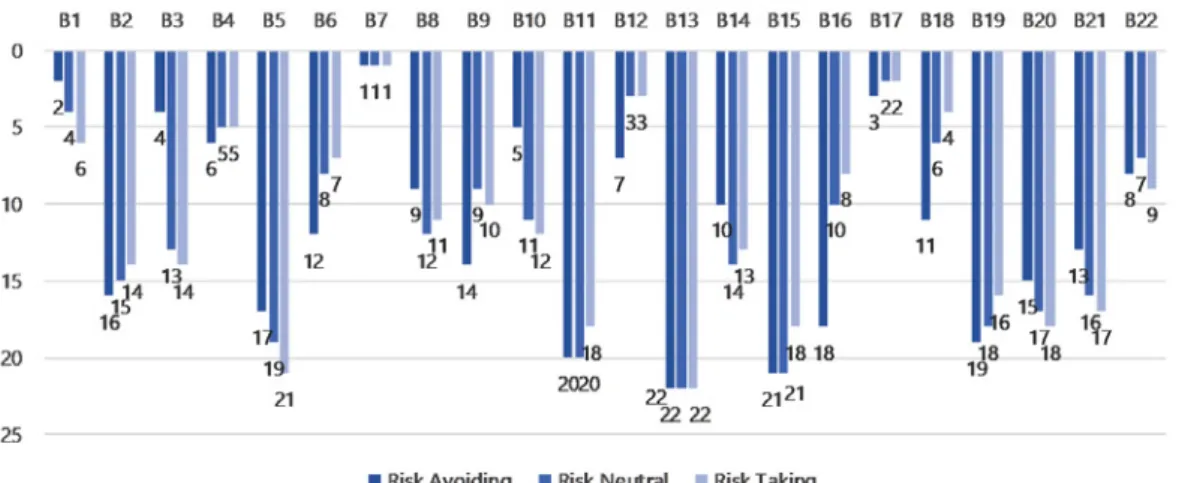
The multi-attribute model is executed with the same set of 22 bridges to analyse the change in the ranking of bridges due to different risk attitudes. All the attributes were assigned equal weights of 0.5 since the idea is to access the difference in ranking with the change in risk attitude only. Figure 5 shows the ranking of 22 bridges concerning risk attitude. The shorter bar represents the higher rank; the longer bars represent low rank.
Three main trends in the ranking of the bridges with different risk scores are noticed. First, there was no or minor difference in ranking of the bridge with different risk attitude, e.g. B7, B13, B17, B22, and B2. Second, with risk avoiding attitude the bridge ranked higher than with Figure 4. Risk Attitudes of the decision maker
412 THE BALTIC JOURNAL OF ROAD AND BRIDGE ENGINEERING
20 1 8/13 (4)
risk-taking. For instance, with risk avoiding, B1 is ranked as the second highest because the condition score (CI) of B1 is considerable high while the MC are low. The similar pattern is noticed with B10 and B8. The third and final pattern shows the risk-taking attitude has assigned higher scores to the bridge as compared to the risk avoiding. Take the example of B6 where risk-taking has ranked it at number 7, while with risk avoidance it is ranked at 12, the difference in rank is because of the higher magnitude values of MC and UDC of B6.
To summarise, in addition to the risk attitude of a decision maker, the actual magnitude of the values plays a more significant role in ranking. It is because a decision maker states his risk attitude over actual data values, instead of computed utility scores.
4. Robustness assessment of Multi-Attribute
Utility model for attributes weights
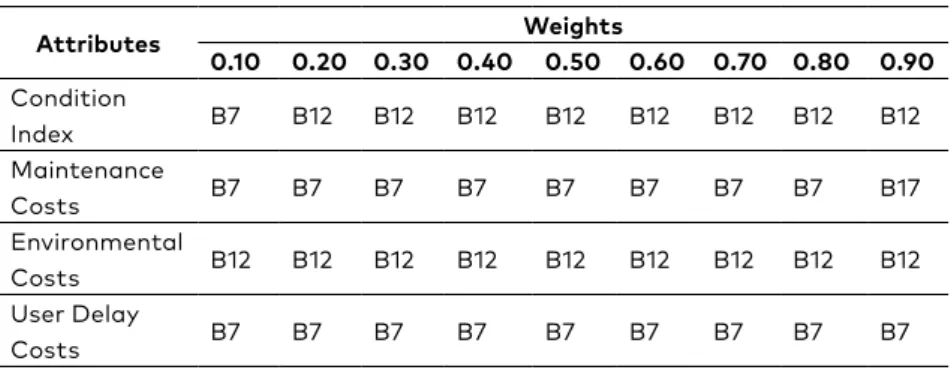
Similar to risk attribute assessment, the sensitivity analysis is performed to access the effect on the ranking of a bridge by changing the weights assigned to each attribute. A single-attribute and two-attribute sensitivity analysis are performed to analyse the sensitivity of ranking concerning attributes weights. In the single-attribute analysis, the weights of a single attribute are changed over the range from 0.1 to 0.9 while the weights for other attributes were kept as small as 0.05. Table 2 shows the result of one-attribute sensitivity analysis outlining the highest ranked bridge. The result of the one-attribute analysis shows that the irrespective of assigned weights the highest ranked does not change considerably. However, a substantial change in the ranking of the bridge is noted as the difference between the dynamic weight assigned
Table 2. Single-attribute sensitivity analysis for each attribute
Attributes Weights
0.10 0.20 0.30 0.40 0.50 0.60 0.70 0.80 0.90 Condition
Index B7 B12 B12 B12 B12 B12 B12 B12 B12
Maintenance
Costs B7 B7 B7 B7 B7 B7 B7 B7 B17
Environmental
Costs B12 B12 B12 B12 B12 B12 B12 B12 B12
User Delay
413 to a single attribute (ranging from 0.1 to 0.9) increases compared to the constant weight of other attributes (e.g. 0.7 or 0.9). An interested reader may refer to the MAUT online tool (https://maut.shinyapps.io/ application_of_maut/) for further analysis.
Moreover, two-attributes sensitivity analysis is also conducted to see the effect on the ranking of bridges, when the weights of two attributes are changed simultaneously. Table 3 shows the highest ranked bridge generated by changing the weights of CI over row and MC over the column. The result of the two-attribute analysis suggests that the model is robust and the assigned weights do not influence much on the bridge ranks.
The possible reason for the static rank of the bridges while having variable weights of the attribute is because the weights are assigned to the calculated utility scores as shown in Chapter 1. It is noted that the ranking of the bridges is sensitive to the risk attitude of a decision maker, where the preference is defined over the real values of attributes.
Conclusions
Within the Working Group 2 of COST Action TU1406 Quality Specifications for Roadway Bridges, Standardization at a European Level (BridgeSpec), a multi-objective decision-making model is developed to support bridge maintenance planning. The model was applied to the group of twenty-two bridges, where a trade-off among different performance attributes had to be performed. In the study four performance aspects, reliability, availability, cost and environment were quantified and used as an input parameter for Multi-Attribute Utility model. For each performance attribute a single utility function has been
C
ondi
ti
on
Ind
ex
0.10 Bridge 7 Bridge 7 Bridge 7 Bridge 7 Bridge 7 Bridge 7 Bridge 7 Bridge 7 0.20 Bridge 7 Bridge 7 Bridge 7 Bridge 7 Bridge 7 Bridge 7 Bridge 7
0.30 Bridge 7 Bridge 7 Bridge 7 Bridge 7 Bridge 7 Bridge 7 0.40 Bridge 7 Bridge 7 Bridge 7 Bridge 7 Bridge 7
0.50 Bridge 7 Bridge 7 Bridge 7 Bridge 7 0.60 Bridge 7 Bridge 7 Bridge 7
0.70 Bridge 7 Bridge 7 0.80 Bridge 7
414 THE BALTIC JOURNAL OF ROAD AND BRIDGE ENGINEERING
20 1 8/13 (4)
determined, and finally, the aggregative utility score for each alternative has been computed by either multiplicative form of addictive form. The total aggregative score is then used for ranking the alternatives, where an alternative which is the perfect fit in a realisation of decision objective is ranked at highest. The primary purpose of this paper was to determine the robustness of the model. The sensitivity analysis is conducted by alternating risk attitude through the risk tolerance parameter and performance attribute weights for all performance aspects. Principal conclusions from this study are the following:
1. Utility functions of Multi-Attribute Utility Theory appropriately account for the involved uncertainty and risk attitude of infrastructure managers. Multi-Attribute Utility Theory provides a systematic approach for decision making of maintenance planning by accommodating multiple performance goals, uncertainty and preferences of infrastructure managers thus enabling complex problems involving many parameters to be solved.
2. Regarding the impact of risk attitude on the final ranking, there was no or minor difference in ranking of bridges with different risk attitude. In addition to the risk attitude of a decision maker, the actual magnitude of the values plays a significant role in final ranking of the alternatives.
3. A single-attribute and two-attribute sensitivity analysis are conducted to access the effect of the weights assigned to each performance attribute. In the single-attribute analysis, the weights of a single attribute are changed over the range from 0.1 to 0.9 while the weights for other attributes were kept as small as 0.05. The results of the one-attribute analysis show that the irrespective of assigned weights the highest ranked does not change considerably. An online tool is made available to enable the reader for further analysis. The results of the two-attribute analysis suggest that the model is robust and the assigned weights do not influence much on the bridge ranks.
Finally, we can conclude that the implementation of Multi-Attribute Utility Theory model can help decision-makers to find the optimal solution for the bridge maintenance planning while taking multiple performance goals into account.
Acknowledgement
415
Giel Klanker
Robustness of the Multi-Attribute Utility Model for Bridge Maintenance Planning
REFERENCES
Allah Bukhsh, Z. , Oslakovic, I. S., Klanker, G., Hoj, N. P., Imam, B., & Xenidis, Y. (2017). Multi-criteria decision making: AHP method applied for network bridge prioritization. In Joint COST TU1402–COST TU1406–IABSE WC1 Workshop: The value of Structural Health Monitoring for the reliable Bridge Management http://www.tu1406.eu/wpcontent/uploads/2017/05/TU1406_ ZAGREB_EBOOK. pdf.
Allah Bukhsh, Z., Saeed, A., & Stipanovic I. (2018). A machine learning approach for maintenance prediction of railway assets, In Proc of 7th Transport Research Arena TRA 2018, April 16-19, 2018, Vienna, Austria
Allah Bukhsh, Z., Stipanovic, I., Klanker, G., O’Connor, A., & Doree, A. G. (2018). Network level bridges maintenance planning using Multi-Attribute Utility Theory. Structure and infrastructure engineering, 1-14.
https://doi.org/10.1080/15732479.2017.1414858
Borgonovo, E., & Cillo, A. (2017). Deciding with thresholds: Importance measures and value of information. Risk Analysis, 37(10), 1828-1848.
https://doi.org/10.1111/risa.12732
Das, P., Micic, T., & Chryssanthopoulos, M. (1999). Reliability-based Assessment of Highway Bridges.
Egger, M. (2012). Benchmarking of Expenditures and Practices of Maintenance and Operation (BEXPRAC). Procedia-Social and Behavioral Sciences, 48, 1733-1742. https://doi.org/10.1016/j.sbspro.2012.06.1148
ERA-NET ROAD (2012, November). Inventory Bridge Management practices, Asset Service Condition Assessment Methodology (ASCAM), Deliverable No. 3. ASCAM-R3, Final report.
Ishizaka, A., & Nemery, P. (2013). Multi-criteria decision analysis: methods and software. John Wiley & Sons.
Keeney, R. L., & Raiffa, H. (1993). Decisions with multiple objectives: preferences and value trade-offs. Cambridge university press.
Núñez, A., Hendriks, J., Li, Z., De Schutter, B., & Dollevoet, R. (2014, October). Facilitating maintenance decisions on the Dutch railways using big data: The ABA case study. In Big Data (Big Data), 2014 IEEE International Conference on (pp. 48-53). IEEE. https://doi.org/10.1109/BigData.2014.7004431
Strauss, A., & Mandić Ivanković, A. (2016). Performance indicators for
roadway bridges of COST Action TU1406. WG1 Technical report). ISBN 978-3-900932-41-1.
Thevenot, H. J., Steva, E. D., Okudan, G. E., & Simpson, T. W. (2006, January). A multi-attribute utility theory-based approach to product line consolidation and selection. In ASME 2006 International Design Engineering Technical Conferences and Computers and Information in Engineering Conference (pp. 441-450). American Society of Mechanical Engineers.