Original Research Article
Cancer frequency: Kars province
Yasemen Adali
1*, Bülent Güvendi
2, Tuğba Toyran
3, Gülname Fındik Güvendi
4INTRODUCTION
Malignant tumors are important causes of mortality and morbidity in the world. These tumors are the leading causes of death in developed countries and they are the second most common cause deaths after cardiac diseases in developing countries.1 The incidence of tumors in
which a large number of etiologic agents are identified and continued to be investigated, varies according to age, gender and geographical location. These differences in the world stand out among the countries and even cities. Turkey is located in West Asia region when the world is divided into 22 regions based on cancer frequency and
mortality rates considering the geographical characteristics and living conditions.2 Despite the increase in cancer registry comprehensibility in our country, there are still shortcomings in the reports even though the rates are more accurate compared to previous years. It is important to determine the frequency of cancer for many reasons, especially for the mortality, morbidity, reduction of quality of life, negative effects on personal and national economy. Assessment of overall cancer incidence in Turkey, it is reported to be 221.5 per hundred thousands, and most frequent cancer seen among women is breast and lung among men.3 When the studies
conducted in different cities within the country are
1Department of Pathology, Çanakkale Onsekiz Mart University Medical Faculty, Çanakkale, Turkey 2Department of General Surgery, Rize Recep Tayyip Erdoğan University Medical Rize, Turkey 3Department of Pathology, Adana State Hospital, Adana, Turkey
4Department of Pathology, Rize Recep Tayyip Erdoğan University Medical Rize, Turkey
Received: 23 February 2019
Accepted: 11 March 2019
*Correspondence:
Dr. Yasemen Adali,
E-mail: yasemenadali@hotmail.com
Copyright: © the author(s), publisher and licensee Medip Academy. This is an open-access article distributed under the terms of the Creative Commons Attribution Non-Commercial License, which permits unrestricted non-commercial use, distribution, and reproduction in any medium, provided the original work is properly cited.
DOI: http://dx.doi.org/10.18203/2320-6012.ijrms20191078
ABSTRACT
Background: Malignant tumors are important causes of mortality and morbidity in the world. It is known that the incidence of tumors- in which a large number of etiologic agents are identified and continued to be investigated- varies according to age, gender and geographical location. This study aimed to determine the prevalence and localization distributions of malignant tumors in Kars.
Methods: The study included 17012 patients whose biopsy materials were evaluated in the Department of Pathology of Kafkas University Health Research and Practice Hospital between 2014-2017.
Results: The mean age of all cancer cases was 63.3±14.8 and the median age was 63. The cancer frequency was detected 22.6% in 2014, 23.3% in 2015, 26.9% in 2016 and 27.2% in 2017 with general slight male dominance.
Conclusions: The incidence of cancer in our country is found to be lower compared to the world data. It is necessary to examine and take into account the regional and city-based cancer statistics that serve as an important key stone in the planning of health policies and health investments in our country. Regional data is not only important for treatment services, but also for preventive health services and early diagnosis.
evaluated; İzmir and Konya showed similar results to overall Turkey's datas with highest rates of breast cancer among women and lung among men.4,5 In a study
conducted in Van, the most common cancer among women is reported to as esophagus cancer and prostate cancer among men, and in Corum, the most common cancer among both men and women has been reported as skin cancer.6,7 In this present study, it was aimed to
determine the prevalence, age, sex and localization distributions of malignant tumors in Kars, which is one of border cities in Eastern Anatolia region.
METHODS
The study included 17012 patients whose biopsy materials were evaluated in the Department of Pathology of Kafkas University Health Research and Practice Hospital between 2014-2017. Cases with suspected diagnosis and cases with only cytology material were excluded from the study. Frequency analyzes and statistical evaluations of the data obtained by scanning the pathology reports in the hospital information management system were performed with SPSS 15.0 package program. Patients with tumor recurrence were
evaluated with the first biopsy diagnoses. Incisional and excisional biopsy reports were evaluated together for final data analysis in cases who have both. Gender, age, organ and system distributions of 663 cases diagnosed with cancer were determined.
RESULTS
The mean age of all cancer cases was 63.3±14.8 and the median age was 63. The mean age of the cases in 2014 was 65.5±13.4, in 2015: 63.4±16.9, in 2016: 60.9±15.9 and in 2017: 63.8±12.8. When the age distribution of the cases was analyzed according to years, it was observed that the mean of 2014 was statistically higher than that of 2016 (p = 0.011), but there was no difference between the other years (p>0.05). Of all the cases, 291 (43.9%) were female and 372 (56.1%) were male. When the general tumor frequency was evaluated with chi-square test between male and female cases, it was found that the frequency of tumors in male cases was statistically higher than female cases (p=0.002).
Table 1: Distribution of cancer cases by years and the cancer frequency in women and men.
Year Number of biopsies (N/%) General (N/%) Women (N/%) Men (N/%)
2014 3851 (22.6) 206 (31.1) 69 (33.5) 137 (66.5) 2015 3958 (23.3) 138 (20.8) 54 (39.1) 84 (60.9) 2016 4582 (26.9) 167 (25.2) 84 (53.3) 83 (49.7) 2017 4621 (27.2) 152 (22.9) 84 (55.3) 68 (44.7) Total 17012 (100) 663 (100) 291 (43.9) 372 (56.1)
Table 2: General and yearly distribution of cancer cases by organ.
Localization (organ) General (N/%) 2014 (N/%) 2015 (N/%) 2016 (N/%) 2017 (N/%)
Stomach 95 (14.3) 10 (19.4) 17 (12.3) 17 (10.2) 21 (13.8)
Colorectum 86 (13.0) 27 (13.1) 15 (10.9) 24 (14.4) 20 (13.2)
Eosophagus 22 (3.3) 9 (4.4) 4 (2.9) 4 (2.4) 5 (3.3)
Skin 75 (11.3) 28 (13.6) 18 (13.0) 11 (6.6) 18 (11.8)
Soft tissue 5 (0.8) 1 (0.5) 3 (2.2) 0 (0) 1 (0.7)
Prostate 79 (11.9) 28 (13.6) 13 (9.4) 21 (12.6) 17 (11.2)
Urinary bladder 55 (8.3) 17 (8.3) 14 (10.1) 12 (7.2) 12 (7.9)
Breast 80 (12.1) 8 (3.9) 14 (10.1) 38 (22.8) 20 (13.2)
Thyroid 92 (13.9) 29 (14.1) 19 (13.8) 26 (15.6) 18 (11.8)
Kidney 9 (1.4) 1 (0.5) 4 (2.9) 3 (1.8) 1 (0.7)
Nasopharynx 3 (0.5) 3 (1.5) 1 (0.7) 1 (0.6) 0 (0)
Lymphoid 8 (1.2) 2 (1.0) 3 (2.2) 1 (0.6) 1 (0.7)
Brain 4 (0.6) 3 (1.5) 2 (%1.4) 0 (0) 0 (0)
Bone 4 (0.6) 4 (1.9) 1 (0.7) 0 (0) 0 (0)
Lung 8 (1.2) 1 (0.5) 3 (2.2) 1 (0.6) 0 (0)
Endometrium 19 (2.9) 3 (1.5) 2 (1.4) 3 (1.8) 13 (8.6)
Uterine cervix 4 (0.6) 1 (0.5) 0 (0) 1 (0.6) 0 (0)
Salivary gland 5 (0.8) 1 (0.5) 1 (0.7) 1 (0.6) 2 (1.3)
Ovary 5 (0.8) 0 (0) 1 (0.7) 1 (0.6) 3 (2.0)
Larynx 2 (0.3) 0 (0) 2 (1.4) 0 (0) 0 (0)
Galbladder 1 (0.1) 0 (0) 1(0.7) 0 (0) 0 (0)
Testis 1 (0.1) 0 (0) 0 (0) 1 (0.6) 0 (0)
Adrenal 1 (0.1) 0 (0) 0 (0) 1 (0.6) 0 (0)
Table 3: General and yearly distribution of cancer cases by system.
Localization (System) General (N/%) 2014 (N/%) 2015 (N/%) 2016 (N/%) 2017 (N/%)
Gastrointestinal 204 (30.8) 76 (36.9) 37 (26.8) 45 (26.9) 46 (30.3) Urogenital 144 (21.7) 46 (22.3) 31 (22.5) 37 (22.2) 30 (19.7) Head-neck 10 (1.5) 2 (1.0) 4 (2.9) 2 (1.2) 2 (1.3) Skin 75 (11.3) 28 (13.6) 18 (13.0) 11 (6.6) 18 (11.8) Soft tissue-bone 9 (1.4) 4 (1.9) 4 (2.9) 0 (0) 1 (7) Female genital 28 (4.2) 4 (1.9) 3 (2.2) 5 (3.0) 16 (10.5) Lymphoid 8 (1.2) 3 (1.5) 3 (2.2) 1 (0.6) 1 (0.7) Breast 80 (12.1) 8 (3.9) 14 (10.1) 38 (22.8) 20 (13.2) Endocrine 93 (14.0) 29 (14.1) 19 (13.8) 27 (16.2) 18 (11.8)
Lung 8 (1.2) 4 (1.9) 3 (2.2) 1 (0.6) 0 (0)
Brain 4 (0.6) 2 (1.0) 2 (1.4) 0 (0) 0 (0)
Total 663 (100.0) 206 (100) 138 (100.0) 167 (100) 152 (100)
Table 4: General and yearly distribution of cancer cases by organ in women.
Localization (organ) General (N/%) 2014 (N/%) 2015 (N/%) 2016 (N/%) 2017 (N/%)
Stomach 27(9.3) 9 (13.0) 3 (5.6) 3 (3.6) 12 (14.3) Colorectum 40 (13.7) 13 (18.8) 6 (11.1) 11 (13.1) 10 (11.9) Eosophagus 7 (2.4) 2 (2.9) 2 (3.7) 1 (1.2) 2 (2.4) Skin 23 (7.9) 7 (10.1) 7 (13.0) 4 (4.8) 5 (6.0) Soft tissue 2 (0.7) 0 (0) 2 (3.7) 0 (0) 0 (0) Urinary bladder 8 (2.7) 1 (1.4) 0 (0) 2 (2.4) 5 (6.0) Breast 77 (26.5) 8 (11.6) 12 (22.2) 38 (45.2) 19 (22.6) Thyroid 68 (23.4) 21 (30.4) 14 (25.9) 19 (22.6) 14 (16.7)
Kidney 3 (1.0) 1 (1.4) 2 (3.7) 0 (0) 0 (0)
Lymphoid 3 (1.0) 1 (1.4) 2 (3.7) 0 (0) 0 (0)
Brain 1 (0.3) 1 (1.4) 0 (0) 0 (0) 0 (0)
Bone 1 90.3) 1 (1.4) 0 (0) 0 (0) 0 (0)
Lung 1 90.3) 0 (0) 0 (0) 1 (1.2) 0 (0)
Endometrium 19 (6.5) 1 (1.4) 2 (3.7) 3 (3.6) 13 (15.5) Uterine Cervix 3 (1.0) 2 (2.9) 0 (0) 1 (1.2) 0 (0) Salivary gland 2 (0.7) 1 (1.4) 0 (0) 0 (0) 1 (1.2)
Ovary 5 (1.7) 0 (0) 1 (1.9) 1 (1.2) 3 (3.6)
Gallbladder 1 (0.3) 0 (0) 1 (1.9) 0 (0) 0 (0)
Adrenal 1 90.3) 0 (0) 0 (0) 0 (0) 0 (0)
Total 291 (100) 69 (100) 54 (100) 84 (100) 84 (100)
Table 5: General and yearly distribution of cancer cases by system in women.
Localization (System) General (N/%) 2014 (N/%) 2015 (N/%) 2016 (N/%) 2017 (N/%)
Gastrointestinal 75 (25.8) 24 (34.8) 12 (22.2) 15 (17.9) 24 (28.6) Urogenital 11 (3.8) 2 (2.9) 2 (3.7) 2.4 (2.4) 5 (6)
Head-neck 2 (0.7) 1 (1.4) 0 (0) 0 (0) 1 (1.2)
Skin 23 (7.9) 7 (10.1) 7 (13.0) 4 (4.8) 5 (6.0) Soft tissue-bone 3 (1.0) 1 (1.4) 2 (3.7) 0 (0) 0 (0) Female genital 27 (9.3) 3 (4.3) 3 (5.6) 5 (6.0) 16 (19.0)
Lymphoid 3 (1.0) 1 (1.4) 2 (3.7) 0 (0) 0 (0)
Breast 77 (26.5) 8 (11.6) 12 (22.2) 38 (45.2) 19 (22.6) Endocrine 68 (23.4) 21 (30.4) 14 (25.9) 19 (22.5) 14 (16.7)
Lung 1 (0.3) 0 (0) 0 (0) 1 (1.2) 0 (0)
Brain 1 (0.3) 1 (1.4) 0 (0) 0 (0) 0 (0)
Table 6: General and yearly distribution of cancer cases by organ in men.
Localization (organ) General (N/%) 2014 (N/%) 2015 (N/%) 2016 (N/%) 2017 (N/%)
Stomach 68 (18.3) 31 (22.6) 14 (16.7) 14 (16.9) 9 (13.0) Colorectum 46 (12.4) 14 (10.2) 9 (10.7) 13 (15.7) 10 (14.5) Eosophagus 15 (4.0) 7 (5.1) 2 (2.4) 3 (3.6) 3 (4.3) Skin 52 (14.0) 21 (15.3) 11 (13.1) 7 (8.4) 14 (20.3) Soft tissue 3 (0.8) 1 (0.7) 1 (1.2) 0 (0) 1 (1.4) Prostate 79 (21.2) 28 (20.4) 13 (15.5) 21 (25.3) 17 (24.6) Urinary bladder 47 (12.6) 16 (11.7) 14 (16.7) 10 (12.0) 7 (10.1) Breast 3 (0.8) 0 (0) 2 (2.4) 0 (0) 1 (1.4) Thyroid 24 (6.5) 8 (5.8) 5 (6.0) 7 (8.4) 4 (5.8) Kidney 6 (1.6) 0 (0) 2 (2.4) 3 (3.6) 1 (1.4) Nasopharynx 3 (0.8) 1 (0.7) 1 (1.2) 1 (1.2) 0 (0) Lymphoid 5 (1.3) 2 (1.5) 1 (1.2) 1 (1.2) 1 (1.4) Brain 3 (0.8) 1 (0.7) 2 (2.4) 0 (0) 0 (0) Bone 3 (0.8) 2 (1.5) 1 (1.2) 0 (0) 0 (0)
Lung 7 (1.9) 4 (2.9) 3 (3.6) 0 (0) 0 (0)
Salivary gland 3 (0.8) 0 (0) 1 (1.2) 1 (1.2) 1 (1.4) Larynx 2 (0.5) 0 (0) 2 (2.4) 0 (0) 0 (0) Testis 1 (0.3) 0 (0) 0 (0) 1 (1.2) 0 (0) Adrenal 1 (0.3) 0 (0) 0 (0) 1 (1.2) 0 (0) Total 372 (100) 137 (100) 84 (100) 83 (100) 68 (100)
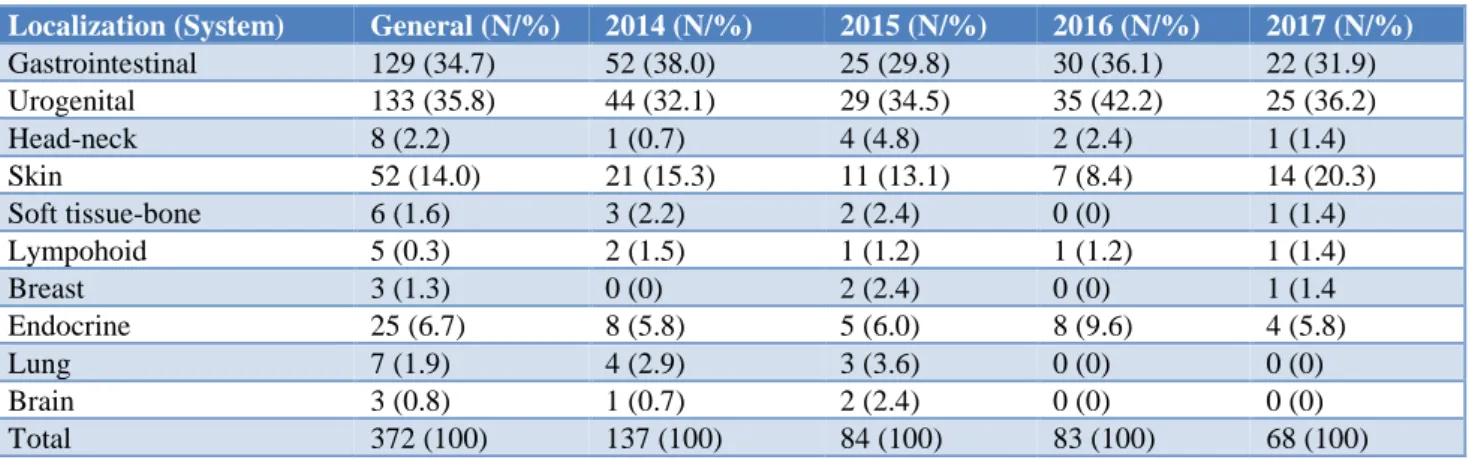
Table 7: General and yearly distribution of cancer cases by system in men.
Localization (System) General (N/%) 2014 (N/%) 2015 (N/%) 2016 (N/%) 2017 (N/%)
Gastrointestinal 129 (34.7) 52 (38.0) 25 (29.8) 30 (36.1) 22 (31.9) Urogenital 133 (35.8) 44 (32.1) 29 (34.5) 35 (42.2) 25 (36.2) Head-neck 8 (2.2) 1 (0.7) 4 (4.8) 2 (2.4) 1 (1.4) Skin 52 (14.0) 21 (15.3) 11 (13.1) 7 (8.4) 14 (20.3) Soft tissue-bone 6 (1.6) 3 (2.2) 2 (2.4) 0 (0) 1 (1.4) Lympohoid 5 (0.3) 2 (1.5) 1 (1.2) 1 (1.2) 1 (1.4)
Breast 3 (1.3) 0 (0) 2 (2.4) 0 (0) 1 (1.4
Endocrine 25 (6.7) 8 (5.8) 5 (6.0) 8 (9.6) 4 (5.8)
Lung 7 (1.9) 4 (2.9) 3 (3.6) 0 (0) 0 (0)
Brain 3 (0.8) 1 (0.7) 2 (2.4) 0 (0) 0 (0) Total 372 (100) 137 (100) 84 (100) 83 (100) 68 (100)
The distribution of cancer cases by years and their frequency in females are presented in Table 1. According to the statistics done by Mann Whitney U test for years, it was found that cancer cases were statistically higher in 2014 than in 2015, 2016 and 2017 (p values were 0.000, 0.043, 0.004, respectively). No significant difference was observed between the other years (p>0.05).
The distribution of all cancer cases according to the general and yearly based on organ is given in Table 2 and the distribution of based on system is given in Table 3. The mean age of the women cases was 58.9±15.2 and the median age was 5 years. The mean age of women in the year 2014 was 60.4±14.9, 2015 was 57.2±18.1, 2016 was
the general and yearly distribution in terms of organ and Table 5 shows distribution according to organ basis in women.
The mean age of men was 66.7±13.5 and median was 68 years. The mean age of the year 2014 was 68.0±11.9, 2015 was 65.7±15.3, 2016 was 66.3±14.7, and 2017 was 66.1±13.1. Table 6 shows the general and yearly distribution in terms of organ and Table 7 shows distribution according to organ basis in men.
DISCUSSION
cancer incidence is increasing all over the world. The main reason for this situation is the increase in diagnostic facilities and increase in the access to the diagnostic facilities. Likewise, cancer survival is also increased due to the advance in diagnostic facilities as well as treatment options and success of treatment. In Turkey in 2013, according to Ministry of Health statistics, cancer incidence is reported as 281.6 per 100000.9 Table 8
shows five most frequent tumors detected in our study and other study's results conducted in different provinces
of Turkey. As it is understood from the Table 8, the different sequence of tumor frequencies in different cities suggests that many factors effect tumor diversity. One of them is socioeconomic status and cultural differences. The probable cause of the higher incidence of breast cancers in women in Istanbul may be considered as socio-culturally the cosmopolitan structure of Istanbul and the relative altitude at the level of education. Another important reason is the effect of climatic factors which is realted to skin carcinomas as it is observed in Hatay.
Table 8: The most frequent tumors that were detected in our study and various studies from different cities in Turkey (*our study, ** CNS: Central nervous system).
City 1 2 3 4 5
Kars* Stomach Thyroid Colorectum Breast Prostate Konya5 Lung Stomach CNS** Hematologic Colon
Çorum7 Skin Prostate Stomach Urinary bladder Breast
Van10 Stomach Eosophagus Breast Colorectum Lung
İstanbul11 Breast Colorectum Stomach Lung Prostate
Hatay12 Skin Breast Urinary bladder Colorectum Prostate
Şırnak13 Skin Thyroid Colorectum Breast Stomach
Similar to our study, Van is another city where stomach cancers are common, and is also one of the cities where cold winter months pass due to geographical location and hot drinks are consumed at high frequency and high temperature. In a study evaluating gastric endoscopic biopsies performed in Kars province, the presence of
Helicobacter pylori (Hp) was detected in 72.1% of biopsies.14 Therefore, we suggest that the incidence of
high Hp also plays a role in the etiopathogenesis of stomach cancers which is most common cancer in Kars. When world-wide data are analyzed, the most common cancers in women can be counted as breast, colorectal,
uterine cervix; and in men, lung, prostate and colorectal.15
According to US data of 2012, the 3 most common tumors in women were breast, lung, colorectal carcinomas; and in men prostate, lung colorectal carcinomas.15 A study in year 2000 revealed that head
and neck cancers were the first in both women and men, while colon cancer was the second in both sexes in France.16 Breast cancer in women and lung cancer in men
has been reported in third place in the same study. According to 2013 data from Turkey, breast, thyroid and colorectal carcinomas are the most common cancers in women and lung, prostate and bladder cancers in men.9
Table 9: 3 most common type of cancer in men and women in Kars and different cities in Turkey (*our study, ** CNS: Central nervous system).
Women 1 Men 1 Women 2 Men 2 Women 3 Men 3
Kars* Breast Prostate Thyroid Stomach Colon Skin İzmir4 Breast Lung Skin Skin Endometrium Larynx
Konya5 Breast Lung CNS** Stomach Hematological Hematological
Van6 Eosophagus Prostate Stomach Skin Skin Lung
Çorum7 Skin Skin Breast Prostate Thyroid Urinary bladder
İstanbul11 Breast Colorectum Colorectum Lung Gynecological Stomach
Hatay12 Skin Skin Thyroid Colorectum Breast Stomach
Eskişehir17 Breast Skin Skin Larynx Colorectum Lung
Sivas18 Skin Skin Breast Urinary bladder Endometrium Prostate
Şanlıurfa19 Breast Urinary bladder Stomach Lung Thyroid Larynx
Table 9 shows the most common cancer types among women and men of our study and various studies from different cities of Turkey. When the data of the table are evaluated, even there are differences between the cities in male and female patients similar to general cancer frequencies; breast cancers are the most common cancers in women in most cities. As in the general cancer data, one other similarity observed between Van and Kars is that the most common male cancer is prostate cancer. Although thyroid lesions are more common in women in general, it is not considered to be a coincidence that the second most common type of cancer in Kars is thyroid. Kars is located on the border with Armenia due to its geographical location. The "Metsamor" nuclear power plant is still working and it is one of the oldest nuclear power plants in the world. This nuclear power plant does not have a protection basin to protect nuclear fuel in the same way as the nuclear power plant in Chernobyl. Therefore, high frequency thyroid cancers detected in Kars are thought to be associated with radiation. Gastric cancers in men are thought to be associated with hot drink consumption and Hp as in general tumor incidence. It is thought that fiber-poor nutrition may play a role in the etiology of colorectal carcinomas which are observed in women in the third place. Another study in Kars also revealed the relative high incidence (10.4%) in colorectal carcinoma in women while evaluating the colonoscopic biopsy results.21 Basal cell carcinoma and squamous cell
carcinoma constitute the majority of skin cancers in men which takes the third place in men in Kars. This situation can be explained by the sun exposure of the local people engaged in animal husbandry.
Since 1982, cancer is one of the mandatory diseases in our country. In Turkey in 2013, according to Ministry of Health statistics, cancer incidence is reported as 281.6 per 100000.9 The incidence of cancer in our country is found
to be lower compared to the world data, however it is doubtful whether this decrease represents a reality or not. Although the cancer registry system was first established in 1992, it is known that there are still some deficiencies and limitations in the notification of the cases. It can be argued that this situation is caused by the rural populations and inadequacy of medical controls as well as the inability of the registry system to be active due to the inadequate application of patients in primary health care institutions.
CONCLUSION
It is necessary to examine and take into account the regional and city-based cancer statistics that serve as an important key stone in the planning of health policies and health investments in our country. Regional data is not only important for treatment services, but also for preventive health services and early diagnosis. In this context, it is thought that the publications which include
the annual city based data from all cities should be increased in Turkey as well as the whole world.
This study has several limitations. The study data were collected from Health Research and Application Hospital in Kars between 2014-2017. The fact that the State Hospital data could not be included is an important limitation of the study. Between 2014-2017 some departments such as pulmonary diseases department did not actively served time to time. Moreover the lack of treatment facilities for leukemia/lymphoma and brain tumors lead patient's attendance to larger health centers for diagnosis. These and similar conditions cause false negativities in the proportion of related tumors
Funding: No funding sources Conflict of interest: None declared
Ethical approval: The study was approved by the Institutional Ethics Committee
REFERENCES
1. Mathers C, Fat DM, Boerma JT. The global burden of disease: 2004 update. Geneva, Switzerland: World Health Organization; 2008.
2. Jemal A, Bray F, Center MM, Ferlay J, Ward E, Forman D. Global Cancer Statistics. CA Cancer J Clin. 2011;61:69-90.
3. Gültekin M, Boztaş G. Türkiye kanser istatistikleri
2014. Available at:
https://hsgm.saglik.gov.tr/depo/birimler/kanser-db/istatistik/2009kanseraporu-1.pdf.
4. Fidaner D, Eser SY, Parkin DM. Incidence in İzmir in 1993-1994: First results from İzmir Cancer Registery. Eur J Cancer. 2001;37:83-97
5. Ecirli Ş, Borazan A, Tek B, Deveci A, Polat H. The determınatıon of adult cancer cases among the patıents admıtted to the educatıon and ınvestıgatıon hospıtal, faculty of medıcıne, unıversıty of selçuk of the between 1993 and 1999 years. T Klin J Med Sci. 2002;22:349-53.
6. Uğraş S, Dilek H, Akman E, Akpolat N, Karakök M. Yüzüncü yıl Üniversitesi Tıp Fakültesi Patoloji Anabilim Dalı'nda tanı konan kanserlerin sıklığı ve dağılımı. Van Tıp Derg. 1996;3:148-54.
7. Baş Y, Uzbay P, Güney G, Erenler BH, Yılmaz D, Özdemir Ç. A Study on distribution of cancer cases diagnosed in çorum. Turkish J Pathol. 2014;30:118-23.
8. Ferlay J, Shin, HR, Bray F, Forman D, Mathers C, Parkin DM. GLOBOCAN 2008, cancer incidence and mortality worldwide: IARC Cancer Base No. 10. Lyon International Agency for Research on Cancer; 2010:29.
9. TC Sağlık Bakanlığı Sağlık İstatistikleri Yıllığı,
2012. Available at:
10. Alıcı S, İzmirli M, Doğan E. Epidemiologic evaluation of the patients admitted to Department of Medical Oncology, Yüzüncü Yıl University, Medical Faculy. Türk Onkoloji Dergisi. 2006;21(2):87-97.
11. Gürsu RU, Kesmez Acar Ö, Karaçetin D, Mermut Ö, Ökten B, Güner Şİ. Istanbul Research and Training Hospital Oncology Division: 18-Month Results of a Newly Formed Unit. Istanbul Med J. 2012;13(1):13-8.
12. Arıca S, Nazlıcan E, Özer C, Benk Şilfeler D, Arıca V, Özgür T, Özaydın Ü. The frequency and disribution of cancer cases in Hatay District in 2008. J Clin Exp Invest. 2011;2(2):192-5.
13. Bozkurt K, Sert Bektaş S, Doğru N. Cancer Statistics of Şırnak City. Turkish J Pathol. 2011;27(3):230-4.
14. Adalı Y, Eroğlu HA, Fındık Güvendi G. Endoscopic Gastric Biopsy Results: Kars Province. Kafkas J Med Sci. 2017;7(1):47-52.
15. Ferlay J, Soerjomataram I, Ervik M, Dikshit R, Eser S, Mathers C, et al. GLOBOCAN 2012 v1.0, Cancer Incidence and Mortality Worldwide: IARC Cancer Base No. 11. Lyon, France: International Agency for Research on Cancer; 2013. Available at: http://globocan.iarc.fr.
16. Colonna M, Hedelin G, Esteve J, Grosclaude P, Launoy G, Buemi A, et al. National cancer
prevalence estimation in France. Int J Cancer. 2000 Jul 15;87(2):301-4.
17. Dündar E, Öner Ü, Işıksoy S, Tel N, Kabukçuoğlu S. Eskişehir ili'nde 1992-1995 yılları arasında görülen kanser olgularının değerlendirilmesi. Türk Ekopatol Derg. 1998;4(3-4):101-6.
18. Eğilmez R, Düzcan E. Cumhuriyet Üniversitesi Tıp Fakültesi Patoloji Anabilim Dalı'nda kanser sıklığı üzerine bir çalışma. Türk Neopl Derg. 1992;1(2):37-42.
19. Bitiren M, Özardalı İ, Baba F, Nazlıgül Y, Eraslan H. The evaluation of cancer sata in Şanlıurfa provice (1995-2002) Türkiye Ekopatoloji Dergisi. 2003;9(1-2):11-6.
20. Ozekinci S. Patoloji Arşivindeki 10 yıllık kanser (1991-2000) olgularının genel değerlendirilmesi. Dicle Tıp Dergisi. 2007;34:164-9.
21. Güvendi GF, Eroğlu HA, Adalı Y. Kars Yöresi Alt Gastrointestinal Endoskopik Biyopsi Sonuçları. Kafkas Tıp Bilimleri Dergisi.;8(1):70-9.