Filling the Home Purchase Financing Gap:
An Analysis of Mortgage Down Payment Assistance Programs
Christopher Allison
Department of City and Regional Planning University of North Carolina at Chapel Hill April 3, 2012
Table of Contents
Abstract ... 3
Introduction ... 4
Methodology ... 5
Background ... 7
Literature Review ... 7
Barriers to Homeownership ... 7
Down Payment Assistance ... 7
Primary Research ... 8
Housing Counselor Survey ... 8
Field Interviews ... 10
Policy Goals and Critique ... 12
Policy Critique ... 13
Matched-Savings Accounts ... 13
Homebuyer Tax Credits ... 13
Private Forms of Down Payment Assistance ... 14
Soft Second/Forgivable Loans ... 15
Loan Guarantees ... 16
Financial Analysis ... 18
Assumptions ... 19
Findings ... 20
Cost to Borrower ... 20
Borrower Equity and Default Rates ... 21
Number Served and Cost to Public Provider ... 22
Lessons Learned ... 25
Conclusion ... 27
Works Cited ... 28
Appendix I: Survey Questions ... 30
Appendix II: Down Payment Assistance Scenarios ... 32
Forgivable Second Loan ... 32
Grant ... 33
Traditional Second Loan ... 34
Loan Guarantee ... 35
Abstract
Introduction
Mortgage down payment requirements are a fundamental component of traditional home purchase loans in the United States. Typically, homebuyers are required to put down a certain amount of equity at closing to secure a mortgage and purchase a home. The purpose of this paper is to better understand how down payment requirements act as a barrier to obtaining a mortgage and buying a home for low-to-moderate-income (LMI) borrowers. The paper will explore policy interventions that attempt to address this barrier in low-and-moderate income communities. The issue of down payment requirements is even more salient in our current economic climate given the continued foreclosure crisis and lagging economic recovery of the past few years. Many stakeholders, including local governments and nonprofit organizations, are seeking solutions that can help stabilize neighborhoods and encourage homebuyers to enter the market again. At the same time, with home values significantly discounted due to the overall market turmoil, many first-time homebuyers are seeing a historic opportunity to buy homes that would otherwise not be within reach financially. Obtaining a mortgage has become a large roadblock to purchasing a home due to tightened lending requirements. My hope is to ultimately provide useful policy and implementation recommendations for local governments and nonprofit organizations operating down payment assistance programs.
While LMI homebuyers face many barriers to accessing mortgage lending, this project will specifically focus on barriers related to wealth, or the ability to meet the required down payment amount determined by the lender. Down payment assistance programs were created to help LMI borrowers overcome this barrier by providing a subsidy to bridge the gap in financing between the mortgage loan amount and the selling price. There are a patchwork of programs that help homebuyers meet down payment and closing cost requirements to purchase a home. These programs take many forms and have varying program designs. They often include income limits and are focused on first-time homebuyers in order to target underserved populations. Local and state governments administer most down payment assistance programs, while some nonprofit organizations also offer assistance. Some programs are targeted toward specific neighborhoods to encourage investment, while others are citywide and allow participants to benefit regardless of where they move within a given jurisdiction.
Methodology
In an attempt to explore the complexity of down payment assistance program design, I have used several methodological strategies. These strategies include a literature review, results from a national survey of housing counselors, and interviews with stakeholders in three housing markets. After outlining policy goals and discussing common down payment assistance strategies, I have constructed a financial model to evaluate the potential for several program designs to address down payment constraints in LMI communities.
The literature review focuses on barriers to homeownership and down payment assistance as a solution to those barriers. While there is not a substantial number of works that address these particular issues, key publications and findings are highlighted to provide context. These publications most often used quantitative strategies to measure the effects of down payment requirements and assistance on LMI homebuyers.
Primary qualitative research has been included to shed light on local perspectives about down payment requirements and assistance from the field. The research was conducted in conjunction with the UNC Center for Community Capital. These strategies involved a national survey of housing counselors and in-depth interviews with key stakeholders in three housing markets. Those stakeholders included lenders, real estate agents, appraisers, state housing finance agencies, housing counselors, and community development organizations. In total over 100 housing counselors form across the country completed the online survey. In-depth interviews were conducted with over 20 stakeholders in local markets.
The next component in this project involved creating broad policy goals based on the literature review, primary research, and my own opinions and values related to increasing access to sustainable mortgage lending through down payment assistance. These goals were then used to evaluate five broad categories of policy interventions attempting to ease the burden of down payment requirements for potential homebuyers.
After understanding how the five broad categories meshed with the assigned goals, further in-depth financial analysis of two intervention categories was conducted, including several iterations of publicly supported second mortgages and alterations to private first mortgages. The purpose of this analysis was to construct a financial model grounded in local market assumptions that would show the relative impacts of varying program designs on the borrower and down payment assistance provider.
savings accounts, and more. The large variance in interventions makes a comprehensive literature review the task of a research project unto itself.
The primary research involved also has its limitations given that questions related to down payment assistance were only part of a much larger discussion of the tightening of mortgage credit and barriers to accessing mortgages in LMI communities. Most respondents highlighted credit history, employment, and appraisal issues as the most pressing concerns related to driving demand for mortgage credit in LMI communities, although they also cited down payment assistance as a key factor.
Background
To frame the context of this research project, this section will explore past research on down payment requirements and assistance through a brief literature review. Primary research conducted with the UNC Center for Community Capital will then be shared to highlight local perspectives on down payment issues.
Literature Review
Since down payment assistance is a broad concept with many policy manifestations carried out by various market stakeholders (sellers, non-profits, government), it has been difficult to identify a comprehensive literature on the subject. The majority of research has focused on a wide variety of barriers to obtaining a mortgage, while few have singled out down payment requirements and assistance specifically. I will present some of the more prevalent studies and their findings while also focusing in-depth on a few of the more detailed analyses related to this research project.
Barriers to Homeownership
Many authors have looked into barriers LMI borrowers face obtaining a mortgage and purchasing a home. Linneman and Wachter (1989) first looked at barriers to homeownership from the perspective of wealth (savings for a down payment) and income (to make monthly payments). They found that both were important predictors of successful homeownership. Zorn (1989) used a combined measure of wealth and income and found similarly that homeownership was less likely given financial constraints.
Later Quercia, McCarthy, and Wachter (2003) employed similar techniques and modeled hypothetical mortgage products with varying attributes (such as interest rates and debt-to-income requirements). These findings indicated that decreases in down payment requirements led to increases in predicted homeownership rates. This focus on down payment gives some credence to the focus on down payment assistance programs and their significance in aiding LMI homeownership. Barkova et al (2003) found that income constraints were less significant of a barrier compared to wealth and credit constraints. They also found that wealth constraints had become less significant from the late 1980’s to the 1990’s indicating that lenders may have eased some of the traditional underwriting requirements previously in place. My assumption is that this is no longer the case given the tightening of credit since the economic downturn.
Down Payment Assistance
surrounding communities. This study has implications for whether a down payment assistance program targets a specific neighborhood or lets participants move throughout a city.
Primary Research
In addition to reviewing existing academic literature related to down payment requirements and assistance, this paper also includes references to primary research conducted by the Center for Community Capital (CCC) in partnership with Enterprise Community Partners (Enterprise). This work included a national survey of housing counseling agencies and field interviews with stakeholders in three housing markets: Atlanta, Cleveland, and Phoenix. The purpose of including these findings is to provide context for how down payment barriers play out in LMI communities and the perceived value of down payment assistance programs from various local perspectives.
Housing Counselor Survey
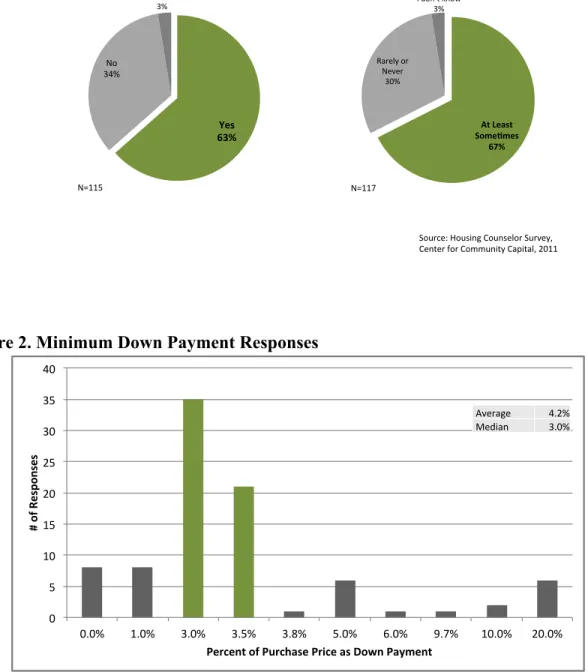
CCC and Enterprise conducted a national survey of housing counseling agencies during the summer of 2011 to better understand the barriers to mortgage lending for LMI borrowers. The survey asked several questions related to down payment requirements and assistance. The survey was administered online to three national networks of housing counseling agencies: National Council of La Raza, National Community Reinvestment Coalition, and NeighborWorks. The survey instrument involved 54 questions that included fill in the blank, multiple choice, and open-ended questions, covering the following topics: current trends, credit barriers, lenders and financial products, underwriting guidelines, and overall outcomes. We received 141 completed surveys, while each question typically received 117 responses. See Appendix I for the list of questions asked related to down payment requirements and assistance.
The survey found that down payment issues were less commonly cited as the primary obstacle to
homebuyers obtaining mortgage credit than credit score or income/employment issues. 1 The
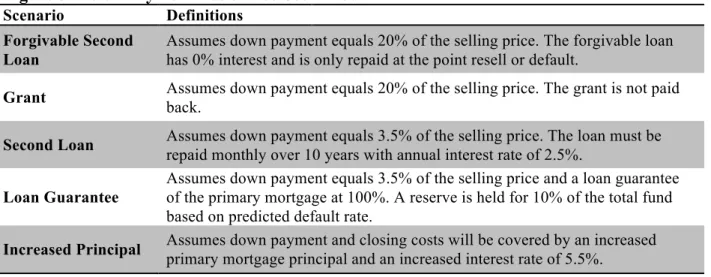
majority of counselors did indicate that the minimum requirement had increased in their market (see Figure 1). Most participants responded that the lowest down payment options available today require between 3% and 3.5% down. The clustering of minimum down payments around 3.5% is an indication of the important role FHA plays in serving borrowers that would not
otherwise be able to access mortgage credit. 2
Down payment assistance programs play an important role in helping LMI borrower meet down payment requirements, which often involve a loan (often forgivable after a certain term) or grants. Over half of the respondents listed these programs as a type of loan used in the past year at least 20% of the time. However, most respondents (71%) said that lack of down payment
1 Counselors responded that down payment requirements were at least sometimes a barrier 67% of the time, while
2 Many housing counselors are also involved in local down payment assistance programs that reduce or eliminate the
barrier of down payment requirements, as a result housing counselors may be biased toward underestimating the degree down payment requirements prevent LMI homebuyers from accessing mortgage credit in general because of
assistance was a barrier. There was particular concern about the current availability of down payment assistance with 72% predicting that there would be a severe or modest shortfall in down payment assistance funds in 2011.
Figure 1. Responses to Questions About Down Payment as a Barrier
Figure 2. Minimum Down Payment Responses
How$o%en$have$high$down$payments$ been$a$cause$for$loan$fallout$in$the$past$ 12$months?$ $ $ $ $ $ $ $ $$ $ $N=117$ $ $ $ Currently,$are$your$clients$being$required$ to$put$down$higher$down$payments$than$ in$the$past?$$ $ $ $ $ $ $ $ $$ $ $N=115$ $ $ Yes$ 63%$ No$ 34%$ I$don’t$know$ 3%$ At$Least$ Some/mes$ 67%$ Rarely$or$ Never$ 30%$ I$don’t$know$ 3%$ Source:$Housing$Counselor$Survey,$$ Center$for$Community$Capital,$2011$ 0" 5" 10" 15" 20" 25" 30" 35" 40"
0.0%" 1.0%" 3.0%" 3.5%" 3.8%" 5.0%" 6.0%" 9.7%" 10.0%" 20.0%"
These survey responses indicate that down payment was a significant barrier for LMI borrowers from the perspective of housing counselors that serve this population. It also speaks to the importance of down payment assistance in addressing this financing gap. Finally, there are clearly concerns that down payment assistance funds may see a shortfall in the near future and that would be a detriment to the recovery of the communities where housing counselors work.
Field Interviews
In total, twenty-one interviews were conducted in the three local markers (seven in each market). The participants included local mortgage lenders, real estate agents, state Housing Finance Agencies (HFAs), community development corporations (CDCs) and nonprofit housing counseling agencies, home appraisers, and academics. The interviews were conducted mostly in person and lasted approximately an hour each. Participants were asked a series of questions about supply and demand for home purchases and mortgage loans, and barriers to mortgage access. They were also asked about programs created to increase access and stabilize neighborhoods, including down payment assistance programs.
The field interviews provided substantial insight into each housing market including specific challenges and opportunities. This section highlights responses from interview participants related to down payment assistance programs and their role in driving home mortgage originations after the beginning of the foreclosure crisis in 2008.
All of the stakeholders interviewed discussed the critical importance of down payment assistance programs in helping to drive demand in the current housing market and in providing access for LMI borrowers to homeownership. In many cases, federal Neighborhood Stabilization Program (NSP) funds were used for down payment assistance programs in addition to other city, county, and state funds and meant that the funds could potentially be layered on top of one another. This was particularly the case in Atlanta where multiple participants discussed the ability to layer these funds to maximize the client’s down payment at closing.
Stakeholders in Atlanta said that down payment assistance and low prices were the main drivers of demand in the first-time homebuyer market. Using a combination of NSP, HOME, tax-increment financing, and municipal bonds, some of the down payment assistance funds were
geographically specific to certain communities in Atlanta while others could be used citywide.3
These programs were generally viewed as easy to access from the perspective of lenders, real estate agents, and community organizations. Respondents believed that there had not been a shortage of down payment assistance funds in the past several years, so concerns about limitations of funding seemed to be nonexistent among the participants. However, many felt that the funds were not enough and that they focused on the individual as opposed to the stability of
3 Down payment assistance offered by the Atlanta Beltline in designated areas are partly funding using
the community. Since some of the down payment assistance programs can be used citywide or even in more suburban counties, they do not necessarily promote homeownership in those communities disproportionately affected by the foreclosure crisis.
Policy Goals and Critique
By reviewing literature and primary research, this paper has shown the significance of down payment requirements as a barrier and the importance of down payment assistance programs in helping LMI borrowers overcome these obstacles. Down payment assistance is a patchwork of programs that assist potential homebuyers with down payment and closing costs. This patchwork includes programs that vary dramatically in their design and funding structure. Based on the information presented in this paper, I argue that an ideal down payment assistance program would stimulate demand for home purchases, require borrowers to provide some “skin in the game” to reduce the likelihood of defaults, and incentivize homeownership in communities most affected by the foreclosure crisis. In this section, I will outline these policy goals, which I believe would provide for an effective down payment assistance strategy.
First, the program would stimulate demand for home purchases in order to increase activity in local housing markets and assist in the rebound of the overall U.S. economy. First-time homebuyers are an important driver of the market for owner-occupied homes given the state of the housing market. Current homeowners are less likely to purchase a new home in the present climate because home values have depreciated significantly leaving many existing homeowners underwater on their mortgages (meaning they owe more on their mortgage than their house is worth). Many of these homeowners are taking the position of waiting out the present dip in values by standing on the sidelines and not purchasing a new home. At the same time, historically low home values are presenting potential homeowners in LMI communities with a unique opportunity to purchase homes that may have not been within reach during the previous boom in the housing market. Therefore, it is important for any down payment assistance program to incentivize new purchases by expanding the market in the short term to boost sales and economic activity nationally.
Second, it is important for down payment assistance programs to require borrowers to provide “skin in the game.” Critics have argued that down payment assistance programs played an important role in encouraging lenders to make loans to unqualified borrowers. Once the market soured and home prices fell, they argue that homeowners with little equity in their homes (from putting little to no money down at purchase) were much more likely to walk away from their mortgages leading to higher defaults. In order to design a politically feasible program that takes into account these criticisms, any policy should require some form of “skin in the game” as a way to ensure ample investment on the part of the borrower. Later in this paper, I suggest various ways for borrowers to provide “skin in the game.”
foreclosure rates should be focused on in order to stabilize housing values in those neighborhoods. This is also important because homebuyers are often using down payment assistance as a tool to escape marginalized areas and establish themselves in more stable neighborhoods. Therefore, it makes sense to layer both city-wide and neighborhood specific down payment assistance programs in order to allow freedom of choice while incentivizing investment in marginalized communities.
Policy Critique
The policy goals outlined in the previous sections provide a framework to evaluate five broad down payment assistance designs. These designs include matched savings programs, home purchase tax credits, seller-funded assistance programs, forgivable loan products, and loan guarantees. I will describe each of these types of assistance while also analyzing how each fits into the policy goals outlined above.
Matched-Savings Accounts
Matched-savings accounts are often used as an asset-building tool in LMI communities. They involve individuals opening a savings account where money is deposited on a regular basis over a given amount of time. Once the individual reaches the match criteria, the account receives funds equal to the amount the individual has accrued over time. The match rates vary from program to program, but can be a 1:1 match or higher.
Individual Development Accounts (IDAs) are a specific type of matched-savings account that is funded by the federal government and often supplemented by additional private funding. The savings must be used for one of the three purposes: housing, post-secondary education, or starting a new business. These accounts are most often used for housing with 28 percent of them used to purchase a home (Miller 2010).
The use of IDAs as a tool for addressing home purchase barriers faced by LMI homebuyers has potential. Clearly participants are using this program to assist in saving for their home purchases in the future. This product also provides the most significant skin in the game of all the programs examined in this paper. Subsidy is provided through the match, but participants must successfully save their own portion to receive the additional funds. However, if IDA programs were expanded they would only shift demand over the long run given the amount of time it takes to save the matched amount (usually 1-2 years). This means IDAs would not help drive demand in the short run to stem the number of vacant properties on the market and help stabilize communities. These programs are not traditionally geographically based, so it does not lend itself to neighborhood targeting either.
Homebuyer Tax Credits
percent of the purchase price. For home purchases in 2008, the credit must be repaid and acts as an interest-free loan. Later iterations of the tax credit acted as grants that did not need to be repaid if the homeowner uses the property as their primary residence for over three years (IRS 2011). The tax credits also originally targeted first-time homebuyers, but the rules were expanded to include existing homeowners in later iterations.
Homebuyer tax credits, which provide subsidies to individuals to purchase homes during certain time periods, were enacted to increase demand in the housing market given the housing crisis that began in 2007. This sort of direct subsidy makes sense as a demand driver. The fact that the program was expanded in 2009 and 2010 in order to broaden its impact shows that it was an attempt to stimulate demand. It was also a rapid response compared to actions where the federal government funds states and localities to develop down payment assistance programs such as NSP, which took much longer to implement.
Despite the potential for tax credits to stimulate demand in the short-term, this strategy does not address distressed neighborhoods. These tax credits had no geographic component since any homebuyer that met the income limits and other criteria in the United States could access them. This type of broad strategy does not address the disproportionate effect of the foreclosure crisis on particular communities.
The first-time homebuyer tax credit dealt with requiring skin in the game in varying ways as it evolved. In 2008, homebuyers that took the credit were required to pay the credit back. In effect, the credit acted as an interest free loan. This ten percent acted as skin in the game even if there was no initial down payment because the borrower would still be on the hook to pay back the credit. However, this policy changed for the later iterations of the tax credit in 2009 and 2010. The borrower was no longer required to pay back the tax credit if they staid in their home for at least three years. This means that there was very little skin in the game because they were able to recoup ten percent of their down payment at tax time. For borrowers taking out Federal Housing Administration (FHA) loans at 3.5 percent down or less, this meant they were recouping more than their initial equity in their home. Although the tenure requirement could be considered skin in the game, it is significantly less time than other down payment assistance programs require (typically five to ten year). These factors make tax credits a feasible strategy for stimulating demand quickly, but they require minimal skin in the game and do not address larger place-based issues.
Private Forms of Down Payment Assistance
These types of seller-funded arrangements are not an optimal strategy given the outlined policy goals. They may drive some demand by allowing less qualified buyers to purchase homes, but most of these transactions happen between associated parties conducting mortgage fraud. There is no neighborhood-specific component to the programs, but the schemes are sometimes tied to specific developments. Finally, there is no skin in the game from the borrower since the seller funds the full down payment requirement.
Despite the prevalence of these private schemes in the past and their dubious intentions, there may be the potential for down payment assistance solutions offered by lenders in the form of altered loan terms. One approach may be for lenders to waive or lessen down payment requirements by requiring a higher interest rate over the course of the loan. Another approach could involve the lender increasing the loan principal to include the down payment and closing costs. These scenarios will be explored further in the financial analysis sections as a way to test potential private market solutions and their impact on borrowers.
Soft Second/Forgivable Loans
Soft second mortgages are secondary mortgages often used to provide down payment assistance in the form of a forgivable loan, a grant, or a traditional second loan. These are loans that cover the amount of the purchase price not traditionally covered by a primary mortgage. They also generally forgive, defer, or subsidize the loan in order to assist LMI borrowers. Local governments as well as non-profit community organizations provide soft seconds. The requirements for these programs vary greatly, but generally involve income and home value caps, using a conventional or FHA/VA loan from an approved lender, and tenure in the home for a certain number of years.
The federal government provided direct funding for these types of down payment assistance programs from 2003 to 2008 through the American Dream Downpayment Initiative. This initiative provided direct funding to states and localities based on formulas developed by the Department of Housing and Urban Development. After 2008, funds distributed through the HOME program could be used for down payment assistance programs. NSP funds were also used to fund down payment assistance, as well as a variety of activities to encourage homeownership in LMI communities. States have the freedom to design their own programs which could include down payment assistance or not, depending on how the state chooses to use the funding (HUD 2011).
Soft second mortgage programs have the ability to stimulate local demand by incentivizing first-time homebuyers to purchase in the current market and help them overcome barriers related to down payment requirements. These programs also have the flexibility to customize their programs to local conditions and market nuances. This helps to avoid the dangers of one-size-fits-all policies such as tax credits. There is also the ability to drive demand in the short-term compared to matched savings programs, which take much more time for participants to save.
Many soft second programs also address neighborhood specific issues. There is an opportunity to target communities disproportionately affected by the foreclosure crisis. Cities and counties can focus their down payment resources to complement other redevelopment efforts that are taking place in their jurisdictions. Often these programs have diverse funding sources, which can help make the program sustainable and their flexibility allows them to combine federal funds, community development finance tools, municipal bonds, and philanthropic support. These combined activities have the potential to create larger impact, rather than an isolated program with minimal community effects.
Finally, these programs often require skin in the game while still increasing access for LMI borrowers. Many programs provide the full down payment for the purchase, but require the borrower to pay for closing costs up to $1,000 to $2,000. There are also usually strong tenure requirements where the loan is only forgiven if the borrower stays in their home and current on their primary mortgage for at least 10 years. Overall, these programs attempt to balance the tension between requiring buy-in from the borrower and increasing access.
Loan Guarantees
Loan guarantees have the potential to assist borrowers in securing a lower down payment requirement without the additional burden of having to also pay for private mortgage insurance. The concept is that the administrating entity could provide a guarantee of the primary mortgage as way to mitigate the lenders risk of allowing a lower down payment from the borrower. In the event that the borrower defaults, the administering entity is required to pay the lender any outstanding principal and interest owed by the borrower.
Financial Analysis
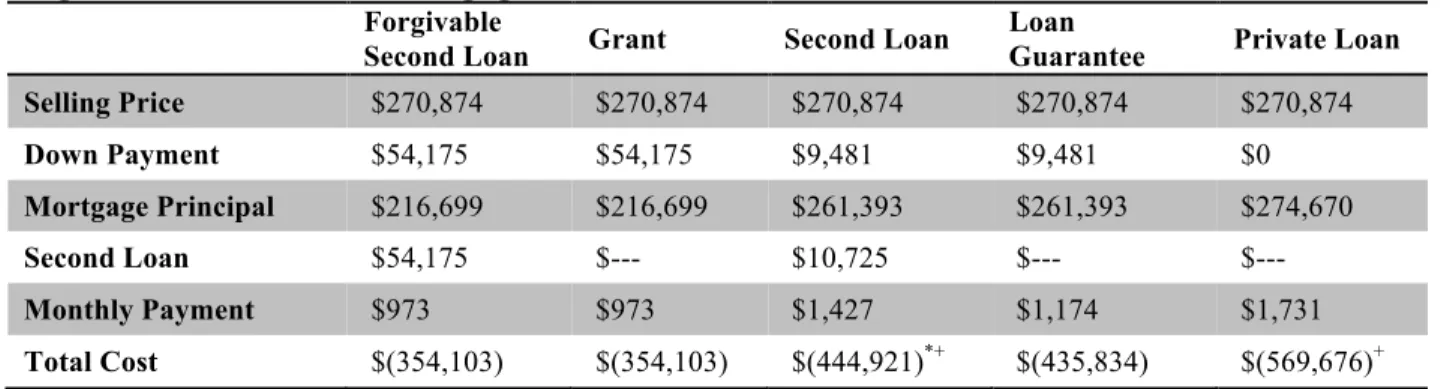
In order to better understand the financial implications of specific down payment assistance program designs, five scenarios were defined based on the analysis above (see Figure 3). Three scenarios were developed to represent second loans provided by public and non-profit entities. These scenarios included a forgivable loan or soft second, a grant, and a traditional second loan. As outlined in the previous section, these types of down payment assistance fit closest with the policy goals outlined. A loan guarantee was also included to better understand the impact of covering losses on the primary as a way to lower down payment requirements. A private option was also included to determine the effectiveness of restructuring loan terms to provide significant down payment reductions and explore the potential for private market solutions.
Figure 3. Down Payment Assistance Scenarios
Scenario Definitions
Forgivable Second Loan
Assumes down payment equals 20% of the selling price. The forgivable loan has 0% interest and is only repaid at the point resell or default.
Grant Assumes down payment equals 20% of the selling price. The grant is not paid
back.
Second Loan Assumes down payment equals 3.5% of the selling price. The loan must be repaid monthly over 10 years with annual interest rate of 2.5%.
Loan Guarantee
Assumes down payment equals 3.5% of the selling price and a loan guarantee of the primary mortgage at 100%. A reserve is held for 10% of the total fund based on predicted default rate.
Increased Principal Assumes down payment and closing costs will be covered by an increased primary mortgage principal and an increased interest rate of 5.5%.
The forgivable loan and grant scenarios were both created with the assumption that the borrower would qualify for down payment assistance equal to 20 percent of the selling price. The traditional second loan and loan guarantee assume that the borrower only qualifies for 3.5 percent in order to limit their additional debt burden. The forgivable loan would act as a second-lien loan to cover the gap in financing for csecond-lients that lack sufficient equity at the closing table. It would carry a 0 percent interest rate for the duration of the loan. The forgivable loan would become due in full if the borrower resold the property or defaulted on the primary mortgage. The grant would function similarly to the forgivable loan except that it would never need to be repaid; it would act as a one-time subsidy to the borrower. The second loan would act as a traditional second-lien loan that would have a below market monthly compounded interest rate (2.5 percent) and be amortized over 10 years with payments due monthly.
assistance funding and make guarantees based on that reserve in a significantly higher volume. The private scenario adjusts the terms of the primary mortgage in order to lessen the burden of an upfront down payment requirement. It involves down payment assistance equal to 3.5 percent of the selling price. The provision of this assistance would result in a higher interest rate over the course of the primary loan (5.5 percent annually). The down payment and closing costs have been added to the principal of the primary mortgage.
In the following financial analysis, these scenarios will be used to test the viability of different program designs for down payment assistance. The financial analysis was conducted on each scenario using market data from the Atlanta, Georgia MSA. The same financial analysis was also conducted for the Cleveland, Ohio and Phoenix, Arizona MSA’s. However, the results were similar in each case so only one set of data is presented here for the sake of simplicity.
Assumptions
Many assumptions were made in constructing the final financial model. Key inputs were defined using market data from secondary sources including funding allocations from the U.S. Department of Housing and Urban Development (HUD), Home Mortgage Disclosure Act (HMDA), Federal Housing Administration (FHA) guidelines, and market analysis sites like Bankrate.com (see Figure 4).
Figure 4. Input Assumptions for Financial Model
Variable Atlanta, GA Definition
Base Program Funding $11,366,783 HUD funding allocation for the HOME program, 20114
Number of Mortgages 4,272 Number of FHA/VA mortgages in LMI Tracts, 20105
Avg Mortgage Amount $261,393 Avg amount of FHA/VA mortgages in LMI Tracts, 20106
Avg Selling Price $270,874 Calculated assuming a 3.5% down payment
Avg Closing Costs $3,796 State average based on a $200,000 mortgage in 20117
To find a baseline capitalization of each down payment scenario, 2011 geographic-specific funding allocations for HUD’s HOME program were used. The HOME program provides federal funds to states and localities to provide access to affordable housing. These flexible grants can be used in many ways, but often include down payment assistance programs. For this financial model, it is assumed that all of the 2011 funding will be used for down payment assistance.
4
Down payment assistance programs target low-and-moderate income households to increase access to homeownership in those communities. HMDA data was used to determine the number of mortgage originations in LMI census tracts (those with median income at 80 percent or below of area median income) and the average amount of those loans. FHA/VA loans were used because of the dominant role FHA is currently playing in the housing market, especially in LMI communities. The average selling price was determined by assuming a 3.5 percent down payment on the average mortgage amount. Finally, average closing costs for Georgia were included from Bankrate.com.
Findings
This section presents the findings of the financial model for Atlanta, Georgia once the down payment assistance scenarios were defined and market data was collected. These findings are presented thematically in the following sections and take into account the total cost to the borrower, amount of borrower equity, default rate, number of borrowers served, and the cost of the program.
Cost to Borrower
An important consideration of any down payment assistance program is the overall cost to the borrower. These programs, at least on the public side, have an explicit goal of increasing affordable and sustainable homeownership. By calculating the total cost of each lending scenario (full principal repayment plus interest, closing costs, and private mortgage insurance), it is clear that the forgivable loan and the grant provide the most favorable terms for the borrower (see Figure 5). These calculations assume full repayment and that the household does not resell the property. In these two scenarios the borrower will pay $354,103 dollars over the life of the primary loan. The main reason for the lower cost in these two scenarios is due to the upfront equity provided by the down payment assistance, which has lowered the initial principal of the primary mortgage.
Figure 5. Total Cost of Mortgage to Borrower
Forgivable
Second Loan Grant Second Loan
Loan
Guarantee Private Loan Selling Price $270,874 $270,874 $270,874 $270,874 $270,874
Down Payment $54,175 $54,175 $9,481 $9,481 $0
Mortgage Principal $216,699 $216,699 $261,393 $261,393 $274,670
Second Loan $54,175 $--- $10,725 $--- $---
Monthly Payment $973 $973 $1,427 $1,174 $1,731
Total Cost $(354,103) $(354,103) $(444,921)*+ $(435,834) $(569,676)+ *These loan costs include the total cost of the primary and secondary loans
The final three scenarios are less advantageous to the borrower from a cost perspective. The use of a traditional second loan in the third scenario is significantly more expensive due to the repayment of both loans. Although the second loan offers favorable loan terms to cover a down payment of 3.5 percent for the primary loan, it is clearly more expensive than the first two options. Similarly, the loan guarantee solution where the primary loan is covered allowing the borrower to avoid costly private mortgage insurance are slightly less expensive than the traditional second loan. This is mainly due to the difference in amortization (10 years versus 30 years) for those costs. These options cost between $435,000 and $444,000 dollars each over the course of the loans. By far, the priciest option would be to capture the down payment through an increased interest rate (2 additional percentage points) and increased principal, which adds nearly $200,000 additional dollars to the cost of the loan compared to the most favorable options. It is clear that forgivable loans and grants would be the least costly and most beneficial for borrowers
Borrower Equity and Default Rates
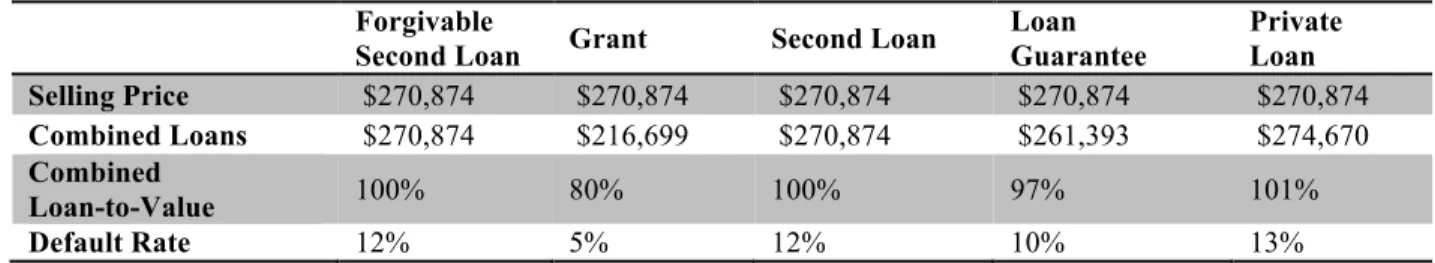
Borrower equity is an important consideration in any down payment assistance program. In the previous analysis of total cost above, it was clear that the more equity the borrower brings to the closing table, in this case through down payment assistance, that the total cost over the life of the loan goes down since the initial principal is reduced. In addition to the reductions in cost, there may be additional benefits to increased borrower equity. For example, the borrower is less likely to owe more on the mortgage than the property is worth due to fluctuations in market prices like those currently being experienced in the foreclosure crisis. The financial model shows that forgivable loans and grants provide the most equity for the borrower (over 5 times the amount for the second loan and loan guarantee). The private option offers the borrower no equity since all down payment and closing costs are shifted into the loan principal (see Figure 5).
grants and loan guarantees are the least riskiest down payment assistance products given their loan-to-value ratios.
Figure 6. Default Rates based on Loan-to-Value Ratios
Forgivable
Second Loan Grant Second Loan
Loan Guarantee
Private Loan Selling Price $270,874 $270,874 $270,874 $270,874 $270,874
Combined Loans $270,874 $216,699 $270,874 $261,393 $274,670
Combined
Loan-to-Value 100% 80% 100% 97% 101%
Default Rate 12% 5% 12% 10% 13%
Number Served and Cost to Public Provider
Further analysis of the financial implications for the public scenarios uses the 2011 HOME program allocation to the Atlanta MSA as a basis for capitalizing each down payment assistance program. This base amount was divided by the calculated down payment amount or borrower equity to determine an estimated number of homebuyers that would be served by each program (see Figure 7). The traditional second loan serves significantly more homebuyers than either the forgivable loan or grant, with 28 percent of potentially eligible borrowers covered compared to 5 percent. This results from the lower down payment assistance amount. Similarly, the loan guarantee also covers more borrowers than the forgivable second loan or grant because it is only paying out when a loan defaults. As has been mentioned, the traditional second loan and loan guarantee will result in higher costs to the borrower. They both also have higher default rates than the grant option. These factors can be viewed as a tradeoff with the ability to serve a much greater number of borrowers.
Figure 7. Number of Homebuyers Served
Forgivable
Second Loan Grant Second Loan Loan Guarantee
DPA Funding $11,366,783 $11,366,783 $11,366,783 $113,667,830
Down Payment $54,175 $54,175 $9,481 $9,481
Loan Volume 4272 4272 4272 4272
# DPA Recipients 210 210 1199 725
% DPA Coverage 5% 5% 28% 17%
assumed that all down payment assistance funds would be deployed as loans or grants. This means that all of the funds would be exhausted with no assumption of recouping any of them. The forgivable loan is structured this way because it is assumed that very little principal would be recouped in the event of default due to the borrower’s inability to pay and the second-lien position. There is no interest earned on these outstanding amounts due to the assumed terms of the loan. The grant does not collect any proceeds given its terms. The traditional second loan fares best when considering sustainability because it recoups the largest share of its down payment assistance funding. Its losses are related to its small down payment assistance amount and the assumption that it will collect principal plus interest on the second loan for 75 percent of those loans that do not default. The loan guarantee is slightly less expensive than the forgivable loan or grant due to the fact that it has a lower default rate and that it is assumed that it will only have to pay out 50 percent of the total defaulted mortgages.
Figure 8. Funding Costs by Scenario
Forgivable Second
Loan Grant Second Loan Loan Guarantee
# of DPA
Recipients 210 210 1199 725
8 year survival 88% 95% 88% 90%
Actual Survived 185 199 1055 652
Actual Defaulted 25 10 144 72
Cost to Provider $(11,366,783) $(11,366,783) $(4,192,894) $(9,472,319)
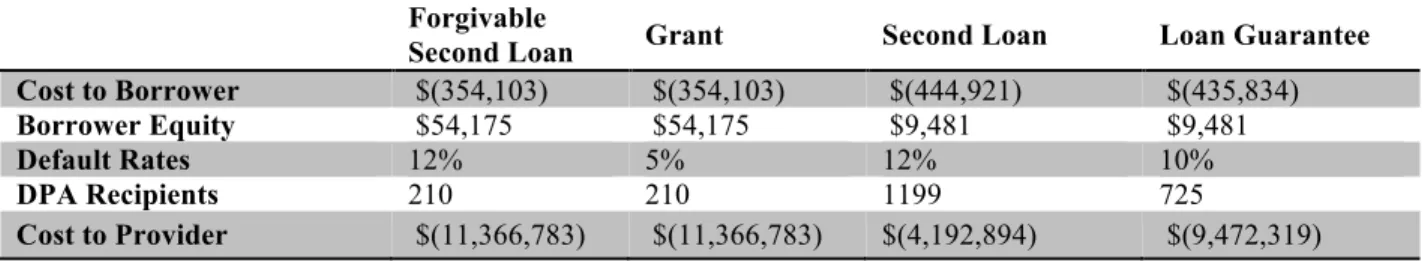
It is clear that the four public scenarios have very different impacts for the borrowers that utilize them and the agencies that administer them. Forgivable loans and grants are relatively the same except for the lower default rate assumed for grants given its lower loan to value ratio. The traditional second loan has the potential to serve many more borrowers and recoup funds at a much higher rate allowing for additional lending and coverage of administrative costs, but offers much less in assistance and is significantly more costly to the borrower. The loan guarantee offers some promise since it allows for a slightly lower loan to value and default rate than all of the options except for the grant. The loan guarantee also serves a significant number of borrowers compared to the forgivable loan and grant (see Figure 9).
Figure 9. Summary of Key Program Indicators
Forgivable
Second Loan Grant Second Loan Loan Guarantee
Cost to Borrower $(354,103) $(354,103) $(444,921) $(435,834)
Borrower Equity $54,175 $54,175 $9,481 $9,481
Default Rates 12% 5% 12% 10%
This financial analysis clearly shows varying impacts of down payment assistance scenarios on the borrower and the administering agency. Each program design has their tradeoffs. Private options seem to be the least feasible option given their costliness to the borrower and higher default rates. For the public options, traditional second loans are concerning given their higher default rates and cost to the borrower, however they are the least costly to the administering agency (without considering overhead). This would be even more of a problem if the down payment amount were raised to a similar level as the forgivable loan and grant. Grants seem to be preferable to forgivable loans given their lower loan to value and default rates.
Lessons Learned
This project has described how down payment requirements act as a barrier for LMI borrowers in obtaining a mortgage and purchasing a home. Down payment assistance is a way to bridge this gap and increase homeownership. Down payment assistance can take many forms. Matched savings accounts, tax credits, private market, loan guarantees, and soft second programs have been explored as possible policy responses to this problem. Given the policy goals outlined earlier in this paper, loan guarantees and grants were found to perform best in the financial modeling conducted. In this section, specific recommendations are outlined for effective down payment assistance programs based on each policy goal.
Stimulate Demand
To stimulate demand in local housing markets that are still lagging from the foreclosure crisis, it is recommended that the Federal Government make substantial investments in down payment assistance. This should include recreating the American Dream Downpayment Initiative or another federal initiative that would give direct federal funding to states and localities to support their down payment assistance work. Funding should also be expanded in order to have a large impact and stimulate the housing market in the short-term. For the long run, these federal allocations should be dependable to allow local programs to plan for sustainability. It is also important to preserve the flexibility on the ground to address local market nuances and customize program design as long as key requirements are fulfilled.
Skin in the Game
Research suggests that requiring skin in the game lowers the likelihood of default. For down payment assistance programs that are focused on increasing access to homeownership for LMI borrowers, this should mean continuing to provide substantial assistance while also creating requirements that insure investment and buy-in from the borrower. Strategies for requiring skin in the game could take many forms.
• Require participants to pay a certain percentage of the down payment or closing costs.
Some programs require at least $1,500 of participant investment in the process.
• Include “sweat equity” options similar to Habitat for Humanity where participants can
build equity through rehabilitation work in order to show investment.
• Make soft second loans forgivable after set tenure periods based on the amount of
assistance invested. Loans balances could be pro-rated each year to reflect a change in equity. Typically, loans are forgiven after three, five, or ten years.
• Finally, require fully documented underwriting and screen primary mortgage lenders that
Incentivize Homeownership in Marginalized Communities
Down payment assistance models have the potential to address homeownership in communities hard hit by the foreclosure crisis. It is recommended that states and municipalities target their limited down payment assistance resources in communities where other redevelopment activities are occurring. This targeting should include the following.
First, combine people and place-based strategies in order to maximize the benefit in marginalized communities. Continue to offer baseline down payment assistance programs based on income and housing price requirements. Then layer additional neighborhood-specific down payment assistance to incentivize homeownership in hard hit neighborhoods. This combination of incentives allows choice but ensures additional resources for communities most in need.
Second, states and municipalities should couple targeted down payment assistance programs with other redevelopment efforts and neighborhood stabilization resources. These efforts include requirements that borrowers participate in housing counseling and homebuyer education programs, additional affordable housing development, property rehabilitation efforts, and lease to purchase programs.
Additional Ideas for Further Research
Conclusion
Works Cited
Barakova, I., Bostic, R. W., Calem, P. S., & Wachter, S. M. (2003). Does Credit Quality Matter
for Homeownership? Journal of Housing Economics, 12, 318-336.
Closing Costs by State (2011). Bankrate.com.
http://www.bankrate.com/finance/mortgages/2011-closing-costs/closing-costs-by-state.aspx
Department of Housing and Urban Development (2011). Community Planning and Development Program Formula Allocations for FY 2011.
http://www.hud.gov/offices/cpd/about/budget/budget11/
Di, W., Ma, J., & Murdoch, J. C. (2009, June 1). An Analysis of the Neighborhood Impacts of
the Mortgage Assistance Program in Dallas. Networks Financial Institute Working Paper.
Di, Z., & Liu, X. (2005). The Importance of Wealth and Income in the Transition to
Homeownership . Harvard University.
Federal Housing Finance Administration (2011). Data on the Risk Characteristics and
Performance of Single-family Mortgages Originated from 2001 through 2008 and Financed in the Secondary Market. Table 3b: Percent of Single-Family Mortgages Originated from 2001 through 2008 and Acquired by the Enterprise or Financed with Private-Label MBS Ever 90-Days Delinquent by Loan-to-Value Ratio and Borrower FICO Score at Origination Fixed-Rate
Mortgages (FRMs). http://www.fhfa.gov/webfiles/16711/RiskChars9132010.pdf
Fowler, L. A., & Fuller, S. S. (2006). An Evaluation of Research on the Performance of Loans
with Down Payment Assistance. Fairfax, VA: Center for Regoinal Analysis, George Mason
University.
Home Mortgage Disclosure Act (2010). National Aggregate Tables: FHA, FSA/RHA, and VA home-purchase loans by tract, 1-4 family and manufactured homes. Atlanta, Georgia MSA. http://www.ffiec.gov/hmdaadwebreport/aggwelcome.aspx
Herbert, C. E., & Tsen, W. (2007). The Potential of Downpayment Assistance for Increasing
Homeownership Among Minority and Low-Income Households. Cityscape: A Journal of Policy
Development and Research, 9 (2), 153-194.
Housing and Urban Development. American Dream Downpayment Initiative. 13 June 2011. http://www.hud.gov/offices/cpd/affordablehousing/programs/home/addi/
Internal Revenue Service. Rev. Rul. 2006-27. Page 915. http://www.irs.gov/pub/irs- tege/rr2006-27.pdf.
Internal Revenue Service. First-Time Homebuyer Credit Questions and Answers: Basic Information. 17 August 2011.
Linneman, P., & Wachter, S. (1989). The Impact of Borrowing Constraints on Homeownership.
AREUEA Journal, 17 (4), 389-402.
Quercia, R. G., McCarthy, G. W., & Wachter, S. M. (2003). The Impacts of Affordable Lending
Efforst on Homeownership Rates. Journal of Housing Economics, 12, 29-59.
U.S. Government Accountability Office. (2005, November). Mortgage Financing: Additional Action Needed to Manage Risks of FHA-Insured Loans with Down Payment Assistance.
Zorn, P. (1989). Mobility-Tenure Decisions and Financial Credit: Do Mortgage Qualification
Appendix I: Survey Questions
Survey Questions
1. Please indicate how often each condition has been a factor over the past 12 months that
may have prevented reasonably qualified applicants from obtaining a mortgage today.
a. Down Payment Requirement Too High
• Most often
• Sometimes a barrier
• Rarely or Never
• I don’t know
b. Down Payment Sources Not Available
• Most often
• Sometimes a barrier
• Rarely or Never
• I don’t know
2. Considering the past 12 months, please indicate which of these types of loans, if any,
were most regularly used (at least 20% of the time). Please select all that apply.
• Adjustable Rate Mortgages
• Purchase/Rehab Loan
• Soft Second Mortgage or Down Payment Assistance
• Some Other Government Assistance Program
• 80/10/10 or 80/20’s – With a Lender Providing the Second Lien Financing to
Purchase
• Seller Contributions (Including Seller Financing or Seller Assistance with
Closing Costs/Down Payment)
• None
• I don’t know
3. How do you expect the availability of Down Payment Assistance (DPA) programs to
meet the needs of your clients in 2011?
• There is more than enough supply of DPA
• Supply and demand for DPA are about in balance
• There will be a modest shortfall of DPA funds available
• There will be a severe shortage of DPA available
4. Currently, are your clients being required to put down higher down payments than in the past? (CHECK BOXES)
• Yes
• No
• I don’t know
5. If your clients are being required to put down higher down payments, what are the
LOWEST down payment options generally available today?
• I don’t know/Decline to answer (CHECK BOX)
Appendix II: Down Payment Assistance Scenarios
Forgivable Second Loan
Value Definition
Base Program Funding $11,366,783 Based on 2010 HOME Funds for Atlanta, GA
Mortgage Principle $216,699
Based on the average mortgage amount for FHA loans made in LMI tracts in Atlanta, GA in 2010 from HMDA. Calculated by subtracting 20% down payment from selling price.
Interest Rate 3.5% Based on FHA base interest rate
Monthly Payment $973 Calculated based on 30 year fixed rate mortgage
Down Payment 20.0% Assumed 20% down payment
Buyer Equity $54,175 Selling price multiplied by 20% down payment
Mortgage Insurance $0 Private mortgage insurance not needed
DPA Interest 0.0% Assumed 0% interest for forgivable loan
Closing Costs $3,796 Based on Georgia average, Bankrate.com
Combined LTV 100% 80% primary mortgage, 20% forgivable loan
Loan Volume 4272 Based on the number of FHA loans made in LMI tracts in Atlanta, GA MSA in 2010 from HMDA
DPA Recipients 210 Calculated by dividing DPA Funding by Borrower
Equity
Coverage Rate 5% Calculated by dividing DPA Recipients by Loan Volume
Default Rate 12% Calculated by multiplying 10% default rate by 1.2
8 year survival 88% Calculated 100% minus 12% default rate
Actual Survived 185 Calculated by multiplying survival rate by DPA Recipients
Actual Foreclosed 25 Calculated DPA recipients minus Survived
Cost to Lender $(11,366,783) Assumes full DPA funding amount spent
Total Cost to Borrower $(354,103.08) Calculated by summing primary loan (principal and
Grant
Value Definition
Base Program Funding $11,366,783 Based on 2010 HOME Funds for Atlanta, GA
Mortgage Principle $216,699
Based on the average mortgage amount for FHA loans made in LMI tracts in Atlanta, GA in 2010 from HMDA. Calculated by subtracting 20% down payment from selling price.
Interest Rate 3.5% Based on FHA base interest rate
Monthly Payment $973 Calculated based on 30 year fixed rate mortgage
Down Payment 20.0% Assumed 20% down payment
Buyer Equity $54,175 Selling price multiplied by 20% down payment
Mortgage Insurance $0 Private mortgage insurance not needed.
DPA Interest 0.0% No interest for grant.
Closing Costs $3,796 Based on Georgia average, Bankrate.com
Combined LTV 80% 80% primary mortgage, 20% equity
Loan Volume 4272 Based on the number of FHA loans made in LMI tracts in Atlanta, GA MSA in 2010 from HMDA
DPA Recipients 210 Calculated by dividing DPA Funding by Borrower
Equity
Coverage Rate 5% Calculated by dividing DPA Recipients by Loan
Volume
Default Rate 5% Calculated by multiplying 10% default rate by .5
8 year survival 95% Calculated 100% minus 5% default rate
Actual Survived 199 Calculated by multiplying survival rate by DPA
Recipients
Actual Foreclosed 10 Calculated DPA recipients minus Survived
Cost to Lender $(11,366,783) Assumes full DPA funding amount spent
Total Cost to Borrower $(354,103.08) Calculated by summing primary loan (principal and
Traditional Second Loan
Value Definition
Base Program Funding $11,366,783 Based on 2010 HOME Funds for Atlanta, GA
Mortgage Principle $261,393
Based on the average mortgage amount for FHA loans made in LMI tracts in Atlanta, GA in 2010 from HMDA. Calculated by subtracting 3.5% down payment from selling price.
Interest Rate 3.5% Based on FHA base interest rate
Monthly Payment $1,174 Calculated based on 30 year fixed rate mortgage
Down Payment 3.5% Assumed 3.5% down payment
Buyer Equity $9,481 Selling price multiplied by 3.5% down payment
Monthly PMI $163 Selling price multiplied by 1.25% divided by 20
periods
Upfront PMI $4,574 Mortgage principal multiplied by 1.75%
PMI $7,841.79 Total private mortgage insurance calculated by adding monthly (1.25%) and upfront (1.75%) costs
DPA Interest 2.5% Assumed 2.5% interest rate for second loan
Second Loan Amount $10,725 Calculated using 2.5% fixed-rate with a 10-year amortization.
Second Loan Monthly
Payment $89
Calculated using 2.5% fixed-rate with a 10-year amortization.
Closing Costs $3,796 Based on Georgia average, Bankrate.com
Combined LTV 100% 96.5% primary mortgage, 3.5% second loan
Loan Volume 4272 Based on the number of FHA loans made in LMI
tracts in Atlanta, GA MSA in 2010 from HMDA DPA
Recipients 1,199
Calculated by dividing DPA Funding by Borrower Equity
% Coverage 28% Calculated by dividing DPA Recipients by Loan Volume
Default Rate 12% Calculated by multiplying 10% default rate by 1.2
8 year survival 88% Calculated 100% minus 12% default rate
Actual Survived 1055 Calculated by multiplying survival rate by DPA Recipients
Actual Foreclosed 144 Calculated DPA recipients minus Survived
Cost to Lender $(4,192,894)
Multiplied Buyer Equity times Actual Foreclosed minus the survived loan amount times a 75% collection rate.
Total Cost to Borrower $(444,921)
Loan Guarantee
Value Definition
Base Program Funding $113,667,830 Based on 2010 HOME Funds for Atlanta, GA as a 10% capitalization for a guarantee fund.
Mortgage Principle $261,393
Based on the average mortgage amount for FHA loans made in LMI tracts in Atlanta, GA in 2010 from HMDA. Calculated by subtracting 3.5% down payment from selling price.
Interest Rate 3.5% Based on FHA base interest rate.
Monthly Payment $1,174 Calculated based on 30 year fixed rate mortgage.
Down Payment 3.5% Assumed 3.5% down payment
Buyer Equity $9,481 Selling price multiplied by 3.5% down payment
PMI $0 Private mortgage insurance not needed.
DPA Interest 0.0% No interest included.
Closing Costs $3,796 Based on Georgia average, Bankrate.com
Combined LTV 97% 96.5% primary mortgage, 3.5% equity
Loan Volume 4272 Based on the number of FHA loans made in LMI tracts in Atlanta, GA MSA in 2010 from HMDA
# of DPA
Recipients 725
Calculated by dividing DPA Funding by Borrower Equity
% Coverage 17% Calculated by dividing DPA Recipients by Loan Volume
Default Rate 10% Assumed rate based on UNC Center for Community
Capital research
8 year survival 90% Calculated 100% minus 12% default rate
Actual Survived 652 Calculated by multiplying survival rate by DPA
Recipients
Actual Foreclosed 72 Calculated DPA recipients minus Survived
Cost to Lender $(9,472,319)
Calculated Mortgage Principal times Actual
Foreclosures times 50% discount for principal already paid.
Total Cost to Borrower $(435,834) Total cost of primary loan (principal and interest) plus
Private Loan
Value Definition
Base Program Funding n/a n/a
Mortgage Principle $274,670
Based on the average mortgage amount for FHA loans made in LMI tracts in Atlanta, GA in 2010 from HMDA. Includes 100% LTV plus closing costs plus PMI
Interest Rate 5.5% Based on FHA base interest rate
Monthly Payment $1,560 Calculated based on 30 year fixed rate mortgage
Down Payment 0.0% Assumes 0% down payment
Buyer Equity $0 Selling price multiplied by 0% down payment
Monthly PMI $172 Selling price multiplied by 1.25% divided by 20 periods
Upfront PMI $4,807 Mortgage principal multiplied by 1.75%
PMI $8,240.09 Total private mortgage insurance calculated by adding monthly (1.25%) and upfront (1.75%) costs
DPA Interest 0.0% Included in primary loan.
Closing Costs $3,796 Based on Georgia average, Bankrate.com
Combined LTV 101% Loan is 101% of selling price, includes closing costs
Loan Volume 4272 Based on the number of FHA loans made in LMI
tracts in Atlanta, GA MSA in 2010 from HMDA # of DPA
Recipients n/a n/a
% Coverage n/a n/a
Default Rate 13% Calculated by multiplying 10% default rate by 1.3
8 year survival 88% Calculated 100% minus 12% default rate
Actual Survived n/a n/a
Actual Foreclosed n/a n/a
Cost to Lender n/a n/a
Remaining DPA Funds n/a n/a
Total Cost to Borrower $(569,676) Calculated by adding cost of primary loan (principal