Analyzing microbial contaminants in
Stormwater in Beaufort, NC
Allison Kline
1, Rachel T. Noble
1, Lauren Hermley
21
Institute of Marine Sciences, University of North Carolina at Chapel Hill
2Town of Beaufort, North Carolina
Abstract
Fecal indicator bacteria (FIB) concentrations, namely E. coli and Enterococcus, were measured in four stormwater ditches and two actively discharging outfall pipes in the town of Beaufort, North Carolina. The area of Beaufort that was sampled is mostly residential. Samples were collected from September 5th through November 17th, 2014 and captured a wide range of weather conditions, including dry weather (standing water) and several storm events. It was found that during wet weather, levels of Enterococcus and E. coli increased significantly as compared to levels observed during dry weather (p=0.027, p=0.031). It was also found that during wet weather the strength of the correlation, indicating the predictive relationship between Enterococcus and E. coli increased substantially as compared to that observed during dry weather (r=0.000 and r=0.802, n=28). In addition, the relative amount of E. coli as compared to Enterococcus (i.e. the ratio) increased. The strong difference observed in this correlation between dry and wet weather indicates that the source of fecal contamination during storm events is due to a fresh fecal contamination source. The specific source (animal or human), however, cannot be determined from this study design. The data collected from this project indicate the need for further stormwater-related monitoring and assessment in the Town of
Beaufort.
Keywords: fecal indicator bacteria, stormwater, E. coli, Enterococcus, rainfall
1. Introduction
Fecal indicator bacteria (FIB) are bacteria used in the United States and throughout the world to assess the level of contamination of drinking water and
its observed relationships to human health outcomes (Wade et al. 2010, Colford et al. 2012). In one study in California beaches, Enterococcus was found to exceed regulatory standards most often compared to Total and Fecal Coliforms, placing it as a more cautionary fecal indicator (Noble et al 2003). E. coli has been shown to be superior FIB in freshwater, as in freshwater environments it has been more strongly related to human health outcomes for recreation (Marion et al. 2010) and is often used in other states for a water quality standard, as well as used in North Carolina shellfish regulations (Pruss, 1998, NCDENR).
Potentially harmful contaminants in stormwater runoff have become an ever-increasing problem in the USA due to the increases in urbanization and therefore impervious surface coverage. The percent of impervious surface coverage is the largest human impact influencing fecal indicator bacteria (FIB) concentrations in estuarine waters (Mallin et al., 2000). Increases in percent impervious surface coverage increases stormwater runoff volume and rate of transport of contaminants, which can have detrimental impacts on receiving waters. Additionally studies have shown that fecal indicator bacteria attach to sediment particles, which increases the rate of transport from stormwater to receiving waters (Fries et al 2006, Jeng et al 2005). Rainfall has been correlated with disease outbreaks due to transport from stormwater in areas with high agricultural runoff and septic leaks (Curriero et al, 2001). Studies have also shown contaminants from stormwater to be toxic to aquatic species (Bay et al 2003).
Additionally, contaminants and pathogens in stormwater can persist far downstream in receiving waters, making the harmful impacts to aquatic species and human health wide-spread in the system (DiGiacomo, 2004, Crowther et al., 2002, Jamieson et al 2003). There are a plethora of contaminants that can enter receiving waters from stormwater discharge such as heavy metals, chemicals, personal health products, and pathogens. In this study, we will focus on FIB as a proxy for these pathogens. Several studies have shown that urban stormwater runoff has correlated with deteriorating microbial water quality specifically in receiving waters (Crabill et al 1999, Jeng et al 2005). Furthermore, as climate change becomes more of an issue, research on microbial agents has indicated that the risk to human health from microbial pollutants will only increase (Rose et al 2001).
The Town of Beaufort, NC (Fig 1), where this study was conducted, encompasses a land area of 4.62 square miles, has a total population of 4,199 and a population density of 909 people per square mile (Beaufort, NC Data & Demographics). It is characterized by a shallow depth to groundwater and a low gradient. This has made the town
particularly susceptible to flooding issues. The Town of Beaufort was interested in conducting a study of stormwater to begin to characterize contamination in the
stormwater that could potentially transport downstream to receiving waters. This study was conducted in order to begin to characterize FIB in stormwater in Beaufort, NC.
The objective of this study was to quantify concentrations of fecal indicator bacteria in stormwater in Beaufort, NC in order to characterize background
Table 1: Regulation standards used in North Carolina and in the United States for recreational waters. Most Probable Number (MPN) of bacteria comes from the IDEXX laboratories method of quantifying bacterial concentrations and Colony Forming Units (CFU) comes from the colony growing method of quantifying bacterial concentrations.
Recreational water single sample standard (CFU or MPN/100 mL)
Recreational water quality 5-day Geometric mean standard (CFU or MPN/100 mL)
Shellfish Sanitation standard (CFU/100 mL only)
Enterococcus 104 35* N/A
E. coli 320* 100* 14
Total Coliforms >10,000* N/A N/A
*Not used in North Carolina, but placed here as a reference for contamination
Figure 1: Map of Beaufort, NC
2. Materials and Methods
2.1 Site Classification
From September 5th to November 17th 2014 water samples were taken from six
different stormwater sites in Beaufort, North Carolina (Fig. 2). The Sites were classified as represented in Table 3. Two sites were actively discharging outfall pipes at the ends of Orange and Gordon Streets. The outfall pipe at Site 1 was above the water line at low tide and partially submerged at high tide. The Site 2 pipe was fully submerged below the water line throughout the entire tidal cycle. The other four sampled sites were in a separate stormwater system to the Northeast from these two sites (Fig 2). Table 2
displays all dates sampled and rainfall amount for each sample day. On October 31st and November 1st, samples were not taken from Site 4 due to a grate being placed over the manhole. On November 11th and November 17th samples taken for Site 4 were taken across the street, still on the corner of Carteret and Mulberry streets. Site 5 was downstream of Sites 3 and 4. Site 6 was located downstream of sites 3, 4, and 5. All Sites consistently contained water on all sample days and on days after rainfall the standing water levels were higher in the stormwater ditches.
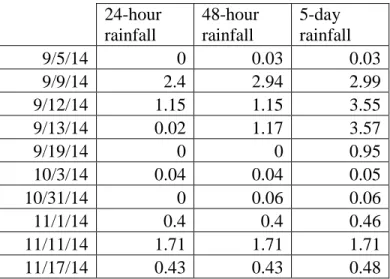
Table 2. Dates sampled and rainfall amount in inches
Table 3. Site classification, location and description 24-hour
rainfall
48-hour rainfall
5-day rainfall
9/5/14 0 0.03 0.03
9/9/14 2.4 2.94 2.99
9/12/14 1.15 1.15 3.55
9/13/14 0.02 1.17 3.57
9/19/14 0 0 0.95
10/3/14 0.04 0.04 0.05
10/31/14 0 0.06 0.06
11/1/14 0.4 0.4 0.46
11/11/14 1.71 1.71 1.71
Number
classification Location Description
1 End of Orange Street Outfall pipe
2 End of Gordon Street Outfall pipe
3 Corner of Carteret and Pine Streets Ditch with standing water
4 Corner of Carteret and Mulberry Streets
Manhole / Ditch with standing water
5 Corner of Craven and 1st Streets Ditch with standing water
6 Live Oak Street across from the Outerbanks Seafood restaurant
Ditch with standing water, leads to stream and receiving waters
Figure 2: Map of study area and stormwater sample sites
2.2 Water Sample Collection
Samples were taken in a wide range of weather events, both during dry and wet weather. Wet weather samples were taken after a minimum rainfall of 0.4 inches. Rainfall was measured using hour-by-hour measures from Weather Underground at Smith Airport station in Beaufort, North Carolina (Weather Underground). Samples were taken within one hour of low tide with three exceptions. This was to account for salinity changes in the water due to possible backwash in the stormwater during high tide. Samples were
collection. Water from Site 1 was collected directly from the pipe, and water from Site 2 was collected directly from the creek immediately downstream from the end of the outfall pipe, which was submerged below the water level. After collection, samples were
immediately placed in a dark, insulated cooler with ice packets to prevent growth of bacteria during transport to the laboratory.
2.3 Laboratory methods
After water samples were taken back to the laboratory, they were processed within two hours of being collected. Salinity was measured using a digital refractometer. Each sample was tested for total coliforms, E. coli, and Enterococcus using defined substrate technology (DST) kits from IDEXX Laboratories, Colilert-18® and
Enterolert™. In duplicate, subsamples of 10, 1, or 0.1 mL volumes were diluted with deionized water to bring total volumes to 100 ml in in sterilized plastic vessels. The selected dilutions depended on projected bacterial concentrations and rainfall. After pouring the water samples into the vessels, media was added and mixed until the reagent dissolved. Colilert-18® was used for Total Coliforms and E. coli enumeration and Enterolert™ was used for Enterococcus spp. enumeration. The vessel samples were then poured into a Quanti®-Tray/2000 tray. The trays were then sealed with the IDEXX Quanti® -Tray sealer and placed in an incubator overnight. Quanti-Trays were incubated at 35°C for Total Coliforms and E. coli for 18 to 22 hours. Trays testing for Enterococcus were placed in an incubator at 41°C and incubated for 22 to 24 hours. After the
incubation period, colored wells and/or fluorescent wells were counted on each tray. The media contains an enzyme substrate that is metabolized by the bacteria and either
fluoresces or changes color to indicate growth. Using the number of wells that are
positive and negative a Most Probable Number (MPN) of Fecal Indicator Bacteria can be calculated using the IDEXX Most Probable Number table (Hurley and Roscoe 1983) per 100 ml volumes. The MPN of bacteria for each duplicate vessel was averaged and then log transformed for graphical representation and comparison.
3. Results
3.4 E. coli to Enterococcus relationship
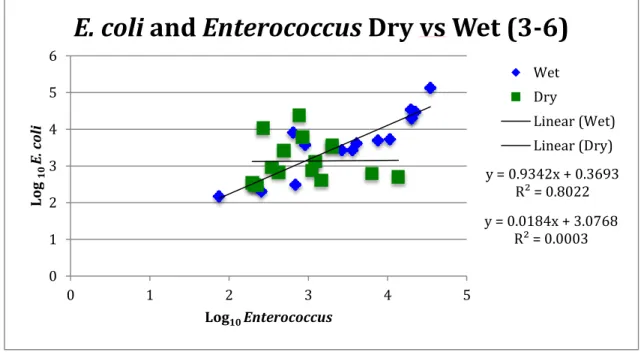
The relationship between E. coli and Enterococcus changed dramatically between dry and wet weather (Fig. 3). Dry weather presented a weak correlation (r=0.000)
between Enterococcus and E. coli, while wet weather presented a strong correlation (r=0.802) between the two FIB. The ratio of E. coli to Enterococcus also changed
3.2 Fecal Indicator Bacteria Patterns
Figure 4: Geometric mean of all sampling events separating dry and wet weather for Enterococcus and E. coli. Error bars are standard deviation from the mean.
Figure 4 displays a great difference between dry and wet weather. With Enterococcus the difference between wet and dry weather was statistically significant Figure 3: Log transformed MPN of Enterococcus against Log transformed MPN of E. coli for Sites 3 – 6. All sampling dates are included to quantify correlation and ratio between the two fecal indicator bacteria
y = 0.9342x + 0.3693 R² = 0.8022 y = 0.0184x + 3.0768
R² = 0.0003 0 1 2 3 4 5 6
0 1 2 3 4 5
Log 10 E. c ol i
Log10 Enterococcus
E. coli
and
Enterococcus
Dry vs Wet (3-6)
Wet Dry Linear (Wet) Linear (Dry) 0 0.5 1 1.5 2 2.5 3 3.5 4 4.5 5
1 2 3 4 5 6
Lo g10 E. co li Site
Geomean
E. coli
concentrations
Wet vs. Dry weather
Dry
Wet
E. coli 5-day geomean EPA recommendation 0 0.5 1 1.5 2 2.5 3 3.5 4 4.5 5
1 2 3 4 5 6
Lo g10 En te ro co cc u s Site
Geomean
Enterococcus
concentrations Wet vs.
Dry weather
Dry
Wet
(p=0.027). With E. coli the difference was statistically significant (p=0.031) when excluding Site 2.
Figure 5: Geometric mean of all sampling events separating dry and wet weather for Total Coliforms. Error bars are standard deviation from the mean.
3.1 Patterns
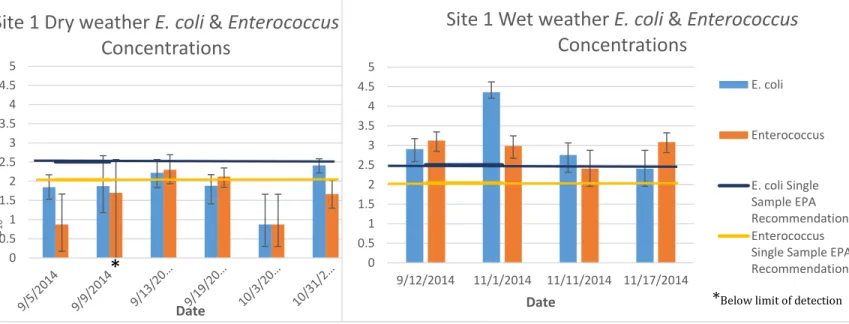
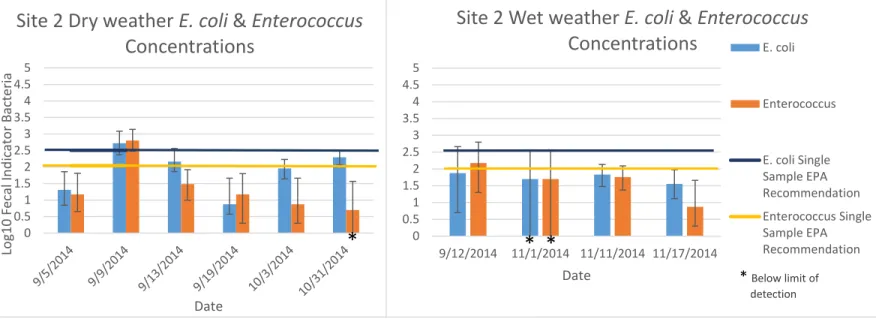
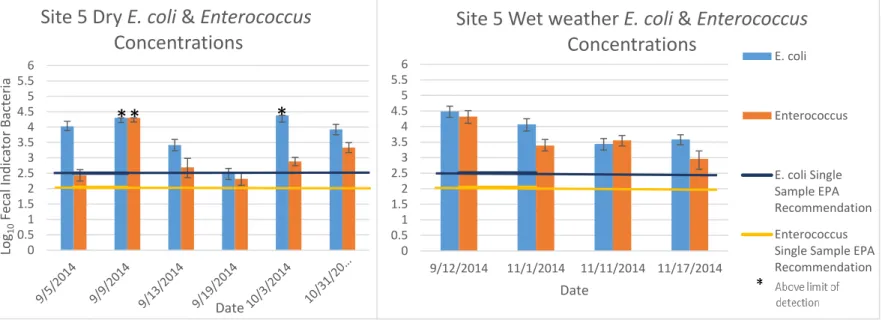
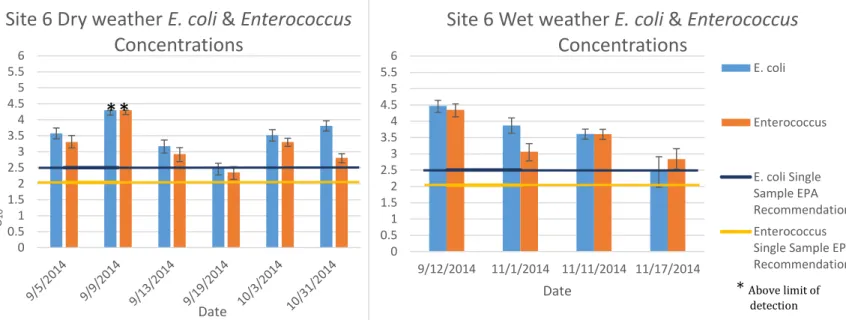
The dates October 31st and November 1st display conservative values for Enterococcus contamination due incubation at an incorrect temperature during sample processing. Sites 1 and 2 were the least contaminated sites, with Site 2 being the least contaminated by far, as well as having the smallest difference between dry and wet weather (Tables 4, 5). Sites 1 and 2 also displayed a distinct increase in the E. coli to Enterococcus ratio during wet weather on average (Fig 6, Fig 7). Sites 3 and 4 were very similar in levels of FIB contamination; they also displayed an on average increase in E. coli to Enterococcus ratio during wet weather (Fig 8, Fig. 9, Tables 4, 5). Site 3 had a very large spike in E. coli concentrations on Sept 12th reaching levels of over 120,000 MPN E. coli (Table 4).Gaps in Site 4 were due to an inability to sample from a grate being placed on the sample site. Sites 5 and 6 were the most contaminated sites (Tables 4, 5). Site 5 was the most contaminated for E. coli and the second most for Enterococcus and Site 6 was the most contaminated for Enterococcus and the second most for E. coli. Site 5 had the greatest difference between dry and wet weather and Site 6 had the second-most greatest difference between dry and wet weather (Fig 10, Fig 11).
0 1 2 3 4 5 6 7
1 2 3 4 5 6
Lo
g10
To
ta
l Colif
o
rm
Site
Geomean Total Coliform concentrations Wet
vs. Dry weather
Dry
Table 4: Maximum and minimum MPN of E. coli and Enterococcus for each site in both dry and wet weather
Site
Range of E. coli
concentrations wet weather
Range of E. coli concentrations dry weather Range of Enterococcus concentrations wet weather Range of Enterococcus concentrations dry weather
1 530-22985 7.5-258 255-1330 7.5-199
2 7.5-199 36-75 7.5-30.5 7.5-150
3 150-136350 405.7-910.5 75-34750 347.5-6356.5
4 205-34300 343-747 255-19600 196-13715
5 2755-30650 306.5-24197 910-20900 209-2158.9
6 310-29650 296.5-6436.5 690-22450 224.5-2002
Table 5: Mean MPN of E. coli and Enterococcus for each site in dry and wet weather
Site
Mean E. coli wet weather
Mean E. coli dry weather Mean Enterococcus wet weather Mean Enterococcus dry weather
1 5029 105.5333 860 80.2
2 62.2 102.7333 66.25 13.1
3 31570 651.7333 10762.5 1876.65
4 10631.25 569.25 8292.5 3862.19
5 13806.6 9248.5 11365.25 778.8333
6 13169.6 3977.65 11810.25 1142.9
0 0.5 1 1.5 2 2.5 3 3.5 4 4.5 5 Lo g10 Fe cal In d icato r Bacteria Date
Site 1 Dry weather
E. coli
&
Enterococcus
Concentrations
E. coli
Enteroco ccus
*
* Below limit of detection 0 0.5 1 1.5 2 2.5 3 3.5 4 4.5 5
9/12/2014 11/1/2014 11/11/2014 11/17/2014
Date
Site 1 Wet weather
E. coli
&
Enterococcus
Concentrations
E. coli
Enterococcus
E. coli Single Sample EPA Recommendation Enterococcus Single Sample EPA Recommendation
Figure 6: Average MPN fecal indicator bacteria log transformed for Site 1 on each sample date separating dry and wet weather. Error bars are 95% confidence intervals; the E. coli and Enterococcus EPA recommendation levels are added for reference.
Figure 7: Average MPN fecal indicator bacteria log transformed for Site 2 on each sample date separating dry and wet weather. Error bars are 95% confidence intervals; the E. coli and Enterococcus EPA recommendation levels are added for reference.
Figure 8: Average MPN fecal indicator bacteria log transformed for Site 3 on each sample date separating dry and wet weather. Error bars are 95% confidence intervals; the E. coli and Enterococcus EPA recommendation levels are added for reference.
0 0.5 1 1.5 2 2.5 3 3.5 4 4.5 5 Lo g10 Fe cal In d icato r Bacteria Date
Site 2 Dry weather
E. coli
&
Enterococcus
Concentrations
E. coliEnterococcus
E. coli Single Sample EPA Recommendation
Enterococcus Single Sample EPA Recommendation * Below limit of
detection
*
0 0.5 1 1.5 2 2.5 3 3.5 4 4.5 59/12/2014 11/1/2014 11/11/2014 11/17/2014 Date
Site 2 Wet weather
E. coli
&
Enterococcus
Concentrations
E. coliEnterococcus
E. coli Single Sample EPA Recommendation Enterococcus Single Sample EPA Recommendation
* Below limit of detection
* *
0 0.5 1 1.5 2 2.5 3 3.5 4 4.5 5 5.5 6 Lo g10 Fe cal In d icato r Bacteria DateSite 3 Dry weather
E. coli
&
Enterococcus
Concentrations
E. coli
Enterococcus
E. coli Single Sample EPA Recommendation
Enterococcus Single Sample EPA Recommendation
**
* Below limit of detection 0 0.5 1 1.5 2 2.5 3 3.5 4 4.5 5 5.5 6
9/12/2014 11/1/2014 11/11/2014 11/17/2014 Date
Site 3 Wet weather
E. coli
&
Enterococcus
Concentrations
E. coli
Enterococcus
Figure 9: Average MPN fecal indicator bacteria log transformed for Site 4 on each sample date separating dry and wet weather. Error bars are 95% confidence intervals; the E. coli and Enterococcus EPA recommendation levels are added for reference. On 10/31 and 11/1, this site was not sampled due to a grate being placed over the sampling site.
Figure 10: Average MPN fecal indicator bacteria log transformed for Site 5 on each sample date separating dry and wet weather. Error bars are 95% confidence intervals; the E. coli and Enterococcus EPA recommendation levels are added for reference.
0 0.5 1 1.5 2 2.5 3 3.5 4 4.5 5 5.5 6 Lo g10 Fe cal in d icato r Bacteria Date
Site 4 Dry weather
E. coli
&
Enterococcus
Concentrations
E. coli
Enterococcus
E. coli Single Sample EPA Recommendation Enterococcus Single Sample EPA Recommendation 0 0.5 1 1.5 2 2.5 3 3.5 4 4.5 5 5.5 6
9/12/2014 11/1/2014 11/11/2014 11/17/2014 Date
Site 4 Wet weather
E. coli
&
Enterococcus
Concentrations
E.coliEnterococcus
E. coli Single Sample EPA Recommendation Enterococcus Single Sample EPA Recommendation 0 0.5 1 1.5 2 2.5 3 3.5 4 4.5 5 5.5 6 Lo g10 Fe cal In d icato r Bacteria Date
Site 5 Dry
E. coli
&
Enterococcus
Concentrations
E. coli
Enterococcus
E. coli Single Sample EPA Recommendat ion
**
*
* Above limit of detection 0 0.5 1 1.5 2 2.5 3 3.5 4 4.5 5 5.5 6
9/12/2014 11/1/2014 11/11/2014 11/17/2014 Date
Site 5 Wet weather
E. coli
&
Enterococcus
Concentrations
E. coli
Enterococcus
E. coli Single Sample EPA Recommendation
Figure 11: Average MPN fecal indicator bacteria log transformed for Site 6 on each sample date separating dry and wet weather. Error bars are 95% confidence intervals; the E. coli and Enterococcus EPA recommendation levels are added for reference.
Figure 12: Average MPN Total Coliform bacteria log transformed for Sites 1 and 2 on each sample date for dry weather. Error bars are 95% confidence intervals; the Total coliform recommendation level from previous California recreational water quality regulations is added for reference.
0 0.5 1 1.5 2 2.5 3 3.5 4 4.5 5 5.5 6
9/5/2014 9/9/2014 9/13/2014 9/19/2014 10/3/2014 10/31/2014
Log 10 To ta l C ol ifo rms Date
Total Coliforms Dry Weather Sites 1&2
Site 1
Site 2
Total Coliform single sample standard (California)
*
* Above limit of
detection 0 0.5 1 1.5 2 2.5 3 3.5 4 4.5 5 5.5 6 Lo g10 Fe cal In d icato r Bacteria Date
Site 6 Dry weather
E. coli
&
Enterococcus
Concentrations
E. coli
Enterococcus
E. coli Single Sample EPA Recommendation Enterococcus Single Sample EPA Recommendation * Above limit of
detection
**
0 0.5 1 1.5 2 2.5 3 3.5 4 4.5 5 5.5 69/12/2014 11/1/2014 11/11/2014 11/17/2014 Date
Site 6 Wet weather
E. coli
&
Enterococcus
Concentrations
E. coli
Enterococcus
Figure 13: Average MPN Total Coliform bacteria log transformed for Sites 1 and 2 on each sample date for wet weather. Error bars are 95% confidence intervals; the Total coliform recommendation level from previous California recreational water quality regulations is added for reference.
0 0.5 1 1.5 2 2.5 3 3.5 4 4.5 5 5.5 6
9/12/2014 11/1/2014 11/11/2014 11/17/2014
Lo
g10
To
ta
l Colif
o
rm
s
Date
Total Coliforms Wet Weather Sites 1&2
Site 1
Site 2
Total Coliform single sample standard (California)
*
* Above limit of detection
0 0.5 1 1.5 2 2.5 3 3.5 4 4.5 5 5.5 6
9/5/2014 9/9/2014 9/13/2014 9/19/2014 10/3/2014 10/31/2014
Lo
g10
To
ta
l Colif
o
rm
s
Date
Total Coliforms Dry Weather Sites 3-6
Site 3Site 4
Site 5
Site 6
Total Coliform single sample standard (California)
****
****
*
****
**
Figure 14: Average MPN Total Coliform bacteria log transformed for Sites 3 - 6 on each sample date for dry weather. Error bars are 95% confidence intervals; the Total coliform recommendation level from previous California recreational water quality regulations is added for reference.
Figure 15: Average MPN Total Coliform bacteria log transformed for Sites 3 - 6 on each sample date for wet weather. Error bars are 95% confidence intervals; the Total coliform recommendation level from previous California recreational water quality regulations is added for reference.
0 0.5 1 1.5 2 2.5 3 3.5 4 4.5 5 5.5 6 6.5 7
9/12/2014 11/1/2014 11/11/2014 11/17/2014
Lo
g10
To
ta
l Colif
o
rm
s
Date
Total Coliforms Wet Weather Sites 3-6
Site 3
Site 4
Site 5
Site 6
Total Coliform single sample standard (California)
*
Table 6: A table comparing contamination of FIB between sites. “yes” refers to a
significant difference between the sites and “no” refers to no significant difference being found. Sites 1 and 2 were most dissimilar to the other sites, for E. coli there was a
surprising significant difference between Sites 3 and 5, and a surprising lack of difference between sites 1 and 4 for both E. coli and total coliforms
Enterococcus E. coli
Total coliforms
1&2 no no yes
1&3 yes no yes
1&4 yes no no
1&5 yes yes yes
1&6 yes yes yes
2&3 yes yes yes
2&4 yes yes yes
2&5 yes yes yes
2&6 yes yes yes
3&4 no no no
3&5 no yes no
3&6 no no no
4&5 no no no
4&6 no no no
5&6 no no no
3.3 Rainfall and Salinity
We observed a significant trend in the data that demonstrated a higher concentration of FIB after rainfall events for all three time periods of rainfall.
Table 7: Table of P-values of relationship between rainfall and E. coli. The coefficient of the regression refers to how many E. coli are added with rainfall (in this case it is log transformed concentration of E. coli). The constant value is the value of concentration of E. coli (again log transformed here) we would predict if rainfall was 0. We can use it as an estimate of background concentrations without rainfall).
Relationship between Rainfall and E. coli P-values
Site 24 hr 48 hr 5 day
1 0.001 0.003 0.004
2 0.118 0.124 0.126
3 0.035 0.037 0.039
4 0.044 0.049 0.054
5 0.000 0.000 0.000
6 0.001 0.001 0.001
All sites 0.013 0.021 0.025
coefficient 0.4089 0.338 0.216
constant 2.69 2.67 2.6388
Table 8. Table of P-values of relationship between rainfall and Enterococcus. The coefficient of the regression refers to how many Enterococcus are added with rainfall (in this case it is log transformed concentration of Enterococcus). The constant value is the value of concentration of Enterococcus (again log transformed here) we would predict if rainfall was 0. We can use it as an estimate of background concentrations without rainfall.
Relationship between Enterococcus and Rainfall P-values
Site 24 hr 48 hr 5 day
1 0.000 0.000 0.000
2 0.043 0.051 0.053
3 0.006 0.008 0.008
4 0.001 0.002 0.002
5 0.001 0.001 0.001
6 0.000 0.001 0.001
overall 0.002 0.005 0.006
coefficient 0.5102 0.4118 0.265
constant 2.39 2.376 2.334
Relationship between Total Coliforms and Rainfall P-values
Site 24 hr 48 hr 5 day
1 0.058 0.082 0.000
2 0.004 0.004 0.002
3 0.024 0.025 0.013
4 0.056 0.059 0.05
5 0.031 0.032 0.018
6 0.022 0.022 0.012
overall 0.133 0.163 0.005
coefficient 0.229 0.189 0.247
constant 4.299 4.28 4.083
4. Discussion
It is known from the literature that storm events/wet weather bring a higher load of FIB (Noble et al 2003, Parker et al 2010, Converse et al 2011, Stumpf et al 2010). Due to the distinct increase in correlation between Enterococcus and E. coli as well as the increased ratio of E. coli to Enterococcus in wet weather, there is a supported indication that the high levels of contamination in the storm water are due to a fresh fecal source. In raw human sewage, the E. coli to Enterococcus ratio is around 5:1. This is due to the number of E. coli and Enterococcus that are in most mammals’ intestinal linings. The ratio in humans is much higher than other mammals. So in wet weather, when all the contaminants from the storm drains, roads, and lands wash into the stormwater, and this ratio increases, it gives an indication that there is fecal contamination in the area. Additionally, because both Enterococcus and E. coli come from the same place, if the relationship (i.e. correlation) between them increases it is also an indication of fecal contamination (Hai, Lin and Cai Hongdao, 1982). Additionally, molecular methods of detection have been a promising alternative that aid in determining source of fecal
pollution (Parker et al 2010, Converse et al 2009, Sauer et al 2011, Noble et al 2006), and for this study in particular, PCR or Quantitative PCR would need to be used to conclude for certain what this fresh fecal source was, because just the increase in correlation and ratio does not tell us the source (animal or human).
where backwash could reach that far considering that Sites 3-6 are not in the same system as the outfall pipes, the highest cause of salinity changes would be from this plant.
With the large difference between wet and dry weather at particularly Sites 3, 4, 5 and 6, there is reason to infer that these sites are near a source of high bacterial
concentrations. The pattern of stormwater flow in the system that includes sites 3 through 6 flows downstream from site 3 to site 6. Stormwater from other areas washes in and increases volume of flow while travelling downstream. A conclusion to be made from this would be that as water volume increases so does dilution of the microbial
contaminants, however, in this system there is no statistically significant change between sites 3 through 6 (Table 6) and as seen in Figure 4, if anything there is an increase in contamination as water travels downstream. This gives some indication that either the contamination is everywhere, and so dilution is ineffective, or that the fecal indicator bacteria are growing in the environment. From Figure 3, there was seen almost a baseline of contamination even in dry weather, and in Table 9 looking at the y-intercept/ constant values there is seen a baseline contamination around 10,000 MPN/ 100 mL of total coliforms, and Tables 7 & 8 show a baseline contamination of around 200 MPN/ 100 mL of Enterococcus and 400 MPN/mL of E. coli, which may support the idea that these bacteria could be growing in the environment. In reference to the FIB regulations for NC in Table 1, while Sites 3-6 were consistently over the single sample standard for both E. coli and Enterococcus (Tables 4, 5), it is important to note that these concentrations are not regulatory for stormwater. However, as stated before, the concentrations of bacteria are not decreasing as they travel downstream and discharge into Town Creek after Site 6. These concentrations are consistently high that if the bacteria persist as they travel downstream it could cause negative effects on the aquatic systems perhaps by
decomposing more phytoplankton and allowing for more hypoxic/anoxic conditions in the receiving waters, and altering ecosystem function (Baird et al., 2004).
Figures 12-15 show results from the analysis of Total Coliform concentration data. Using the Total Coliform regulatory limit from California recreational water quality standards for reference, it is seen that even though many times the total coliform
concentrations were above the limit of detection there is still a very significant level of contamination. Even Site 2, which was the least contaminated site (and also directly taken from Taylor’s Creek) at times went above the regulatory limit, and Sites 3-6 were consistently above this line. These concentrations pose a concern for public health even though total coliforms are not included in the North Carolina regulations for recreational water quality.
This study along with multiple others demonstrates that high FIB contamination in stormwate is not specific to just Beaufort, NC. A study characterizing FIB in
stormwater in NC done by Parker et al in 2010 characterized two outfalls along Emerald Isle and Atlantic Beach and one in Town Creek Marina in Beaufort, NC. Site 6 from this study discharges into an unnamed body of water (Figure 1), which then flows to Town Creek, which is near shellfishing waters and recreational swimming areas. By looking at these previous literature values, there can be seen some idea of transport of these
reached 1.36x10⁶ and Enterococcus spp. reached concentrations of 3.48x10⁴
MPN/100mL. Similar to the Parker et al study, this study had bacterial concentrations consistently above the recreational water quality limit for all three FIB and gives an indication that this contamination is not only in stormwater, but also in receiving waters (Parker et al 2010). A stormwater pilot project measuring FIB concentrations at ocean stormwater outfalls along the coast of NC found similar levels of contamination that this study found with Enterococcus concentrations with magnitude 104 MPN/100 mLand E. coli concentrations with magnitude 103 MPN/100 mL at concentrations consistently above regulatory limits for recreational waters. The Enterococcus concentrations found in the pilot study were on average higher than concentrations found in this study, but E. coli concentrations found in this study are higher than in the outfall study. This is probably due to the higher salinity found at ocean outfalls. The outfall study also found that subsequent rainfall events had a greater effect on the consistently high concentrations of FIB (Lauer 2016). Even though sites 3-6 in this study are stormwater ditches that only indirectly discharge into receiving waters, these concentrations are still of concern as stormwater provides quick transport to recieiving waters, especially in rainfall events, these FIB travel all the way to Town Creek and could possibly cause closings of both nearby shellfishing waters and recreational swimming waters. Additionally, because of flooding issues that Beaufort has experienced due to the low elevation of the land, which serves as a point of exposure to anyone who comes into contact with the water. A study in Dare County, NC measuring stormwater concentrations along ocean outfalls found concentrations of both E. coli and Enterococcus at magnitudes averaging near 103 MPN/100 mL, but ranging up to concentrations of 105 MPN/100mL, which is consistent
with concentrations we find in this study especially in Sites 3-6 that discharge into Town Creek (Converse et al 2011). Another Study in the Neuse River Estuary in North Carolina measuring FIB load in tidal creeks found median concentrations of magnitude 102
MPN/100mL ranging in the thousands MPN per 100 mL (Stumpf et al 2010). Stormwater FIB contamination is not just an issue in Beaufort, and because of the quick transport stormwater lines provide bacteria especially after storm events, high concentrations of FIB will continually enter recreational waters such as these.
The EPA recommendation limit for E. coli for single-full-body immersion exposure with recreational water is 576 MPN/100 mL, which is well below, at points more than 3 orders of magnitude, the concentrations represented in this study. Similar to the outfall study, this study similarly shows the impact of subsequent rainfall events. By analyzing the 5- day rainfall metric and significance in Table 9, it is seen that the
relationship between 5 day rainfall accumulation and Total coliforms is stronger than the relationship between 24 hr rainfall accumulation, and in Tables 7 & 8 all rainfall metrics have essentially the same level of effect. This gives an indication that accumulated rainfall is a significant effect on FIB that goes beyond the “first flush” idea that is seen in the literature.
5. Conclusions
It was concluded that stormwater in Beaufort, North Carolina is a concern to public health, particularly at outfall sites that discharge directly into Taylor’s Creek. Due to the shallow depth to groundwater, low gradient, and lack of space in Beaufort, there are fewer options for controlling this concern. Mohanty et al did a study of removal of FIB in stormwater using a bioinfiltration system and found that the results were highly variable and the bioinfiltration system could act at points as a source of FIB (2013). A study of indicator removal in Charlotte, NC also found variable results of effectiveness of Best Management Practices with wetlands and bioretention areas being the most
effective, but also not effective enough to keep concentrations of FIB under
recommendation limits for the majority of sites (Hathaway et al 2009). The lack of
research on the effectiveness of management options such as these may suggest that these types of management options need to be either specified to a location where removal of FIB seems most likely based on the inflow of water for that area, or more research should be conducted before considering such an option. A monitoring program is suggested that takes into account tidal cycle for Sites 1 and 2 and any other outfall pipes, and the salt input from the water treatment plant for Sites 3-6 and nearby areas to account for salinity changes. The monitoring program should also include sites downstream of Site 6 all the way to Town creek to follow the fate and transport of FIB into receiving waters, the relationship between rainfall accumulation over time and FIB should be explored in-depth, and metrics such as water volume, and total suspended solids should be measured to help determine total daily load and impact of particles on concentrations of FIB. Additionally, molecular methods such as Quantitative PCR could help determine source of fecal pollution.
Acknowledgements
Literature Cited
Anderson, K. L., J. E. Whitlock, and V. J. Harwood. "Persistence And Differential Survival Of Fecal Indicator Bacteria In Subtropical Waters And Sediments."
Applied and Environmental Microbiology 71, no. 6 (2005): 3041-048. Baird, Daniel, Robert R. Christian, Charles H. Peterson, and Galen A. Johnson.
"Consequences Of Hypoxia On Estuarine Ecosystem Function: Energy Diversion From Consumers To Microbes." Ecological Applications 14, no. 3 (2004): 805-22 Bay, Steven, Burton H Jones, Kenneth Schiff, and Libe Washburn. "Water Quality
Impacts of Stormwater Discharges to Santa Monica Bay." Marine Environmental Research 56 (2003): 205-23.
"Beaufort, NC." Weather Forecast & Reports. Weather Underground 2014. http://www.wunderground.com/
"Beaufort, NC Community Profile: Data." Beaufort, NC Data & Demographics. July 1, 2014. Accessed December 10, 2014.
http://northcarolina.hometownlocator.com/nc/carteret/beaufort.cfm.
Burlage, Robert S. "Chapter 4: Waterborne Disease." In Principles of Public Health Microbiology. Sudbury, MA: Jones & Bartlett Learning, 2012
Colford, John M., Kenneth C. Schiff, John F. Griffith, Vince Yau, Benjamin F. Arnold, Catherine C. Wright, Joshua S. Gruber, Timothy J. Wade, Susan Burns,
Enterococcus to Assess the Risk Of illness after Exposure to Urban Runoff Contaminated Marine Water." Water Research 46, no. 7 (2012): 2176-186. Converse, R. R., Piehler, M. F., & Noble, R. T. (2011). Contrasts in concentrations and
loads of conventional and alternative indicators of fecal contamination in coastal stormwater. Water Research,45(16), 5229-5240.
Converse, R. R., Blackwood, A. D., Kirs, M., Griffith, J. F., & Noble, R. T. (2009). Rapid QPCR-based assay for fecal Bacteroides spp. as a tool for assessing fecal contamination in recreational waters. Water Research,43(19), 4828-4837. Crabill, C., Donald, R., Snelling, J., Foust, R., & Southam, G. (1999). The impact of
sediment fecal coliform reservoirs on seasonal water quality in Oak Creek, ARIZONA. Water Research,33(9), 2163-2171.
Crowther, John, David Kay, and Mark D Wyer. "Faecal-indicator Concentrations in Waters Draining Lowland Pastoral Catchments in the UK: Relationships with Land Use and Farming Practices." Water Research 36, no. 7 (2002): 1725-734. Curriero, F. C., J. A. Patz, J. B. Rose, and S. Lele. "The Association Between Extreme Precipitation And Waterborne Disease Outbreaks In The United States, 1948-1994." American Journal of Public Health 91, no. 8 (2001): 1194-199.
DiGiacomo, Paul M. Coastal Pollution Hazards in Southern California Observed by SAR Imagery: Stormwater Plumes, Wastewater Plumes, and Natural Hydrocarbon Seeps. 11th ed. Vol. 49. Los Angeles, CA: University of Southern California, 2004. 1013-1024.
Fries, J. S., Characklis, G. W., & Noble, R. T. (2006). Attachment of Fecal Indicator Bacteria to Particles in the Neuse River Estuary, N.C. J. Environ. Eng. Journal of Environmental Engineering,132(10), 1338-1345.
"Google Maps." Google Maps. 2014. Accessed December 10, 2014. http://maps.google.com/.
Hai, Lin, and Cai Hongdao. "Significance of Fecal Coliform and Fecal Streptococcus in Water Pollution Monitoring." Acta Academiae Medicinae Wuhan 2, no. 4 (1982): 251-53.
Hathaway, J. M., Hunt, W. F., & Jadlocki, S. (2009). Indicator Bacteria Removal in Storm-Water Best Management Practices in Charlotte, North Carolina. J. Environ. Eng. Journal of Environmental Engineering,135(12), 1275-1285. Hurley, Margaret A., and M.e. Roscoe. "Automated Statistical Analysis of Microbial
Enumeration by Dilution Series." Journal of Applied Microbiology, 1983, 159-64. Jamieson, Rob C., Robert J. Gordon, Steven C. Tattrie, and Glenn W. Stratton. "Sources
and Persistence of Fecal Coliform Bacteria in a Rural Watershed." Water Quality Research Journal of Canada 38, no. 1 (2003): 33-47
Jeng, H. A., Englande, A. J., Bakeer, R. M., & Bradford, H. B. (2005). Impact of urban stormwater runoff on estuarine environmental quality. Estuarine, Coastal and Shelf Science,63(4), 513-526.
Lauer, K., Noble, R.North Carolina Department of Environment & Natural Resources, Coastal Studies Institute, & University of North Carolina Institute of Marine Sciences, (2016). Stormwater Pilot Project for NCDOT Maintained Ocean Outfalls and Associated Outlets Ocean Outfall Master Plan (Working paper). Moffatt & Nichol.
"Effect Of Human Development On Bacteriological Water Quality In Coastal Watersheds." Ecological Applications 10, no. 4 (2000): 1047-056.
Marion, J. W., J. Lee, S. Lemeshow, and T.J. Buckley. "Association of Gastrointestinal Illness and Recreational Water Exposure at an Inland U.S. Beach." Water Research 44, no. 16 (2010): 4796-804.
Mohanty, S. K., Torkelson, A. A., Dodd, H., Nelson, K. L., & Boehm, A. B. (2013). Engineering Solutions to Improve the Removal of Fecal Indicator Bacteria by Bioinfiltration Systems during Intermittent Flow of Stormwater. Environmental Science & Technology Environ. Sci. Technol.,47(19), 10791-10798.
NC Department of Environment and Natural Resources Marine Fisheries - Shellfish Sanitation. (2016), from http://portal.ncdenr.org/web/mf/shellfish-sanitation Noble, R. T., Griffith, J. F., Blackwood, A. D., Fuhrman, J. A., Gregory, J. B.,
Hernandez, X., . . . Schiff, K. (2006). Multitiered Approach Using Quantitative PCR To Track Sources of Fecal Pollution Affecting Santa Monica Bay,
California. Applied and Environmental Microbiology,72(2), 1604-1612.
Noble, R., Moore, D., Leecaster, M., Mcgee, C., & Weisberg, S. (2003). Comparison of total coliform, fecal coliform, and enterococcus bacterial indicator response for ocean recreational water quality testing. Water Research,37(7), 1637-1643. Parker, J., Mcintyre, D., & Noble, R. Characterizing fecal contamination in
stormwater runoff in coastal North Carolina, USA. Water Research,44(14) (2010): 4186-4194.
Pruss, A. "Review of Epidemiological Studies on Health Effects from Exposure to
Recreational Water." International Journal of Epidemiology 27, no. 1 (1998): 1-9. Rose, Joan B., Paul R. Epstein, Erin K. Lipp, Benjamin H. Sherman, Susan M. Bernard,
and Jonathan A. Patz. "Climate Variability and Change in the United States: Potential Impacts on Waterand Foodborne Diseases Caused by Microbiologic Agents." Environmental Health Perspectives 109 (2001): 211-212.
Sauer, E. P., Vandewalle, J. L., Bootsma, M. J., & Mclellan, S. L. (2011). Detection of the human specific Bacteroides genetic marker provides evidence of widespread sewage contamination of stormwater in the urban environment. Water Research, 45(14), 4081-4091.
Stumpf, C. H., Piehler, M. F., Thompson, S., & Noble, R. T. (2010). Loading of fecal indicator bacteria in North Carolina tidal creek headwaters: Hydrographic patterns and terrestrial runoff relationships. Water Research,44(16), 4704-4715. Wade, Timothy J, Elizabeth Sams, Kristen P Brenner, Richard Haugland, Eunice Chern,
Michael Beach, Larry Wymer, Clifford C Rankin, David Love, Quanlin Li, Rachel Noble, and Alfred P Dufour. "Rapidly Measured Indicators of