Effects of Institutional Quality on Globalization Participation
By Kristen M. Cope
Honors Thesis
Department of Political Science University ofNorth Carolina at Chapel Hill
Abstract
This paper aims to work out the relationship between institutional quality and globalization participation through statistical analysis using data from 1990-2010. By disaggregating foreign direct investment in relation to globalization impact, this paper identifies economic institutional quality as having the strongest relationship to positive globalization participation. Further analysis determines that no single economic
Introduction
Starting in the 1970s, foreign direct investment flows took off globally. By the 1990s, the foreign direct investment growth rate exceeded both world trade and world output growth rates (Bissoon 2011). With such large amounts of investment crossing borders, the study surrounding the topic exploded. With foreign direct investment connecting to everything from policy decisions to economic development, it quickly became an interdisciplinary study.
A focus amongst today’s literature explores how countries can experience the positives of globalization, which results from foreign direct investment. An interesting dichotomy presents itself in the study globalization, seen in the case of two countries within Southeast Asia: Burma and Thailand. Consistently, Burma ranks as one of the world’s least globalized countries while Thailand ranks amongst Southeast Asia’s most globalized countries (KOF 2015). Considering their regional proximity and cultural similarities, it seems surprising that the two can have such different experiences with globalization. Further investigation reveals that in 2011, both countries received similar amounts of foreign direct investment inflows (World Bank). Which leads to the question: If both countries reside in the same region and receive comparable amounts of foreign direct investment, then why do they have such different experiences with globalization?
reveal that in the past several decades Thailand has focused on implementing policies focuses on openness, whereas Burma has been distracted by political instability.
The case of Burma and Thailand shows that in order to fully understand globalization participation, one must examine institutional quality within the context. Although foreign direct investment drives globalization, it alone does not create a clear explanation for the differences in globalization. This study explores how institutional quality, foreign direct investment, and globalization affect a country’s’ global
participation.
Literature Review
A major area of study within the past few decades has involved analyzing foreign direct investment trends and globalization; however, few studies have worked towards bridging the gaps. Through analysis of past literature surrounding the topic, a hole in the research becomes clear. In studies of foreign direct investment’s relation to institutional quality, capital flows are often treated as a homogenous variable. However, studies of globalization have determined that different types of investment have different impacts on how that country participates in globalization. Therefore, to determine how
institutional quality impacts globalization participation, foreign direct investment must be treated as heterogeneous variable. I argue that the quality of each country’s political, economic, and legal institutions affect the likelihood that they will receive the investment necessary to positively participate in globalization.
topics are often studied in relation with one another, however rarely all together. This review provides a background for each of the theoretical topics explored and identifies the gap for new research to fill.
Institutional Quality
Modern study of institutions builds off the work of Coase, North, and Ostrom. The Coase Theorem developed in the 1960s, discussing property right’s relation to economic transactions between two actors, sparked interest in the study of formal structure for human interaction. North (1990) argues that institutions have a key impact on economic performance because they provide the rules and structure for human interaction. North defines institutions as “the humanly devised constraints that shape interaction” and argues that the rules of the game effect how the game is played. Ostrum (1995) furthers North’s work by developing the New Institutional Economics by breaking down institutions into rules, norms, and shared strategies.
The New Institutional Economics theory proposes that economic activity heavily relies on the institutions containing the activity (Ostrum). Although this theory of institutions does create a direct link to the study of foreign direct investment, early work did not operationalize the theory into practical terms.
Although Kuncic works to put together this index, he draws few conclusions from the data, leaving the door open to future studies to apply the information.
Foreign Direct Investment
Foreign direct investment (FDI) collectively refers to the different tactics a company can use to expand influence to a foreign country. Capello and Dentinho (2012) simplify foreign direct investment by breaking it down into two types: horizontal
multinational and vertical multinational investment. Horizontal multinational investment entails a firm aiming to achieve proximity to consumers by setting up a plant in each market they serve; therefore, production and selling happens in each foreign market. In vertical multinational, the firms aim at finding countries suitable for different
departments, generally based on cost and skill level. It commonly comes in the form of a firm having goods produced in a low-skilled, low-cost area and having those goods exported to the host country, which has high skilled, high-costs jobs and the intended consumers.
The study of foreign direct investment can be traced back to the 15th century as trading companies based in Europe made expeditions around the world to facilitate exchange, creating a global economy. According to Smelser and Swedberg (2005), since that time, international investment and trade has been able to grow within the bounds of institutions that provide the structure and norms.
deterring foreign direct investment. Institutions have the ability to make a business friendly environment, as they indicate stability, infrastructure development, trade openness, and legal efficiency.
With the knowledge that quality institutions attract investment, researchers turned their focus to determine how foreign investment affects a country domestically.
Borzentein (1998), Mello (1999), and Bengoa and Robles (2002) each concluded that foreign direct investment can lead to long-term economic growth, however limitations exist due to a country’s internal policies and work force. Bengoa and Robles determined several other benefits that countries receive from foreign investment: improved resource extraction, improved distribution, improved productivity, and improved human capital.
Despite the significant research that points towards foreign direct investment creating positive outcomes for a country, some counter arguments still hold weight. Goldberg and Pavcnick (1997) determine that whether a country reaches its growth potential with foreign investment or just entraps low wageworkers, hinges on the type of investment received. This idea creates a gap in the study of the relationship between institutional quality and investment. Past studies treat investment as a homogenous term, however Goldberg and Pavcnick point out that the type of investment can determine if the county experiences positive growth, indicating it should be treated as a heterogeneous variable.
Globalization
as foreign capital brings in foreign ideas and culture. Current research focuses on how countries end up on the winning or the losing side of globalization.
Building off Goldberg and Pavcnik’s study determining that different types of investment lead to different results, Dreher (2006) built an index of globalization breaking it down into three sections, political, economic, and social. He proposed that globalization comes in different shapes and forms depending on investment and internal policies. Economic globalization is frequently linked to creating growth for a country in terms of GDP and industrial output, however it frequently overlooks the creation of social issues such as inequality and poverty. Having a country solely experience economic globalization does not necessarily imply positive participation; many citizens may be trapped in low wage, low skill jobs that only really benefit the developed world.
Social globalization occurs when ideas diffuse amongst the citizens, as the country also participates in economic globalization (Dreher 2006). This spread of ideas is not possible at levels of great inequality, so social globalization in combination with
economic globalization allows for a country to positively participate. The countries that are able to achieve a combination of economic and social are able to increase their growth rates while maintaining social standards that allow for citizens to learn of new ideas and share information with other places in the world.
Multiple studies point towards the possible benefits of participating in
multinational enterprises (MNEs) currently hold the bargaining power in today’s global economy. Therefore, each country must identify desirable investment types and make itself an attractive candidate in order to participate in the positives of globalization. Thesis Contribution
I argue that the quality of each country’s political, economic, and legal institutions affect the likelihood that they will receive the investment necessary to positively
participate in globalization. In order to determine the validity of my hypothesis, my analysis will focus on filling the gaps presented in the current literature. Foreign direct investment is frequently treated as a homogenous variable, however the study of globalization shows its heterogeneous effects. Therefore, I will focus on horizontal multinational investment, associated with social globalization, in order to determine the impact of institutional quality on globalization participation.
Theoretical Argument
This analysis will focus on determining if countries with higher quality institutions receive more horizontal investment linked to positive participation in globalization. Social globalization, the spread of ideas and culture, links to positive participation as it implies economic globalization while maintaining social standards. Critics of
Many studies have connected foreign direct investment to globalization, but few have acknowledged globalization has different dimensions. In order to determine how a country can positively participate, foreign direct investment must be broken down and not treated like a homogenous variable. In reality, foreign direct investment comes in many different forms.
Considering past studies have examined how foreign direct investment contributes to economic globalization, it is more important to determine the types of foreign direct investment that can contribute to social globalization. A distinguishing factor for this analysis when looking at the forms of foreign direct investment is what market the products or services rendered are intended for. Horizontal multinational investment allows for social globalization because it introduces foreign products and services into a country, introducing consumers to new ideas.
Horizontal investments require market research, distribution set up, and local expertise, all of which takes time and money. Since this investment is risky, investors thoroughly study each country before any decision. The quality of each country’s institutions will come into question as potential investors evaluate the risk of an investment.
This thesis aims at determining the connection between institutional quality and globalization participation. Institutional quality impacts the amount and type of foreign investment received. That investment, in part, determines whether that country will positively or negatively participate. By determining that horizontal investment allows for positive participation, I can examine if institutional quality impacts the countries’ ability to receive that type of investment, and in turn positively participate in globalization. I argue that the quality of each country’s political, economic, and legal institutions
affect the likelihood that they will receive the investment necessary to positively
participate in globalization.
Hypothesis: Countries with higher quality institutions will receive more horizontal
investment linked to positive participation in globalization.
Data Analysis
The data analysis will involve the testing of continuous variables against one binary variable with multiple logistic regression analyses. The institutional quality, the independent variable, for each country will be measured as a continuous variable. I will use institutional quality ratings from Kuncic’s (2013) study that operationalized the New Institutional Economics theory while combining past institutional quality studies to calculate ratings for 94 different countries from 1990-2010. Kuncic breaks down his analysis into political, legal, and economic institutions to give each a relative and
quantifies the overall quality of each country’s institutions. Also, the variables used in this analysis, such as property rights, regulatory quality, and control of corruption, have been cited in other sources as being contributors to creating a friendly business
environment. Each country each year will have an institutional quality rating for political, economic, and legal sectors, which will serve as the independent variables.
From Kuncic’s study, I will use the relative rankings rather than the absolute rankings because investors view market opportunities relative to one another. These rankings more closely simulate how investors would evaluate two different countries against each other. Kuncic provides these relative rankings by category, by country, and by year.
Foreign direct investment contributing to social globalization will be the dependent variable measured in a binary format. Dreher (2006) uses the number of McDonald’s restaurants per capita as a measure of social globalization. The same measure will be used here. McDonald’s restaurants serve as a good proxy for measuring the impact because social globalization is connected to cultural awareness and
McDonald’s can be considered a cultural phenomenon. The variable, coded in a binary fashion, shows whether or not a country has a McDonald’s, rather than having a per capita measurement. Having a restaurant signals horizontal investment, but also social globalization, therefore making it a good proxy for this study.
It would be difficult to control for each of these variables in each country. Making it a binary variable controls for those extraneous variables while still signaling a level of social globalization.
In addition, the analysis involved several control variables. I controlled for development by using GDP per capita. Without this control, the development of each country can sway the results of the analysis. Additionally, I controlled for population to ensure that the size of a country did not skew the analysis. Without this control, simply having the largest market could attract investors.
I used data from 1990 to 2010 to measure the data by country and by year. The institutional quality of a country in a year represents one unit for the independent variable. For example, the institutional quality of China in 2000 represents one unit. A unit for the dependent variable will depend on whether or not they have a McDonalds. For example, if China has a McDonalds in 2000, it will be coded as 1; if not, it will be coded as 0. In order to test the relationship between the two variables, I will run a logistic regression analysis.
Due to gaps in the data collected, the years 1993, 1995, and 2007 will be used for the analysis. Unfortunately, McDonald’s does not break out the number of restaurants it has in each country every year. Frequently their annual reports lump regions together, however, considering the wide differences in institutional quality by region, that data provides no value. Rather, I will focus on the years I gathered data for in order to test my hypothesis.
me to see the relationship between a binary variable, which I used for McDonald’s restaurants, and a continuous variable. Each time I ran the regression, I used a different continuous variable that served as an indication of institutional quality. I used 14 different indicators of institutions quality and ran each twice- once without controls and once with controls.
The initial run of each variable used the following equation in which Y1 represents the binary variable of McDonalds and x is an institutional indicator:
Model 1: Y1= b0 + b1x
I ran this equation for each of the institutional indicators. In order to control for GDP per Capita and Population, I additionally ran the following equation for each indicator:
Model 2: Y1= b0 + b1x + b2(GDP) + b3(Pop)
This equation takes into account the control variables while still testing institutional quality indicators against the dependent binary variable.
In order to more accurately compare institutional indicators, I ran another test of the data using legal, political, and economic institutional indicators as the independent variables. I ran this test once without controls and once with controls.
Model 3: Y1= b0 + b1x1 + b2x2+ b3x3
its similarity to my horizontal investment proxy, McDonald’s restaurants, I ran a logistical regression between the two variables.
Results
Initially, I ran a logistic regression for each of the institutional quality measures individually against the binary variable for McDonald’s restaurants (proxy for horizontal investment leading to social globalization), and then I ran each with the controls of GDP per capita and population. The economic institution quality variable showed the
strongest correlation, supporting my hypothesis.
has an odds ratio of 2.456, showing that all three aggregate measures have a strong relationship to the probability of having a McDonald’s restaurant.
In order to determine if a specific factor within the economic institutional indicator strongly correlates to social globalization, I disaggregated the economic
variable into eight variables. Kuncic initially used these variables, among others, to create the aggregate rating for each country. The eight variables were collected from the
Heritage Foundation’s Economic Freedom Index and are:
Fiscal Freedom Government Spending
Business Freedom Labor Freedom
Monetary Freedom Trade Freedom
Investment Freedom Fiscal Freedom
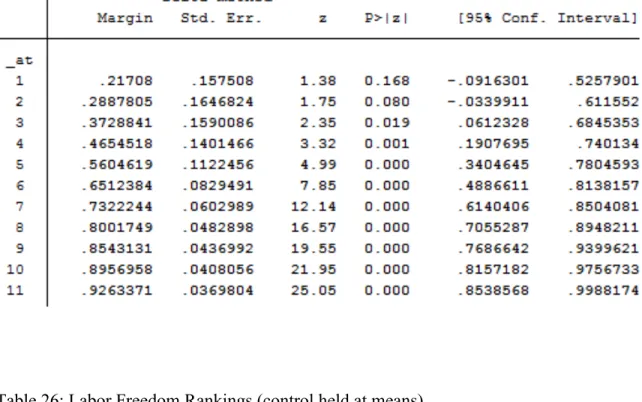
Looking at each variable’s odds ratio individually in relation to the McDonald’s variable, no single variable stands out as having a very strong relationship. Each has a positive relationship, however no single variable stands out in comparison to the aggregate measure. Business Freedom and Monetary Freedom have the strongest relationships in comparison to the other variables, however not by a significant amount (Table 21). A high level of business freedom indicates the ease of starting and operating a business within a country. Considering we are using McDonald’s as a proxy, it makes sense that business freedom has a strong relationship. McDonald’s, as a rational actor, would choose opportunities that allow for easy opening and operation. A high level of monetary freedom indicates price stability within a country. Price stability allows for McDonald’s to compete in a free market fashion. Price controls and frequent
microeconomic intervention could prevent their ability to profit.
these variables does not hold much weight considering the complexity involved in investing in a foreign country. A country must have several of these variables going in its favor in order for a multinational to consider them as a target for investment.
The data analysis supports my hypothesis. Economic institutions do play the largest role in determining if a country will receive the type of investment that allows for
positive participate in globalization, however, political and legal institutional factors also have an impact. The variables making the economic institutional rating individually do not have a strong relationship with the horizontal investment proxy, however together they do. This shows the complexity of creating a quality institution and the multitude of factors that multinationals consider when investing.
Conclusion
This study indicates that economic institutional quality serves as an important factor in determining globalization participation. Although economic institutional quality had the strongest relationship, both political and legal institutional had a relatively strong relationship, as well. This indicates that a country needs a balance amongst the three institutions in order to attract the type of investment linked to positive, or social,
globalization, with a particular focus on economic policies. Closer analysis of economic institutional quality showed that no single indicator had a strong relationship with positive participation, indicating that a country needs a holistic approach and that no quick policy fix exists.
Using McDonald’s as a proxy for the investment that leads to social globalization admittedly has its shortcomings; however, social globalization lacks many concrete measures and foreign direct investment can be disaggregated many different ways.
Table 1: Variable Descriptions
Variable Source Description
Legal Relative Kuncic An aggregate measure of legal institutional quality relative to other countries.
Political Relative Kuncic An aggregate measure of political institutional quality relative to other countries.
Economic Relative Kuncic An aggregate measure of economic institutional quality relative to other countries.
Polity Polity IV Project
The Polity scheme consists of six component measures that record key qualities of executive recruitment, constraints on executive authority and political competition. It also records
changes in the institutionalized qualities of governing authority.
Social
Globalization KOF
A score derived from data on personal contact, data on information flows, and data on cultural proximity for each
country.
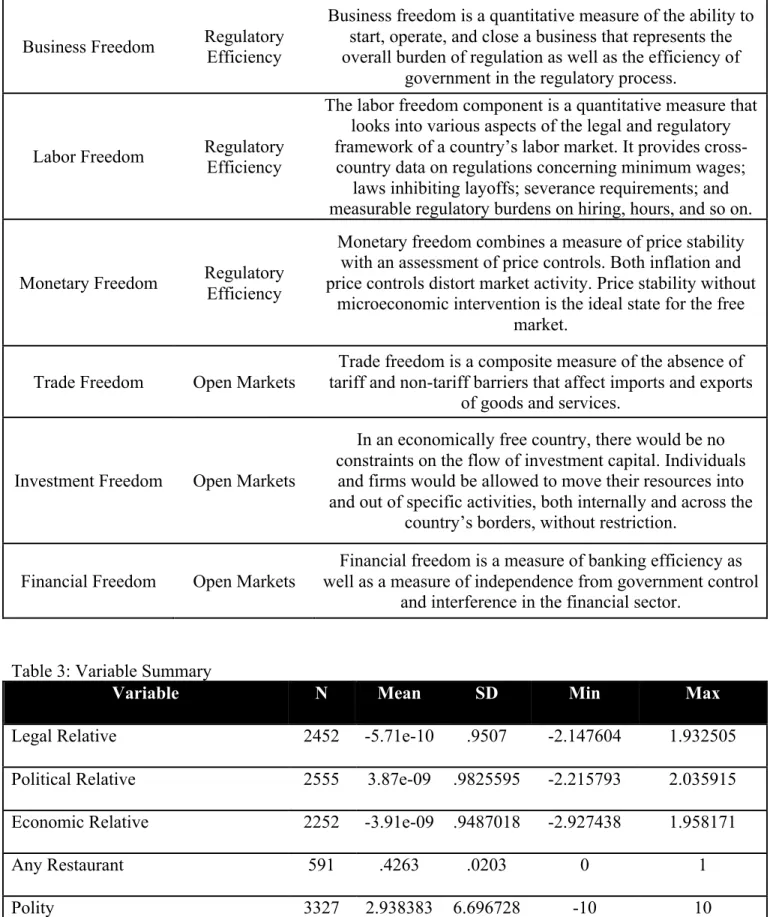
Table 2: Heritage House’s Economic Freedom Ranking Factors
Variable Category Description
Property Rights Rule of Law
Property rights measures the degree to which a country’s laws protect private property rights and the degree to which
its government enforces those laws.
Freedom from
Corruption Rule of Law
Corruption erodes economic freedom by introducing insecurity and uncertainty into economic relationships. The
score for this component is derived primarily from Transparency International’s Corruption Perceptions Index
Fiscal Freedom Government Limited
Fiscal freedom is a measure of the tax burden imposed by government. It includes both the direct tax burden in terms of the top tax rates on individual and corporate incomes and
the overall amount of tax revenue as a percentage of GDP.
Government Spending
Limited Government
This component considers the level of government expenditures as a percentage of GDP. Government expenditures, including consumption and transfers, account
Business Freedom Regulatory Efficiency
Business freedom is a quantitative measure of the ability to start, operate, and close a business that represents the overall burden of regulation as well as the efficiency of
government in the regulatory process.
Labor Freedom Regulatory Efficiency
The labor freedom component is a quantitative measure that looks into various aspects of the legal and regulatory framework of a country’s labor market. It provides
cross-country data on regulations concerning minimum wages; laws inhibiting layoffs; severance requirements; and measurable regulatory burdens on hiring, hours, and so on.
Monetary Freedom Regulatory Efficiency
Monetary freedom combines a measure of price stability with an assessment of price controls. Both inflation and price controls distort market activity. Price stability without
microeconomic intervention is the ideal state for the free market.
Trade Freedom Open Markets
Trade freedom is a composite measure of the absence of tariff and non-tariff barriers that affect imports and exports
of goods and services.
Investment Freedom Open Markets
In an economically free country, there would be no constraints on the flow of investment capital. Individuals
and firms would be allowed to move their resources into and out of specific activities, both internally and across the
country’s borders, without restriction.
Financial Freedom Open Markets
Financial freedom is a measure of banking efficiency as well as a measure of independence from government control
and interference in the financial sector.
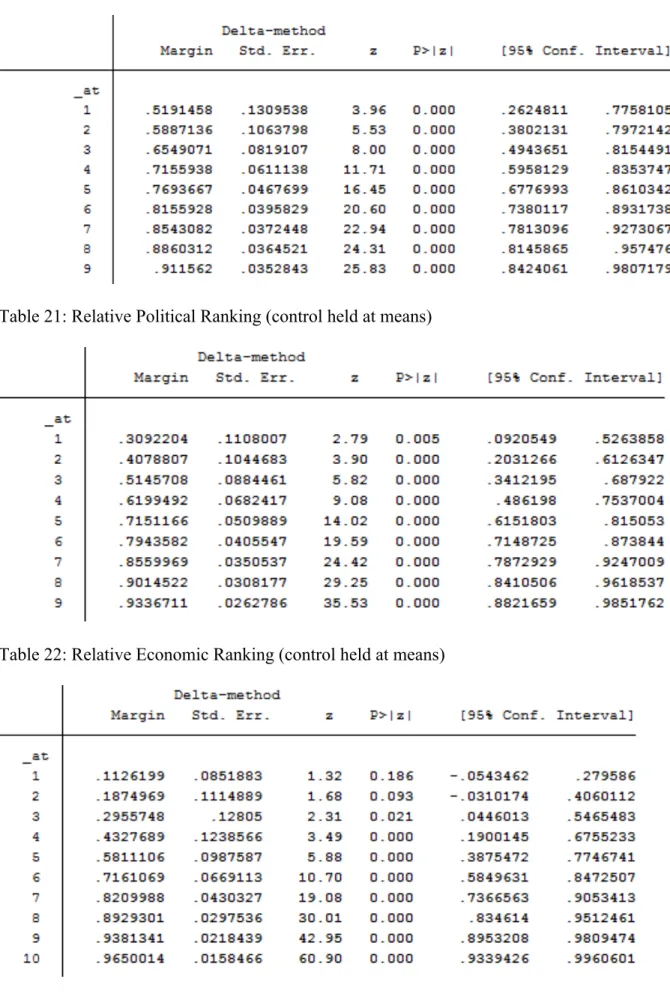
Table 3: Variable Summary
Variable N Mean SD Min Max
Legal Relative 2452 -5.71e-10 .9507 -2.147604 1.932505
Political Relative 2555 3.87e-09 .9825595 -2.215793 2.035915
Economic Relative 2252 -3.91e-09 .9487018 -2.927438 1.958171
Any Restaurant 591 .4263 .0203 0 1
Property Rights 2156 50.40 24.68 5 95
Freedom From Corruption 2156 41.45 24.71 4 10
Fiscal Freedom 2156 69.37 16.70 0 99.9
Government Spending 2156 62.75 24.91 0 99.3
Business Freedom 2156 64.245 16.f1055 0 100
Labor Freedom 860 61.28 17.12 0 100
Monetary Freedom 2156 71.437 18.7257 0 95.4
Trade Freedom 2156 65.165 17.45 0 95
Investment Freedom 2156 52.05 19.8667 0 95
Financial Freedom 2156 50.18 20.9233 0 90
Social Globalization 3402 45.18 22.33 3.436 93.15778
Logistic Regression Results Table 5
Variable Model 1 Model 2 (includes controls)
Legal Relative 1.251 (8.25)*** .564 (2.79)***
Population --- 3.40 e-09 (2.05)* GDP Per Capita --- .0001 (4.81)***
Constant .545 (4.35)*** -.543 (-2.66)***
# of Observations 373 351
Log Likelihood -204.697 -169.112
Prob > Chi Squared 0.000 0.000
Table 6
Variable Model 1 Model 2 (includes controls)
Political Relative 1.3699 (8.68)*** .862 (4.28)***
GDP Per Capita --- .0001(4.52)***
Constant .411(3.28)*** -.510(-2.63)***
# of Observations 372 355
Log Likelihood -199.03 -167.055
Prob > Chi Squared 0.000 0.000
Table 7
Variable Model 1 Model 2 (includes controls)
Economic Relative 1.6518 (8.48)*** 1.195 (4.61)***
Population --- 4.30e-09(2.05)*
GDP Per Capita --- .0001(3.03)***
Constant .879(5.79)*** -.510(-2.63)***
# of Observations 326 306
Log Likelihood -155.44 -133.13
Prob > Chi Squared 0.000 0.000
Table 8
Variable Model 1 Model 2 (includes controls)
Polity .1257 (7.73)*** .0977 (4.80)***
Population --- 4.53e-09(2.31)*
GDP Per Capita --- .0002(6.93)***
Constant -.523(-4.47)*** -1.604(-9.13)***
# of Observations 479 461
Log Likelihood -296.539 -208.215
Prob > Chi Squared 0.000 0.000
Table 9
Variable Model 1 Model 2 (includes controls)
Property Rights .05005 (7.36)*** .0207977 (2.28)*
GDP Per Capita --- .0001(4.45)***
Constant -2.256(-6.54)*** -2.084(-5.11)***
# of Observations 278 266
Log Likelihood -153.91 -121.40092
Prob > Chi Squared 0.000 0.000
Table 10
Variable Model 1 Model 2 (includes controls)
Freedom From Corruption
.0624 (7.33)*** .0259 (2.15)*
Population --- 1.14e-08(2.66)*** GDP Per Capita --- .0001(3.87)***
Constant -2.204(-6.75)*** -2.027(-5.01)***
# of Observations 278 266
Log Likelihood -146.33 -121.713
Prob > Chi Squared 0.000 0.000
Table 11
Variable Model 1 Model 2 (includes controls)
Fiscal Freedom .00709 (.321) .023 (2.04)*
Population --- 9.79e-09(2.29)*
GDP Per Capita --- .0002(6.10)***
Constant -.318(-0.63) -2.967(-3.49)***
# of Observations 278 266
Log Likelihood -191.161 -121.791
Prob > Chi Squared 0.319 0.000
Table 12
Variable Model 1 Model 2 (includes controls)
Government Spending -.0277 (-4.73)*** -.0129 (-1.73)*
GDP Per Capita --- .0001(5.39)***
Constant 1.99(4.81)*** -.434(.560)
# of Observations 278 266
Log Likelihood -178.644 -122.605
Prob > Chi Squared 0.000 0.000
Table 13
Variable Model 1 Model 2 (includes controls)
Business Freedom .0761 (7.04)*** .038145 (2.87)***
Population --- 1.10e-08(2.58)**
GDP Per Capita --- .0001(4.73)***
Constant -4.626(-6.72)*** -3.512(-4.33)***
# of Observations 278 266
Log Likelihood -155.816 -119.547
Prob > Chi Squared 0.000 0.000
Table 14
Variable Model 1 Model 2 (includes controls)
Labor Freedom .02305 (2.17)* -.0003 (-.24)
Population --- 9.66e-09(1.71)*
GDP Per Capita --- .0001(4.23)***
Constant -1.190(-1.80)* -1.282(-1.51)
# of Observations 138 132
Log Likelihood -92.435 -59.036
Prob > Chi Squared 0.0251 0.000
Table 15
Variable Model 1 Model 2 (includes controls)
Monetary Freedom .04235 (4.08)*** .00148 (.16)
GDP Per Capita --- .0002(5.60)***
Constant -2.896(-3.73)*** -1.433(-2.29)*
# of Observations 278 266
Log Likelihood -179.314 -124.070
Prob > Chi Squared 0.000 0.000
Table 16
Variable Model 1 Model 2 (includes controls)
Trade Freedom .07411 (6.90)*** .0545 (3.89)*** Population --- 1.28e-08(2.60)*** GDP Per Capita --- .0001(4.33)***
Constant -4.755(-6.45)*** -4.702(-5.04)***
# of Observations 278 266
Log Likelihood -156.345 -114.313
Prob > Chi Squared 0.000 0.000
Table 17
Variable Model 1 Model 2 (includes controls)
Investment Freedom .04515 (6.05)*** .0218 (2.37)**
Population --- 1.07e-08(2.51)**
GDP Per Capita --- .0001(5.20)***
Constant -2.11(-5.33)*** -2.308(5.20)***
# of Observations 278 266
Log Likelihood -169.651 -121.168
Prob > Chi Squared 0.000 0.000
Table 18
Variable Model 1 Model 2 (includes controls)
GDP Per Capita --- .0001(5.03)***
Constant -2.18(-5.61)*** -2.475(-5.06)***
# of Observations 278 266
Log Likelihood -165.529 -119.994
Prob > Chi Squared 0.000 0.000
Table 19
Variable Model 1 Model 2 (includes controls)
Social Globalization .01059 (2.58)*** .009066 (1.81)* Population --- 1.56e-08(4.19)*** GDP Per Capita --- .0001(7.84)***
Constant -.715(-3.43)*** -1.910(-6.70)***
# of Observations 489 486
Log Likelihood -332.249 -240.747
Prob > Chi Squared 0.0094 0.000
Table 20
Variable Model 3 Model 4 (includes
controls) Model 2 Odds Ratio
Legal Relative -.686 (-1.66) -1.0727 (-2.41)* .3420 Political Relative .836 (2.17)* .890 (2.13)* 2.456 Economic Relative 1.555 (4.34)*** 1.373 (4.25)* 3.948 Population --- 4.46e-09(2.12)* --- GDP Per Capita --- .0001(2.74)** --- Constant .775 (4.76)*** -.0602 (-0.24) ---
# of Observations 307 293
---Log Likelihood -145.648 -126.62
---Prob > Chi Squared 0.0000 0.000
Variable Odds Ratio
Legal Relative 1.757
Political Relative 2.368
Economic Relative 3.306
Polity 1.026
Property Rights 1.021
Freedom From Corruption 1.026
Fiscal Freedom 1.023
Government Spending .987
Business Freedom 1.038
Labor Freedom .996
Monetary Freedom 1.043
Trade Freedom 1.001
Investment Freedom 1.022
Financial Freedom 1.026
Social Globalization 1.009
Format: Coefficient (t-statistic)
***Significant at .005 level; **Significant at .01 level; *Significant at .05 level
Table 21: Relative Political Ranking (control held at means)
Table 23: Fiscal Freedom Ranking (control held at means)
Table 24: Government Spending Rankings (control held at means)
Table 26: Labor Freedom Rankings (control held at means)
Table 28: Trade Freedom Rankings (control held at means)
Works Citied
"2015 Economic Freedom Heat Map." 2015 World Economic Freedom Levels: Heat Map for Continents and Countries. Heritage Foundation, n.d. Web. 17 Feb. 2015. Aliouche, E., and Udo Schlentrich. "Towards a Strategic Model of Global Franchise
Expansion." Journal of Retailing 87.3 (2011): 345-65. Web.
Bhagwati, Jagdish N. In Defense of Globalization: With a New Afterword. New York: Oxford UP, 2007. Print.
Bissoon, Ourvashi. "Can Better Institutions Attract More Foreign Direct Investment (FDI)? Evidence from Developing Countries." International Conference on Applied Economics (2011): n. pag. Web.
Broberg, J. Christian, Alexander McKelvie, Jeremy Short, David Ketchen, Jr., and William Pan. "Political Institutional Structure Influences on Innovative Activity." Journal of Business Research 66.12 (2013): 2574-580. Web.
Busse, Matthias, and Carsten Hefeker. "Political Risk, Institutions and Foreign Direct Investment." Hamburg Institute of International Economics. Hamburg Institute of International Economics (HWWA), Apr. 2005. Web.
Capello, Roberta, and Tomaz Ponce Dentinho. Globalization Trends and Regional Development: Dynamics of FDI and Human Capital Flows. N.p.: n.p., n.d. Print. Demirhan, Erdal, and Mahmut Masca. "Determinants of Foreign Direct Investment Flow
to Developing Countries: A Cross-Sectional Analysis." Prague Economic Papers 4 (2008): n. pag. Web.
Feachem1, Richard. "Bulletin of the World Health Organization - Globalization: From Rhetoric to Evidence." Sci Flo Public Health. Bulletin of the World Health Organization, Jan. 2001. Web. 01 Dec. 2014.
Fladmore-Lindquist, Karin. "International Franchising: Capabilities and Development." Journal of Business Venturing 11.5 (1996): 419-38. Web.
"Foreign Direct Investment, Net Inflows (BoP, Current US$)." Foreign Direct Investment, Net Inflows (BoP, Current US$). World Bank, n.d. Web. 17 Feb. 2015.
Goldberg, Pinelopi, and Nina Pavcnik. "Distributional Effects of Globalization in Developing Countries." NBER. NATIONAL BUREAU OF ECONOMIC RESEARCH, Feb. 2007. Web. 01 Dec. 2014.
Henderson, Dennis, Charles Handy, and Steven Neff. “Globalization of the Processed Food Market.” Agriculture Economic Report (1997): n. pag. Web
Jensen, Nathan. "Political Risk, Democratic Institutions, and Foreign Direct Investment." International Organization 57.3 (2003): 587-616. Web.
Kim, Haksoon. "Political Stability and Foreign Direct Investment." International Journal of Economics and Finance 2.3 (2010): n. pag. Web.
"KOF Index of Globalization." ETH Zurich. Swiss Federal Institute of Technology, 2010. Web. 02 Mar. 2015.
Lim, Ewe-Ghee. "Determinants Of, and the Relation Between, Foreign Direct Investment and Growth: A Summary of the Recent Literature." International Monetary Fund (2001): n. pag. Web.
Marshall, Monty. "Polity IV Project: Country Reports 2010." Polity IV Project: Country Reports 2010. Systemic Peace, n.d. Web. 17 Feb. 2015.
McIntyre, Faye S., and Sandra M. Huszagh. "Internationalization of Franchise Systems." Journal of International Marketing 3.4 (1995): 39-56. Web.
Mello, Luiz. "Foreign Direct Investment Led Growth: Evidence from Time Series and Panel Data." Oxford Economic Papers 51, 1999. Web.
Narula, Rajneesh, and John H. Dunning. "Industrial Development, Globalization and Multinational Enterprises: New Realities for Developing Countries." Oxford Development Studies 28.2 (2000): 141-67. Web.
North, Douglass. "Institutions, Institutional Change and Economic Performance." Google Books. Cambridge University Press, 1990. Web. 24 Feb. 2014.
Pelle, Stefano. "Understanding Emerging Markets: Building Business BRIC by Brick : SAGE Knowledge." Understanding Emerging Markets: Building Business BRIC by Brick : SAGE Knowledge. SAGE Publications India Pvt Ltd, 31 May 2012. Web. 03 Mar. 2014.
Quan Li and Adam Resnick (2003). Reversal of Fortunes: Democratic Institutions and Foreign Direct Investment Inflows to Developing Countries. International Organization, 57, pp 175-211.
Sinclair, Robert. "Impact of Foreign Direct Investment on the Development of an Emerging Economy: The Case of China." School of Doctorial Studies (EU) Journal (2010): n. pag. Web.
"The Handbook of Economic Sociology, Second Edition." Google Books. Ed. Neil Smelser and Richard Swedberg. Princeton University Press, 2005. Web. 01 Mar. 2015.
Tomohara, Akinori, and Sadayuki Takii. "Does Globalization Benefit Developing Countries? Effects of FDI on Local Wages." Journal of Policy Modeling 33.3 (2011): 511-21. Web.
Wernick, David, Jerry Hear, and Shane Singh. "Do Governing Institutions Affect Foreign Direct Investment Inflows? New Evidence from Emerging Economies."