1.) Contents ... ii
2.) List of Figures ... iv
3.) List of Tables ... vii
4.) Acknowledgments ... viii
5. ) ABSTRACT...--- 1
6.) INTRODUCTION ... 2
7.) LITERATURE REVIEW ... 5
a. Laboratory Hood Description ... 5
b. Standards and Performance Guidelines ... 7
c. Face Velocity Criteria ... 9
d. Hood Performance Tests ... 10
e. Factors Affecting Hood Performance ... 12
f. Baffle and Slot Design ... 14
8 . ) METHODOLOGY... .___ 17
a. Hood Use Questionnaire ... 17
b. Laboratory Hood Description ... 18
c. Experimental Apparatus ... 22
d. Measurement of Exhaust Flow... 25
e. Face Velocity Measurements ... 26
f. Determination of Air Flow Patterns ... 26
g. Measurement of Hood Performance ... 28
h. Tests of Slot Blockage ... 29
9. ) RESULTS ... 30
a. Hood Use Questionnaire ... 30
b. Flow Measurement ... 31
c. Face Velocities ... 32
d. Quantitative Leak Tests... 45
e. Statistical Tests ... 54
d. Blockage and Shelf Tests ... 54
10.) DISCUSSION OF RESULTS...___. . 56
a. Hood Use Questionnaire ... 57
b. Flow Measurement ... 58
c. Face Velocity Measurement ... 59
d. Auxiliary Flow... 63
e. Quantitative Leak Tests ... 65
Ill
11.) Recommendations ... 70
a. Proper Hood Use ... 7 0
b. Further Research... 72
12.) References ... 75
13.) Appendix I. Hood use Questionnaire... 79
and Results.
14.) Appendix II. Calibration Data and Curves
for Alnor Thermoanemometer .. 83
15.) Appendix III. Calibration Data and Curves
for ITI Leakmeter... 90
16.) Appendix IV. Calibration Data and Curves
for Rotameters ... 97
17.) Appendix V. Face Velocity Data for
Hood at 1100 cfm ... 103
18.) Appendix VI. Face Velocity Data for
Hood at 850 cfm... 107
19.) Appendix VII. Face Velocity Data for
Hood at 750 cfm ... Ill
20.) Appendix VIII. Leakage Concentration Data
Hood at 1100 cfm ... 115
21.) Appendix IX. Leakage Concentration Data
Hood at 850 cfm... 119
22.) Appendix X. Leakage Concentration Data
Hood at 750 cfm... 123
23.) Appendix XI. Leakage Concentration and
Velocity Data for Blockage
Tests ... 127
24.) Appendix XII. Statistical Results and
Tables ... 132
Figure 1. Figure 2. Figure 3. Figure 4. Figure 5. Figure 6. Figure 7. Figure 8. Figure 9. Figure 10. Figure 11. Figure 12. Figure 13. Figure 14. Figure 15. Figure 16.
Figure 17.
Three Dimensional Laboratory Hood... 6
Diagram
Laboratory Hood Dimensions ... 19
Baffle and Slot Configuration ... 20
Location of Laboratory Hood in Room 0315 ... 21
The Mobile Quantitative Hood Testing System. 22
Sulfur Hexafluoride Diffusion Manifold ... 23
Face Velocity Traverse Grid ... 27
Face Velocity Profile for Baffle Position
#1 at 1100 cfm in Room D315... 36
Face Velocity Profile for Baffle Position
#2 at 1100 cfm in Room D315... 37
Face Velocity Profile for Baffle Position
#3 at 1100 cfm in Room D315... 38
Face Velocity Profile for Baffle Position
#1 at 850 cfm in Room C158... 39
Face Velocity Profile for Baffle Position
#2 at 850 cfm in Room C158 ... 40
Face Velocity Profile for Baffle Position
#3 at 850 cfm in Room C158... 41
Face Velocity Profile for Baffle Position
#1 at 750 cfm in Room C148... 42
Face Velocity Profile for Baffle Position
#2 at 750 cfm in Room C148... 43
Face Velocity Profile for Baffle Position
#3 at 750 cfm in Room C148... 44
Average Peak Concentrations Versus Baffle
Position for Hood at 2" Generationͣ fiy^- i-^:--'^^-Figure 18. Figure 19. Figure 20. Figure 21. Figure 22. Figure 23. Figure 24. Figure 25. Figure 26. Figure 27. Figure 28. Figure 29. Figure 30. Figure 31. Figure 32. Figure 33.
Average Peak Concentrations Versus Baffle
Position for Hood at 8" Generation
Height and 1100 cfm ... 49
Average Peak Concentrations Versus Baffle
Position for Hood at 2" Generation
Height and 850 cfm... 50
Average Peak Concentrations Versus Baffle
Position for Hood at 8" Generation
Height and 850 cfm ... 51
Average Peak Concentrations Versus Baffle
Position for Hood at 2" Generation
Height and 750 cfm... 52
Average Peak Concentrations Versus Baffle
Position for Hood at 8" Generation
Height and 850 cfm... 53
Air Flow Patterns Suggested by Manufacturer
versus Actual Observed Smoke Patterns ... 61
Auxiliary Air Flow Patterns for Baffle
Positions #1 and #3 ... 64
Top View of Hood Displaying Flow
Separation Around Mannequin ... 66
Photo A - Auxiliary Supply Flow for
Baffle Position #3 With the Sash Up... 141
Photo B - Auxiliary Supply Flow for
Baffle Position #3 With the Sash Down ... 141
Photo C - Auxiliary Supply Flow for
Baffle Position #1 With the Sash Up... 142
Photo D - Auxiliary Supply Flow for
Baffle Position #1 With the Sash Down ... 142 Photo E - Unobstructed Flow for Baffle
Position #1 ... 143
Photo F - Unobstructed Flow After Time for
Baffle Position #1 ... 143
Photo G - Flow for Baffle Position #1 with
Mannequin Present ... 144
Photo H - Flow after time for Baffle
Figure 34. Photo I - Unobstructed Flow for Baffle
Position #3 ... 145
Figure 35. Photo J - Unobstructed Flow After Time for
Baffle Position #3 ... 145
Figure 36. Photo K - Flow for Baffle Position #3 with
Mannequin Present ... 14 6 Figure 37. Photo L - Flow after time for Baffle
LIST OF TABLES
1.) Table I. Results of Face Velocity Traverse... 3 3
ACKNOWLEDGMENTS
This technical report is dedicated to the memory of Dr.
David Eraser. Dr. Eraser was my graduate advisor and I will
sorrowfully miss his guidance and suggestions.
To the members of NIEHS Health and Safety Branch;
Chris Hunt
Valeria Shropshire
Scott Merkle Patricia Deese
Diane Wilson
Thank you for your expert advice, comments and above all patience in answering my endless questions.
Thanks to the faculty and staff of the University of North Carolina School of Public Health and to my committee members Dr. Michael Elynn, Dr. Parker Reist and Dr. John Dement for their guidance, personal interest and positive
criticisms.
A special thanks to Dr. John Dement for the opportunity to work with him. Without his guidance and inspiration my graduate studies would not have been possible.
Thanks to Anne Marie Clark and Dr. Mike Flynn for their help in statistical analysis.
I wish to thank my family for their constant support and especially my father, whose interest, suggestions and engineering skills have made this a better report.
My graduate education and research were sponsored in part by the NIOSH Training Grant #5-38182, 1989 and Grant #5-38322,
ABSTRACT
Thomas C. Smith, "A Performance Evaluation of NIEHS Laboratory Fume Hoods" (under the direction of Dr. Michael Flynn and Dr. John Dement)
The laboratory hoods found at the National Institute of Environmental Health Sciences were quantitatively tested and evaluated in terms of containment performance. The hoods were challenged with a tracer gas. Sulfur Hexafluoride, and peak concentrations leaking from the
hood were measured in the breathing zone of a mannequin.
The tests proved that laboratory hood performance is subject to baffle position, face velocity, tracer gas challenge height and bottom slot obstructions. These
factors had statistically significant effects, P <
0.0001, on overall containment efficiency. The results
helped to identify the parameters which could be
manipulated by the employee, the Health and Safety Branch
Laboratory hoods are the primary means of protection for
laboratory employees working with potentially hazardous
materials. Their use was intended to reduce employee exposure
by capturing and removing hazardous contaminants. Many design
modifications have occurred since the original laboratory fume
hood. However, as better techniques to measure hood
performance are developed, difficulties in the design,
installation, and use become more evident.
Laboratory hoods are complex in design and are subject
to a wide variety of factors which affect performance.
Criteria for testing "as manufactured" hood performance are
well documented and advances are being made for quantitative
"as used" hood performance tests (5,7,8,10,12,19,21). The
importance of "as used" testing cannot be underestimated as
present methods are limited to face velocity measurements and
visual smoke tests which provide only a qualitative
measurement of hood performance and do not measure containment
efficiency (21).
Improved test procedures allow for assessment of many
variables that affect hood performance and containment.
Variables such as room air supply, traffic about the hood,
3
reported in recent literature (3,6,9,10,16,18,20,21,23). The
results of these efforts prove the benefits of an aerodynamic
sill and good work practices such as reducing sash height and
reduction of motion in and about the hood. However,
relatively little research has been attempted to assess the
effects of baffle design and slot position on laboratory hood
performance.
Inappropriate baffle design and slot positioning can
significantly affect the performance of a laboratory hood
(11). There are no standards for baffle and slot design and
varying designs exist among hood manufacturers. Some
manufacturers provide adjustable baffles which allow for
manipulation of the air distribution within the hood. The
adjustments are made in accordance with the type of aerosol
being generated. A top slot is opened for working with
"lighter than air" vapors and conversely a bottom slot is
opened when working with "heavier than air" vapors (2,3,11).
This "heavier than air", "lighter than air" rationale,
however, bears no relevance due to the effective specific
gravity resulting from turbulent mixing in the hood (2,3).
Adjustable baffles can often lead to undesirable air flow
patterns and potentially increased leakage from the hood. The
familiar roll effect or development of a stable vortex above
the sash can increase the potential for leaks from the hood
(10,11). Certain baffle settings are more conducive to
forming this vortex and increase the potential for leaks
(10,11).
The objective of this study was to assess the performance
of typical laboratory hoods at the National Institute of
Environmental Health Sciences (NIEHS). The study was to
include testing of several hoods to determine their
effectiveness of hazard containment at different baffle
settings and under normal use conditions. The experimental
parameters tested were baffle settings, face velocity,
LITERATURE REVIEW
Laboratory hoods are designed to provide employee
protection from exposure to a wide variety of hazardous
materials. It was estimated that nearly 800,000 hoods are
in operation across the nation and according to the Scientific
Apparatus Makers Association (SAMA), this figure may be
conservative (3,22). Laboratory hood performance is subject
to a wide variety of use and external factors. A great deal
of literature has been generated in attempts to provide hood
specifications, develop effective testing methods, evaluate
factors affecting performance and improve aerodynamic
efficiency. However, further work needs to be done as
improved methods of testing indicate hazard containment is
often less than desirable and design features critical to
overall hood performance have not yet been evaluated.
Laboratory Hood Description
The laboratory hood is defined as a ventilated, enclosed
work space intended to capture, contain and exhaust fumes,
moveable sash. Contaminant removal and air flow distribution
is regulated by an exhaust plenum equipped with a baffle and
adjustable slot system (19). Refer to Figure 1. for a typical
auxiliary air laboratory hood.
Z'
XAuxiliary air supply
Top and side
Enclosing
Panels
Sash
Exhaust air
Baffles
Air Foil Sill
Figure 1. Three Dimensional Auxiliary Air Laboratory
Hood Diagram
Special hoods, such as perchloric acid hoods, radioactive
hoods, and walk-in hoods, also exist. A by-pass hood is
intended to exhaust room air through the face when the sash
is open and through a diffusion grill when the sash is closed.
The rationale for the by-pass hood was to ultimately provide
user safety while enabling a somewhat constant amount of air
to be exhausted. It was designed to work in conjunction with
the rest of the ventilation system in order to manage the
laboratories air handling needs. An auxiliary air hood is
characterized by having a supply air duct in addition to an
exhaust duct. The design was intended to reduce energy costs
by reducing the amount of tempered air exhausted by supplying
nontempered air from the outdoors. The auxiliary air enters
a plenum above the hood opening and is diffused over the hood
face. If designed and maintained properly, the auxiliary air
hood can be safer than standard by-pass hoods as a result of
the clean air purging the breathing zone of the hood user
(4,8).
Standards and Performance Guidelines
In an effort to provide uniformity and reliability in
laboratory hoods, standards and recommendations have been
written to establish safety requirements and performance
guidelines. Several organizations including the American
Conference of Governmental Industrial Hygienists (ACGIH), the
Conditioning Engineers (ASHRAE), SAMA, and the EPA have developed standards and criteria for the construction, testing and use of laboratory hoods. All were found to contain similarities pertaining to laboratory hood design, installation and suggested work practices. A brief list of similarities consists of the following:
1. Provide uniform exhaust air distribution in the hood. There should be no more than a 10 - 25%
variation in point-to-point face velocity with the sash fully open and unobstructed.
2. Use corrosion resistant materials suitable for
expected work.
3. Avoid sharp corners at jambs and sill. Tapered or round inlets are desirable; an aerodynamic sill
is desirable.
4. Hood should be located away from heavy traffic aisles
and doorways.
5. Experimental procedures should be performed at least six inches into the hood enclosure.
6. Users should not store chemicals or apparatus in
hood.
7. Users should attempt to lower hood sash as low as possible. , ,
8. Attempts should be made to keep slots free of
obstructions.
9
Hood standardization is difficult as hood performance is
susceptible to ventilation system efficiency and air
requirements unique to each laboratory.
Face Velocity Criteria
Safe hood operation has long been associated with the
magnitude of the average face velocity. This face velocity
was traditionally based on the type of material being used in
the hood (19) . Class A hoods were designated for high
toxicity materials such as tetraethyl lead, beryllium
compounds and radioactive materials. These hoods had
characteristic face velocities on the order of 125 to 150 feet
per minute (0.64 - 0.76 m/s). Class B hoods were designated
for general use purposes and had face velocities typically 80
to 125 feet per minute (0.41 - 0.64 m/s). Class C hoods were
for very low toxicity materials or nuisance dusts and odors.
Face velocities ranged from 50 to 80 feet per minute (0.25
-0.41 m/s). The designation of safe velocities differs among
the standards mentioned, however, most recommend face
velocities within a range of 50 - 150 feet per minute
(1,2,8,19). .,
A great deal of controversy exists over the designation
of an average face velocity as an indicator of hood safety.
Development of accurate quantitative leak tests indicate that
should be based on the unique conditions applying to a specific hood and not necessarily on the material in use (2,3,5,17). External factors relating to this phenomenon will be covered in detail later.
Laboratory Hood Performance Tests
Laboratory hood tests to determine safe operating
conditions and containment efficiency have undergone a great
deal of research and accurate testing methods are continuously
being developed. Traditional tests involve the measurement
of face velocities and observation of smoke patterns within
the hood. These tests, being based on face velocity
guidelines found in the standards, have provided only
qualitative measurements of hood efficiency (21) . The
development of technology to detect and accurately measure
contaminant concentrations have led to more quantitative hood
tests. Quantitative tests however, are fairly complicated and
require extensive calibration and setup (21). The need to
establish safe operating environments have dictated the
development of hood testing methods that can be quantitative
yet simple enough to apply in a routine hood monitoring
program.
11
HOP "Method of Testing Performance of Laboratory Fume Hoods",
developed by Caplan and Knutson utilizes freon, R-12, or
Sulfur Hexafluoride tracer gas and infrared spectrometry for
detection. The gas was diffused into the hood through a
specially designed ejector. The release rate can be
controlled and concentrations of tracer gas are measured
escaping from the hood face with a Miran lA Infrared Gas
Analyzer. The EPA SF^ method developed by Chamberlin and
Leahy was adopted as "Laboratory Fume Hood Specifications and
Alternate Performance Testing Requirements for Pre-Purchase
Testing". This method involves challenging the hood with the
SFg tracer gas through a twelve-point discharge manifold.
Measurements are taken in the exhaust duct and along the face
with an, ITI Lealcmeter II Model 61, electron capture detector.
The modified version of the EPA test, developed by Hampl,
utilizes an electron capture gas chromatograph for detection
with a modification of the tracer gas ejector (21). The
modified ejector uses a tubing jet with discharge holes that
can be expanded to create a multiple point discharge source.
Due to the complexity of the experimental apparatus, the
standard quantitative test methods are difficult to apply in
field testing (21) . As a result they have been applied mainly
as pre-purchase tests performed by laboratory hood
manufacturers (4,8,21).
Compliance of "as manufactured" hoods does not
installation (4,8). Thus, methods which are relatively
unobtrusive and can simulate actual use conditions are being
developed to test "in-use" hoods. These test methods provide
a means to assess employee exposure resulting from various
activities such as pipetting or centrifugation (10). The
results obtained have also enabled the determination of
external factors and hood design elements affecting
performance that may be unique to each hood.
Factors Affecting Hood Performance
Room air supply, traffic about the hood and work
practices such as sash height, contaminant location and
storage of materials in the hood are external factors
demonstrated in recent literature to have a dramatic effect
on laboratory hood containment and performance (6,7,10,13,18) .
15
to flow toward the top slot (11). The upward movement of air
combined with the horizontal flow of air through the face
produces the rolling effect or vortex. Air and thus,
contaminants are forced into this vortex (18).
The rationale for adjustable slots was to provide uniform
air distribution within the hood corresponding to a variety
of use conditions. Adjustments to the slots are made in
accordance with the type of materials or processes in the hood
(11). The top slot is to be opened when using "lighter than
air" gases and the bottom slot is to be opened when using
"heavier than air" gases. The amount of turbulence within the
hood, however, results in a relatively uniform concentration
of air and contaminant (10,13). Even with vapors that have
densities much different than air, resulting changes in
effective specific gravity are found to be negligible (2,11).
Adjustable slots may be important, however, in the case
of unusual processes or extraordinary conditions. Processes
involving extreme thermal effects or lead to a significant
alteration of the local densities may require slot
adjustments. The laboratory hood, however, may not be the
proper control device for these types of activities (11).
Based on the literature reviewed, laboratory hoods are
subject to a wide variety of use and external factors which
affect performance. Development of quantitative hood tests
modifications and the need for good work practices. Further work is required, however, to develop nonintrusive quantitative test methods and evaluate and modify hood design elements, such as baffle design and slot configuration, that are critical to aerodynamic performance and containment
METHODOLOGY
The objective of this study was to test the performance
of typical laboratory hoods found at the National Institute of Environmental Health Sciences. The following factors were evaluated for possible effects on hood performance:
1.) Baffle Settings;
2.) Contaminant Challenge Position;
3.) Exhaust Flow, Face Velocity; 4.) Bottom Slot Obstructions.
The project was designed to provide a method for reducing possible exposure by evaluating the elements affecting performance that are within the control of the worker. Health and Safety Branch and facility engineers. The project consisted of a survey of hood users, development of a system that could be used as part of a routine hood monitoring program, and evaluation of the factors of hood design and typical use conditions which influence hood performance.
Hood Use Questionnaire
A survey was performed to assess employee work practices
and general knowledge of hood functions. The survey was
administered to 50 laboratory hood users selected at random
regarding the length of time spent using the hood, type of materials and processes used in the hood, knowledge of hood accessories and functions, and complaints. Refer to Appendix I. for a copy of the guestionnaire.
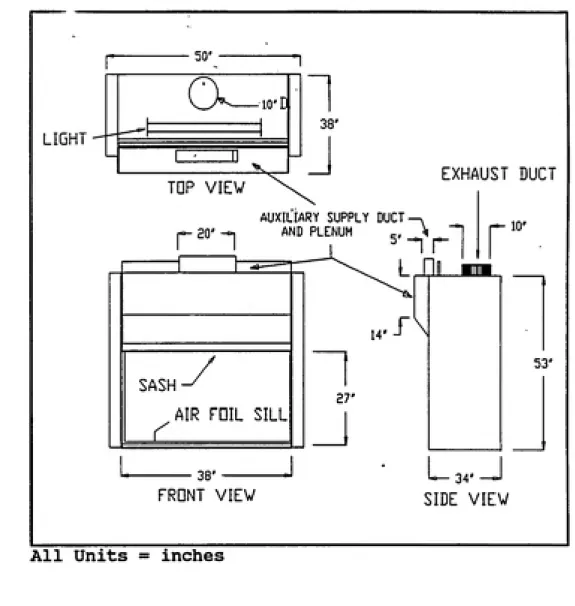
Laboratory Hood Description
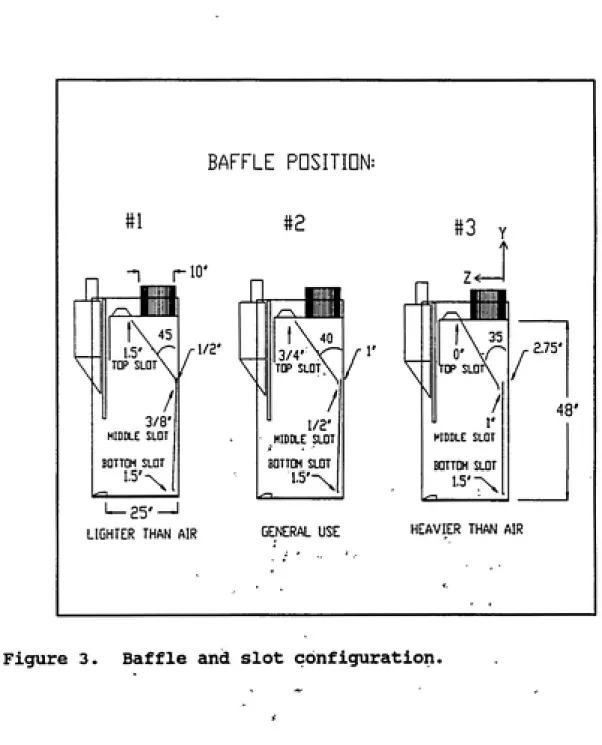
Three Hamilton Industries Auxiliary Supply, Vectaire Fume Hoods were tested. All three hoods were 4 ft. in width and had the dimensions shown in Figure 2. The Vectaire hood
includes a three way adjustable baffle (Figure 3.), vertical sash, air foil sill and is eguipped with a flow monitoring
alarm system.
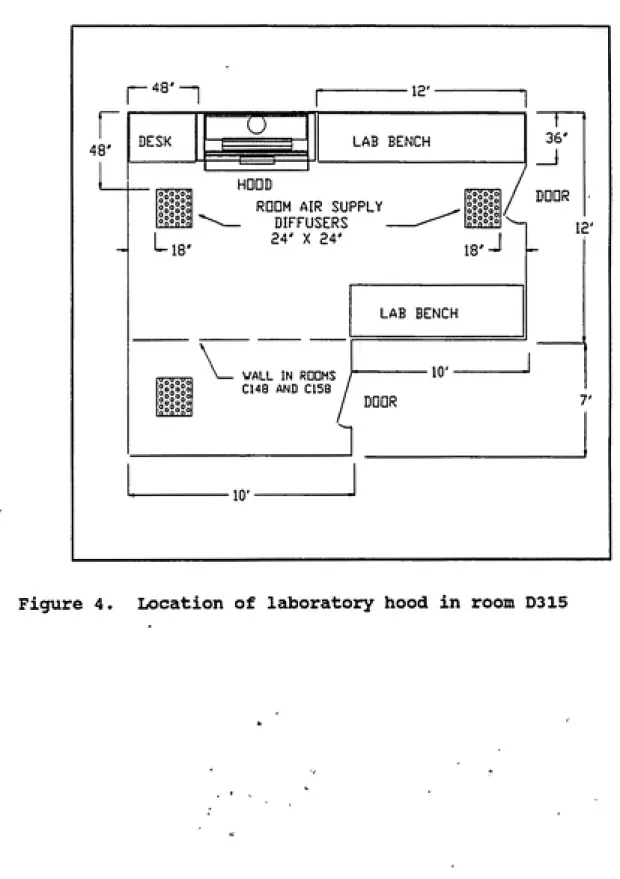
The hoods were located in three separate rooms of similar size and layout. The hoods were well positioned in the rooms with respect to walls, doors, and replacement air supply (Figure 4.). The hoods in rooms C158 and C148 shared the same exhaust and auxiliary supply ducts, however the third room,
D315, was part of separate system.
The hoods are connected to the ventilation system by 10"
rectangular duct with the exhaust passing through a bag-in
bag-out HEPA filtration unit. The exhaust duct contains no
less than 4-90 degree bends with 90 degree branch entries to the main. The flows are controlled and regulated by
pneumatically operated dampers. The control system attempts
to regulate auxiliary supply and exhaust volxomes through total
19
r---50'---^
-V_A---lO'D,
"*
LIGHT - - 1
! !i J
X
38'
TDP VIEW
EXHAUST DUCT
AUXILIARY SUPPLY DUCT ^ 20' -»i AND PLENUM _^
SASH
AIR FOIL SILL
n r
LJHJ__Bii
r- 10'
14'
27-38'
FRDNT VIEW
All Units = inches
53'
L— 34' —J
SIDE VIEW
BAFFLE PDSITIDN:
#1
^ rio'
\j
/~\
1,5'
TOP SLDT
3/8'
MIDDLE SLOT
BQTTDM SLDT
l,5'-v
ͣ
1/2'
L—25'-LIGHTER THAN AIR
#2
ZZv
3/4'
TDP SLDT
/
1/2'
MIDDLE SLDT BDTTDM SLDT
1,5'^
GENERAL USE
0'
TDP SLDT
t'
WDDLE SLDT
BDTTDM SLDT
1,5'^V
2.75'
HEAVIER THAN AIR
21
DESK
12'
LAB BENCH 36'
18'
ROOM AIR SUPPLY
DIFFUSERS
24' X 24'
DDDR
18
O ^
WALL IN ROOMS C148 AND C158
LAB BENCH
12'
10'
DDDR
10'
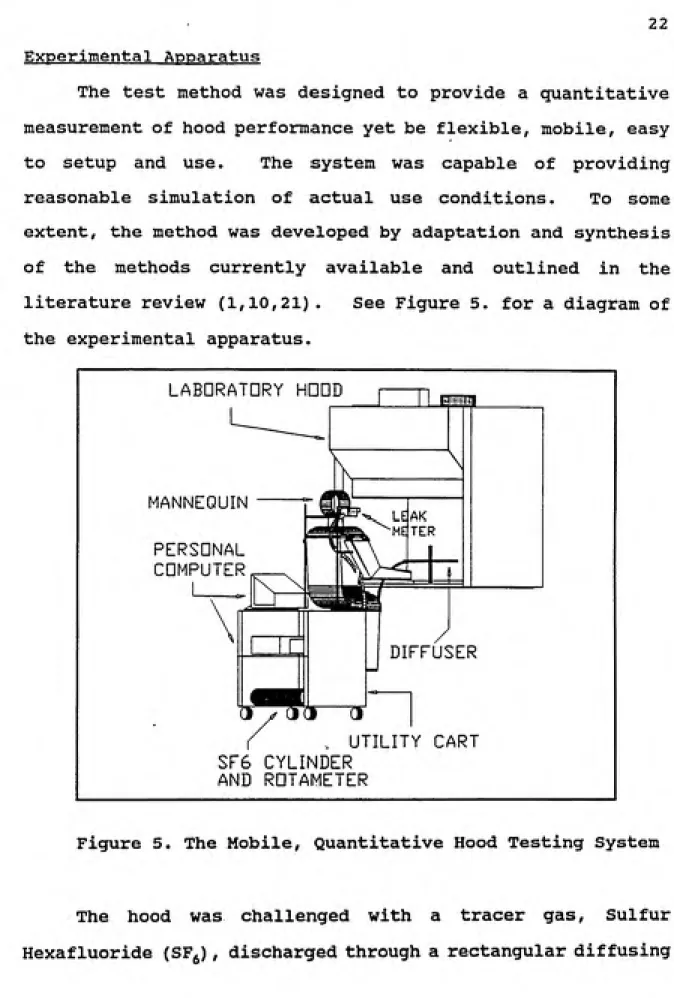
Experimental Apparatus
The test method was designed to provide a quantitative measurement of hood performance yet be flexible, mobile, easy to setup and use. The system was capable of providing reasonable simulation of actual use conditions. To some
extent, the method was developed by adaptation and synthesis
of the methods currently available and outlined in the
literature review (1,10,21). See Figure 5. for a diagram of
the experimental apparatus.
LABDRATDRY HDDD
«PM
MANNlQUIN
PERSDNAL CuMPUTER
£
LEAK
METER
DIFFUSER
n—d
UTILITY CART SFG CYLINDER
AND ROTAMETER
Figure 5. The Mobile, Quantitative Hood Testing System
The hood was challenged with a tracer gas. Sulfur
23
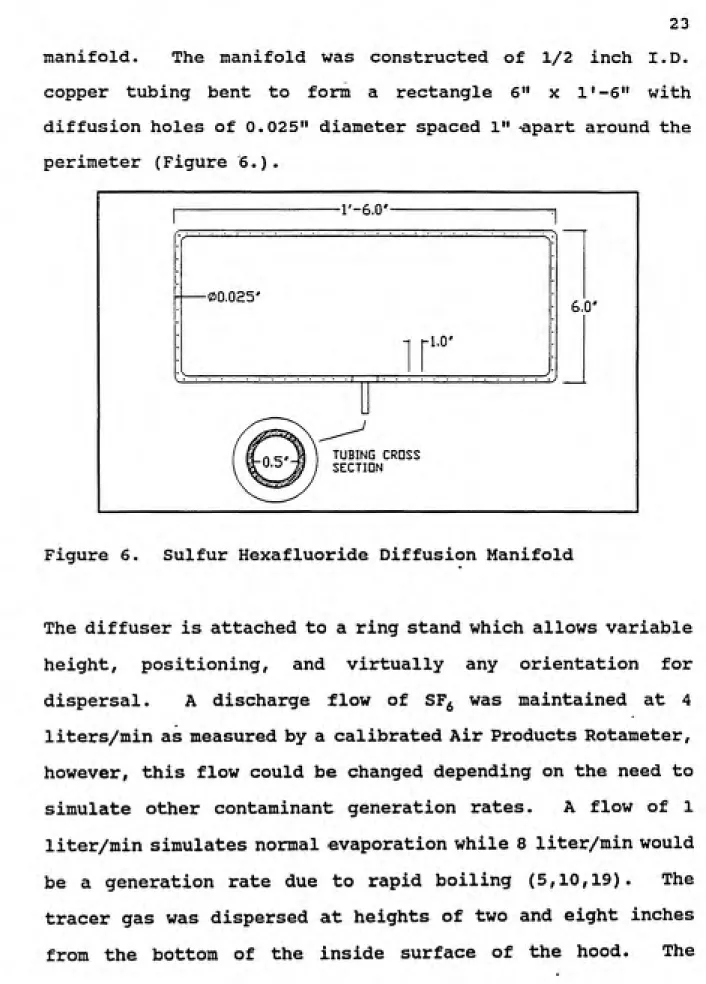
manifold. The manifold was constructed of 1/2 inch I.D.
copper tubing bent to form a rectangle 6" x l'-6" with
diffusion holes of 0.025" diameter spaced 1" apart around the
perimeter (Figure 6.).
i u.u ͣ ---1
•V---. ,
-1,0' :
TUBING CROSS SECTION
6.0'
Figure 6. Sulfur Hexafluoride Diffusion Manifold
The diffuser is attached to a ring stand which allows variable
height, positioning, and virtually any orientation for
dispersal. A discharge flow of SF^ was maintained at 4
liters/min as measured by a calibrated Air Products Rotameter,
however, this flow could be changed depending on the need to
simulate other contaminant generation rates. A flow of 1
liter/min simulates normal evaporation while 8 liter/min would
be a generation rate due to rapid boiling (5,10,19). The
tracer gas was dispersed at heights of two and eight inches
adjustable height diffuser was positioned eight inches from
the hood face and ten inches from the side walls.
The rotameter, E29-R-150 MM4, regulating tracer gas flow
was calibrated against a 133.2 cc/mm Warren E. Collins Chain
Compensated Gasometer. The rotameter was calibrated with air and corrected for the density of SF^, assuming pressure and velocity differences were negligible. The small rotameter,
#210, used to measure the leakmeter inlet flow, was calibrated
with a Gilian Minibuck Calibrator. Refer to Appendix IV for
rotameter calibration data. ..-,
A stationary mannequin, Resusci Anne, was used to simulate a worker at the hood face. She was positioned with her nose 1" outside the plane of the hood opening with her arms projecting into the hood. The mannequin was positioned in the middle of the hood opening with the top of her head
measuring 26 inches from the bottom of the hood. The
mannequin's presence at the hood face resulted in approximately 36% blockage of the hood opening.
Leakage from the hood was measured in the breathing zone of the mannequin with an ITI Leakmeter Model 120 electron capture detector. The Leakmeter was calibrated before each
hood test with known concentrations of SF^ injected into a
well mixed 3.69 liter dilution flask. The leakmeter was
2 5
Appendix III for calibration data and plots.
Peak Breathing zone concentrations were measured and
recorded every 30 seconds for ten minutes to arrive at an average peak concentration leaking from the hood. As opposed to using a time weighted average (TWA), measurement of maximum concentrations leaking from the hood would provide the most
appropriate indication of overall performance. The primary
objective of the laboratory hood is to contain contaminants, therefore control of peak leakages would inevitably control time weighted exposures. Furthermore, the problems associated with trying to simulate more than the presence of the worker combined with turbulent flow in the hood, would result in a
misrepresentative or conservative TWA. The breathing zone
concentration data was entered into a three dimensional Lotus
Spreadsheet for data analysis and further analyzed statistically for variance.
Measurement of Exhaust Flow
Hood flow was determined by two methods. The first was determination of flow in the duct of the hood by an Air Monitor Corporation Volumetric Air Flow Control System. The system utilizes an array of Pitot tubes to measure air flow and has a constant volume regulator which actuates damper
velocity multiplied by the area of the hood opening.
Face Velocity Measurement
Values of hood face velocity were obtained by taking the
average of a nine point traverse across the hood face with an Alnor Thermoanemometer Model 8500D-II. The Alnor Thermoanemometer was calibrated in a Kurz Instruments Model
400 Air Velocity Calibration System. Calibration data was
obtained by measuring velocities in the wind tunnel downstream
of a critical orifice over a range of pressure drops. Refer
to Appendix II for results of anemometer calibrations.
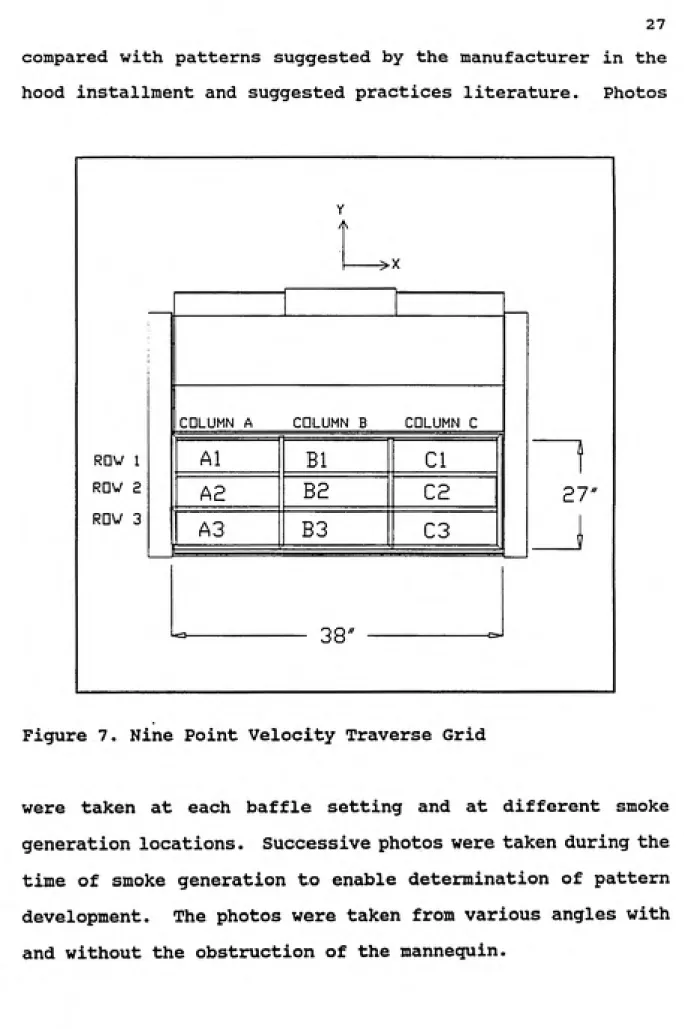
The nine point face velocity traverse was performed by
dividing the plane of the hood opening into nine equal area
grids and measuring the velocity at a point located at the
center of each grid. Refer to Figure 7. for a diagram of the
face velocity traverse grid overlaid on the hood opening.
The traverse was performed three times for each baffle
position (Figure 3.) with the hood unobstructed and once again
with the mannequin present. The face velocity traverse
enabled the determination of air flow distribution across the
hood opening.
Determination of Air Flow Patterns
Air flow patterns and hood containment were determined
27
compared with patterns suggested by the manufacturer in the
hood installment and suggested practices literature. Photos
RDV 1 RDV 2 RQV 3
COLUMN A
Al A2 A3
Y
->X
COLUMN B
Bl
B2
B3
38"
COLUMN C
CI
C2
C3
27"
Figure 7. Nine Point Velocity Traverse Grid
were taken at each baffle setting and at different smoke
generation locations. Successive photos were taken during the
time of smoke generation to enable determination of pattern
development. The photos were taken from various angles with
Measurement of Hood Performance
Each hood test consisted of collecting data corresponding to the fields on the sampling strategy form in Appendix VIII. The tests were performed at a fixed sash height of 27 inches and activity in the room was kept to a minimum during testing.
The test procedures were as follows;
1.) Determine exhaust and auxiliary supply
volumes,
2.) Adjust baffle for one of the three baffle positions, 3.) Perform face velocity traverse, unobstructed and with
the mannequin present,
4.) Position diffuser in the hood at either the low or high generation heights, 2 inches and 8 inches
respectively,
5.) Begin Discharge of SF^,
6.) Wait for 1 minute and begin collecting the peak breathing zone concentration every 30 seconds for ten
minutes,
7.) Change baffle position, allow 1-3 minutes for equilibrium and repeat data acquisition.
The procedure was continued until three separate trials
had been performed at each baffle position and tracer gas
release height. The process was then performed at two more
29
Test of Slot Blockage
To evaluate the effects of storing materials within the
hood, a hood was tested at 50% and 100% blockage of the bottom
Three auxiliary supply hoods of the same type and dimensions were tested at different locations within NIEHS.
The experimental results indicate the factors of baffle position, contaminant challenge height and flow have significant effects, P < 0.0001, on overall laboratory hood performance. These factors can be manipulated and combined
with good laboratory hood work practices to arrive at optimum
hood performance and reduced potential for employee exposures.
Hood Use Questionnaire
The survey results indicate that hood use and hood design are somewhat incompatible. The majority of the 50 hood users surveyed were either unaware, unwilling or simply unable to follow the guidelines for use provided by the hood manufacturer. Work practices, such as storage of materials within the hood and working with the sash fully open, are commonplace and necessary under many circumstances. Approximately 95% of the hood users questioned, stored materials in the hood for a variety of reasons, including
31
with the sash half open or at varied height depending on the work being performed. As far as knowledge of hood functions
were concerned, greater than 60% of the employees questioned
were unaware of the function of the baffle and only 10% of
these individuals had actually made any adjustments. These
practices contradict the intended use for which these hoods
were designed. The manufacturer suggests working with the
sash half way closed at all times. The hood was also not
designed to accommodate storage of materials such as
equipment, chemical containers or beakers and flasks. Refer
to Appendix I. for a copy of the hood survey questionnaire
and response data.
Flow Measurements
Exhaust and auxiliary supply flow were obtained from the continuous flow monitors located on the interstitial floor
above each laboratory. The flows ranged from 750 cfm to 1100
cfm. The hood in room D315 had an exhaust of 1100 cfm. The
auxiliary supply flow was measured at 630 cfm, comprising
approximately 57% of the exhausted air flow. The air flows through this hood fluctuated approximately +/- 20 cfm. Calculation of the average face velocity from the relationship
of flow equaling velocity times hood face area, 7.125 ft^,
resulted in a predicted velocity of 152 fpm. The hood in room
C158 had an exhaust flow of 850 cfm with variation of plus or
resulting in a minimum of 49% of the exhausted air flow. The predicted face velocity was 12 0 fpm. The hood in room C148
had the lowest flow of 750 cfm with an auxiliary supply flow
of 350 cfm. The auxiliary supply was 47% of the exhausted air
volume. The predicted average face velocity was 104 fpm. The
exhaust flow on this hood fluctuated wildly about 750 cfm.
Some mechanical difficulty with the flow measuring gauge was
suspected.
Face Velocities
Adjustments to the baffle position had substantial effects on face velocities. The averages of the nine velocities of the traverse grid were found to be similar for each baffle position. However, the distribution and relative
magnitudes of the velocities were substantially different from
point to point on the grid. This data is suiamarized in Table
I, where the average velocity was calculated from the mean of
the velocities measured at each grid point and the maximum and
minimum velocities were used to calculate the percent
difference in point to point velocity values. For actual data
corresponding to the locations and variance of the individual
velocity measurements, refer to Appendix V - VII, containing
velocity data for each hood test.
It is clear from the values calculated for percent
23
Table I. Results of Face Velocity Traverse
Hood- RoomD315
Flow - 1100 cf m
Predicted Average Velocity - fpm = 154
Baffle Position
#1 #2 #3
Average Velocity - fpm 150 146 151
Maximum Velocity - fpm
Minimum Velocity - fpm
235 131 210 124 166 142
Percent Difference - % 57 51 15
Hood- Room C158
Flow - 850 cfm
Predicted Average Velocity - f pm ͣ 119
Baffle Position
#1 #2 #3
Average Velocity - fpm 111 109 104
Maximum Velocity - fpm
Minimum Velocity - fpm
178 82 154 94 120 91
Percent Difference - % 74 48 28 Hood- Room C148
Flow- 750 cfm
Predicted Average Velocity - fpm =B 105
*
Baffle Position
#1 #2 #3
Average Velocity - fpm 74 72 73
Maximum Velocity - fpm Minimum Velocity - fpm
118 24 123 28 123 39
Percent Difference - % 132 126 103
Notes: Baffle Position: #1 -'Lighter Than Air'
#2 -'General Use'
percent difference of point to point velocities from
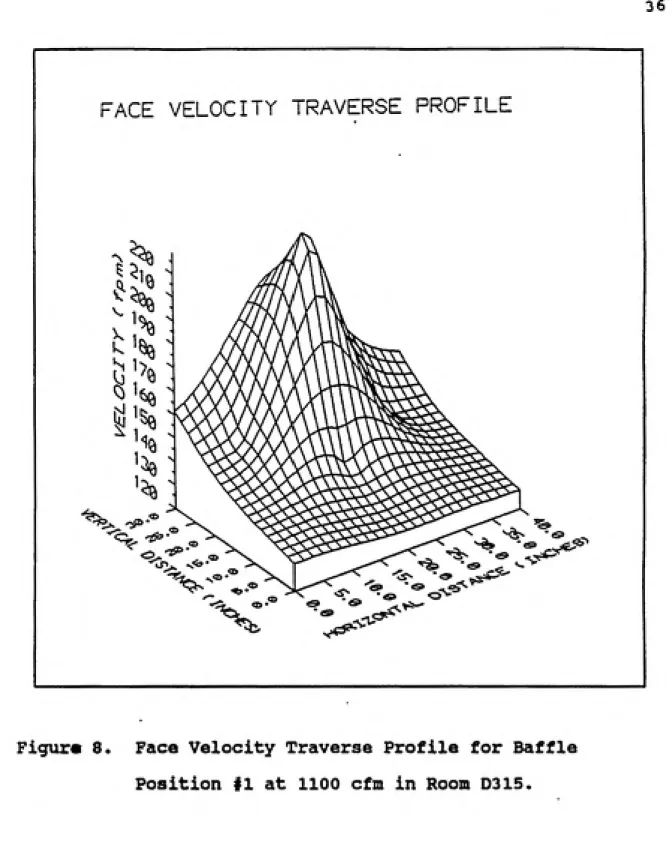
baffleposition #1 to baffle position #3 resulted in a more uniform velocity profile and thus better air distribution at the face of the hood. The following three-dimensional plots, Figures 8-16, display the velocity profiles over the face of the hood opening corresponding to each baffle position and for each hood flow. The graphs were generated using a
graphical software package called Surfer. The plots provide
a visual representation of velocity contours and differences between baffle settings. The data points plotted were the mean face velocities calculated at each traverse location.
For all hood tests, the velocity distribution is similar at each baffle position. In baffle position #1, the velocities are much higher in the areas Al - CI at the top of the hood. There is also a peak velocity located at the middle of the hood opening, region A2 - B2. Baffle position #2 has the same general distribution as position #1, however the velocities are not as extreme. The third baffle position, in which the bottom slot is being utilized, has the most uniform distribution of velocities and in some cases, such as hood
C158 operating at 850 cfm (Figure 13) , the velocities are highest in magnitude along the bottom of the hood face.
The velocity traverse was also performed with the
3 5
percent lower in front of the mannequin. These results are as expected but somewhat difficult to quantify as the anemometer measures velocity unidirectionally and therefore
would not represent the true direction of air flow around the
FACE VELOCITY TRAVERSE PROFILE
^
^
%
^
Figure 8. Face Velocity Traverse Profile for Baffle
37
FACE VELOCITY TRAVERSE PROFILE
^
%
Figur« 9. Face Velocity Traverse Profile for Baffle
FACE VELOCITY TRAVERSE PROFILE
^
Figur« 10. Face Velocity Traverse Profile for Baffle
39
FACE VELOCITY TRAVERSE PROFILL
Figure 11. Face Velocity Traverse Profile for Baffle
FACE VELOCITY TRAVERSE PROFILE
^ •
41
FACE VELOCITY TRAVERSE PROFILE
^
v^"
Figure 13. Face Velocity Traverse Profile for Baffle
FACE VELOCITY TRAVERSE PROFILE
^ .
^
%
^
^^^^
Figure 14. Face Velocity Traverse Profile for Baffle
43
FACE VELOCITY TRAVERSE PROFILE
^
^Q
^
Figur« 15. Face Velocity Traverse Profile for Baffle
FACE VELOCr "Y "RAVERSE PROFILE
^
%
v^"
Figure 16. Face Velocity Traverse Profile for Baffle
45
Quantitative Leak Tests
Three hoods with different exhaust rates, were challenged
with the SF^ tracer gas. The average peak concentration of
tracer gas escaping from the hood was measured in the breathing zone of the mannequin. The measurements were made at all three baffle settings and at two tracer gas release heights. All factors proved to have statistically significant effects on containment and hood performance.
The baffle and slot configuration were found to greatly
influence the amount of leakage from the hood. Baffle position #1 had the most devastating effects on performance.
This configuration with the top slot open, designed for
"lighter than air" vapors, resulted in air flow distributions which provided little containment effectiveness. In all hood
tests, the highest exposures were found in baffle position #1.
The maximum average peak concentration was 67.5 ppm for the
hood at the flow of 1100 cfm. The lowest exposures for all hood tests were found in Baffle position #3 where the average peak concentration was below the detection limit (BDL) measured in the breathing zone of the mannequin. This position utilized the bottom slot and had the top slot closed. Baffle position #2, which had all three slots partially open,
resulted in leak rates which were somewhere between #1 and #2
for every hood test.
The lower height of 2 inches corresponded with the highest
leakages. The release height of 8 inches was effectively
controlled for all baffle positions with the exception of the
hood with the highest flow. The average peak concentration
still decreased, however, by 96 percent to 2.50 ppm. Hood
tests at the lower flows displayed decreases in average peak
concentrations of at least 50% by increasing tracer gas
release height.
The effect of flow was somewhat difficult to quantify
due to the influence of many variables, however the results
indicate an optimum range of flow exists. The higher flow
hood, 1100 cfm, had the most extreme peak leak rate of 67.5
ppm. The 850 cfm hood performed well for all hood trials with
a maximum average peak leak concentration of 1.60 ppm in the
worst baffle position. The lower air flow of 750 cfm had a
higher leak rate than the 850 cfm hood with an average peak
concentration of 3.40 ppm. Thus, the hood operating at 850
cfm exhibited the best overall performance of the flows
tested.
Results of tracer gas tests are summarized in Table II.
The mean peak concentration reported in the table is the mean
of the three trials performed at each test condition. Figures
17. - 22. are plots of the average peak concentrations
determined for each trial versus baffle position. Refer to
Appendix VIII - X for actual concentration data corresponding
4T
Table II. Summarized Results of Tracer Gas Tests
Mean Peak Concentration
ppm Hood Flow
llOOcfm 850 cfm 750 Cfm
Challenge Position - low
#1 67.5 1.6 3.4
Baffle Position #2 10.8 0.95 0.7
#3 BDL BDL BDL
Challenge Position - high
#1 2.5 0.8 0.5
Baffle Position #2 0.5 BDL BDL
#3 BOL BDL BDL
Notes: Tracer Gas Release Rate - 4.0 liters/minute
Baffle Position: #1 - 'Lighter Than Air'
#2 - 'General Use'
#3 - 'Heavier Than Airr
BREATHING ZONE CONCENTRATIONS
For Laboratocy Hood (§1100 cfm
z so
BAFFLE POSITION
_«>TRIAL#1 «^TRIAL#2
LOW CONTAMINANT GENERATION HEIGHT LABD315
TRIAL #3
Figure 17. Average peak concentrations versus baffle
49
BREATHING ZONE CONCENTRATIONS
For Laboratocy Hood <S UOO cfm
BAFFLE POSmON
_,_TRIAL#l «»_TRIAL#2 ^
HIGH CONTAMINANT GENERATION HEIGHT
LABD315
.TRIAL #3
Figure 18. Average peak concentrations versus baffle
BREATHING ZONE CONCENTRATIONS
For Labontoty Hood (3 850 cfm
U a5
BAFFLE POSITION
_».TRIAL#1 «^TRIAL#2 ^
LOW CONTAMINANT GENERATION HEIGHT Ij\BC158
.TEUAL#3
Figure 19. Average peak concentrations versus baffle
51
BREATHING ZONE CONCENTRATIONS
For Laboratory Hood <S 850 dm
BAFFLE POSmON
.^•nUAL*! -^TRIAL#2 _,
HIGH CONTAMINANT GENERATION HEIGHT U3 C15S
,'nUAL#3
BREATHING ZONE CONCENTRATIONS
For Laboritoty Hood @ 750 cfm
BAFFLE POSmON
-^TRIAL#1 ^^TRIAL#2 ^
LOW CONTAMINANT GENERATION HEIGHT
LABC148
.TRIAL #3
Figure 21. Average peak concentrations versus baffle
53
BREATHING ZONE CONCENTRATIONS
For Laboratocy Hood @ 750 cfin
U a2
I-BAFFLEPOSmON
_».TRIAL#1 _^TR1AL#2 «
HIGH CONTAMINANT GENERATION HEIGHT
LABC148
.TRIAL #3
Figure 22. Average peak concentrations versus baffle
Results of Statistical Tests
A three way Analysis of Variance procedure (ANOVA), utilizing a general linear model, was applied to test the main effects of baffle position, height, and exhaust flow on
breathing zone concentrations. The Three factors and their
interactions were all found to be statistically significant
(P < 0.0001). As a result of the high degree of
heteroscedasticity in the concentration results, a square root
transformation of the data was performed prior to the ANOVA.
Pairwise comparisons were made using the Fishers Least
Significant Difference (LSD) test. This test is a multiple
comparison procedure designed to control excessive error rates when doing multiple pairwise comparisons. The tests were performed at the 0.01 and 0.05 significance levels. Results are tabulated in Appendix XII.
Results of Blockage and Shelf Test
Blockage data were collected for only one hood, operating at 1100 cfm. Performance was measured in baffle position #1
and baffle position #3 with a tracer gas challenge height of
2 inches. These two positions corresponded to the best and
worst cases from the above data. Face velocity and average
breathing zone concentrations were measured at 0, 50%, and
100% blockage of the bottom slot. This data was then compared
with results from data collected with a 36"x 8" x 2" shelf in
^ • .ͣ ' ͣ ' " 5 5 The results indicate blockage of the bottom slot may have some influence on the laboratory hood performance, but not for expected reasons. Appendix XI contains the blockage data for
average leak concentrations and velocity traverse data. In
baffle position #3, where the bottom slot is most utilized, the average peak concentration was below the detection limit
for all conditions accept for 100% blockage, where the value was 0.9 ppm. The face velocity data for this baffle position show a relatively consistent point to point percent difference of approximately 20% with the exception of the unblocked condition. The percent difference for this condition was 30% due to the high velocity measured at position Bl on the velocity traverse grid. In baffle position #1, where the bottom slot is utilized least, the average peak concentrations were found to increase with percent blockage of the bottom slot. The condition of 0% blockage resulted in 29 ppm leakage to 35 ppm for 50% blockage and a maximum of 61 ppm for 100% blockage. The shelf showed little or no benefits for this baffle position, as the average peak concentration measured was 59 ppm which was very similar to the 100% blockage case.
Hood Use Questionnaire
The results of the guestionnaire indicate most hood users
are unwilling or unable to use the hood as designed. The hood
users explained their misuse by difficulties imposed by the
poor ergonomic design. The vertical sash prevented performance of duties when the sash was at suggested operating heights. In order to maintain the six to eight inch working distance into the hood, the nose and forehead of the employee would be practically resting against the glass of the sash. Other complaints included lack of leg space beneath the hood and discomfort imposed by the flow of untempered auxiliary
air.
Flow Measurements
The results gathered from the gauges of the continuous
exhaust and auxiliary flow monitors provided good indication
of the actual values of flow. The values of predicted
velocity for the 1100 cfm and 850 cfm hoods were close to
values obtained from the face velocity traverse. The
predicted average velocities of 152 fpm and 120 fpm
57
respectively. The value of 750 cfm is questioned however, due to the low average face velocity of 73 fpm measured during repeated face velocity traverses. An average face velocity
of 73 fpm with a 7.125 ft^ face area would result in a flow of
520 cfm. In all three cases the measured face velocities were
lower than predicted by the exhuast flow. This probably results from the influence of auxiliary air, unidirectional
limitations of the anemometer, and nonuniformity and
fluctuations in point to point face velocities.
Fluctuations in the supply and exhaust flows were as high as 20 - 3 0 cfm. These fluctuations are probably due to the turbulence in the duct. The ventilation system is rather poorly designed as branch entries of nearly 90 degrees are
commonplace. The hoods also operate from a main duct line
which might service multiple hoods and are therefore susceptible to system activity and operations in other hoods. System instability may also result from difficulties encountered in balancing the damper controls. System changes influence damper controls and may require time to equilibrate.
Hoods equipped with auxiliary supply are particularly
susceptible to fluctuations in performance. The purpose of
the auxiliary supply is to replace the amount of conditioned
air being drawn from the laboratory. Consequently the supply
air is drawn directly from the outdoors and undergoes little
degrees fahrenheit. Although this gradient is not sufficient
to cause serious ventilation system difficulties, it may cause turbulence in the hood due to the mixing of different temperature air streams. The untempered auxiliary air also causes worker discomfort at the hood face during seasons of extreme heat or in the cold of winter. The temperature extremes can also affect chemicals being used in the hood.
The auxiliary air flows through a rectangular duct where it enters a plenum above the hood. The plenum allows for even distribution and diffusion of air across the entire hood
opening. These hoods however, do not have adequate plenum space and therefore result in an uneven air distribution. This was evident from the high velocity values consistently found in the middle of the hood opening as can be seen in nearly all the velocity profiles. The auxiliary supply has sufficient velocity upon exiting the duct to continue down the hood face in the form of a jet which can potentially cause reentrainment of contaminant into the room air. For this
reason, the auxiliary flow must be monitored and controlled.
For example, practice tests of hood leakage were performed
prior to collecting data. The hood was operating at 1100 cfm
with an auxiliary supply of 850 cfm or 77% of exhausted
volume. It was noticed during the pre-test that the
background concentration of SF^ in the laboratory rose to
greater than 100 ppm. The velocity of the auxiliary supply
ͣ
'>ͣ<>.ͣ>. ^ .,.ͣ:, '^ ͣͣ;ͣ : ͣ ' 59
the tracer gas. The auxiliary flow was then reduced to less
than 700 cfm or approximately 60% of exhausted air at which
point no leakage was attributed to auxiliary flow
reentrainment. In fact, the performance of the hood actually
benefited from the influence of the auxiliary supply. This
phenomenon will be discussed in detail later.
The effect of the auxiliary supply jet also complicated
the measurement of face velocities. The method of measuring
face velocities, relies on the assumption that air is flowing
perpendicular to the hood face. This is not true of auxiliary
air entering the hood. The trajectory of air from the
auxiliary supply has a vertical component and thus is
difficult to measure based on the unidirectional limitation
of the hot wire anemometer.
Measurement of Velocity
The face velocity traverse data yielded surprisingly
consistent results in light of the measurement difficulties.
The influence of the auxiliary supply and air flow patterns
resulting from baffle positioning and slot configuration had
little effect on the average face velocities. The average
values calculated from the traverse were consistent even at
different baffle positions. However, the point to point face
velocities were very different as can be seen in the velocity
measurement. It was noticed that even a small change in the
pitch angle of the probe resulted in much different velocities
than for the probe parallel with the hood face. Variations
as high as 50 - 80 fpm were recorded. This indicates the
velocity vectors are often not perpendicular to the hood face.
Air flow patterns are influenced by the baffle
positioning and actual patterns are observed to be different
than stated by the manufacturer. The angle of the baffle and
the slot configuration have significant impact on the
formation of a vortex at the top of the hood. Figure 23. is
a diagram of the flow patterns associated with each baffle
position.
In baffle position #1, the top slot is open approximately
1.5" and the upper baffle is at an angle of 45 degrees from
the vertical. In this position the plenum to the bottom slot
is all but closed, resulting in relatively little air flow
through the bottom slot. The face velocity traverse indicates
high velocities at the top of the hood with correspondingly
lower values at the bottom of the hood face. The61
TriESRETICAL FLOW PATTERNS SUGGESTED BY MANUFACTURER
BAFFLE PDSITIDNS #1
LIGHTER THAN AIR
ACTUAL FLOW PATTERNS BY VISUAL DBSERVATIDN
J
GENERAL USE
#3
HEAVIER THAN AIR
Figure 23. Air flow patterns suggested by manufacturer versus
actual observed smoke patterns.
Observation of smoke patterns indicates this is not the case.
The air does indeed flow towards the top slot. However, as
resulted in concentrations over the maximum limit of the
device. This indicates the existence of very high concentrations, greater than 1900 ppm, in close proximity to
the breathing zone of the worker.
Baffle position #2 has the baffle at an angle of 40 degrees from the vertical with the top slot open only 3/4 inches. The middle slot is now open 1/2" and the plenum to the bottom slot is open 1 inch. The resulting air flow patterns are more favorable than baffle position #1, as some air does enter the bottom slot resulting in a more uniform velocity distribution. The top slot still forces the formation of the vortex but to a smaller degree than before.
Baffle position #3, has the top slot closed and the maximum plenum space open to service the bottom slot. The angle of the top baffle is 35 degrees and the middle slot is now 1" wide. This configuration resulted in the most uniform velocity distribution for all hood tests. Some contaminant
does escape capture by the bottom and middle slot, however the guantity of air flowing to the top is removed by spaces around the edges of the baffle resulting in minimum vortex
development.
The result of providing a more uniform velocity distribution across the hood opening is to increase the
probability of perpendicular air flow and reduce the formation
of the vortex at the top of the hood. The importance of the
ͣͣͣͣͣ
-•ͣͣ' 63
be discussed in following sections.
Auxiliary Air Flow
The auxiliary air supply can actually reduce the potential for leaks and improve the performance of the hood. If the auxiliary supply system has been designed and maintained properly, the auxiliary air flows across the breathing zone of the worker, thus reducing the potential for exposure. Figure 24. is the flow diagram of the auxiliary air flow distribution for baffle positions #1 and #3 at two sash
positions.
The protection afforded by the auxiliary air is a result of displacing the vortex further into the hood and providing a clean air curtain which purges the breathing zone of the worker. In baffle position #1 and condition la., sash up, the auxiliary air flows out of the plenum and immediately turns
'*^[e Position ttl
Sasi'^ up lb, Sash down
Baffi.e Position #3
2a. Sash up 2b, Sash down!
Figure 24. Auxiliary air flow patterns for baffle positions
#1 and #3.
directly across the body and breathing zone of the user and
the vortex does not have a substantial effect on breathing
zone concentrations. Refer to Appendix XIII photos A - D for
actual photographs of smoke flow.
65
the employee in the path of the air flow would result in a low pressure zone immediately downstream of the person. The proximity of this low pressure zone to the vortex would enable the flow of contaminant into the breathing zone of the person. Visual observation of smoke patterns shows this to be true, although it was not quantified in this research.
Quantitative Leak Tests
The largest reason for leakage from the hood was the existence of the turbulence and backwash in the wake of the employee. The effect of a worker standing in the direction
of air flow results in the phenomenon known in fluid dynamics
as boundary layer separation. The boundary layer separation is characterized by formation of vortices in the low pressure zone immediately downstream of an obstacle. The vortices can entrain contaminant generated in the hood and through backwash allow its escape into the breathing zone of the employee. Refer to Figure 25, for a diagram of the flow separation and
proximity of turbulent backwash resulting from the presence
of an employee in the air flow.
BAFFLE
-> X
z
'lDV
MANNEQUIN
TURBULENCE AND BACKWASH
FLDW
Figure 25. Top view of the hood displaying backwash
resulting from obstruction of air flow into the
hood.
low pressure area increases the potential for backwash and
vortex formation. The existence of this low pressure zone and
the proximity to the location of contaminant generation will
influence the potential for employee exposure.
67
resulting velocity of 150 fpm exceeds the maximum recommended
velocity for this reason. The higher velocity resulted in a
zone of low pressure which enabled turbulent diffusion of high concentrations of tracer gas into this zone. The lowest leakage was measured at 850 cfm. The boundary layer separation at the speed of 110 fpm was not sufficient to entrain a large concentration of tracer gas, therefore this flow offered the best protection. The lowest air flow of 750
cfm had higher concentrations, not due to the separation, but rather to its susceptibility to external influences such as room air currents and movements in and about the hood. An air speed of 70 fpm is not adequate to overcome air currents
generated by external sources.
The importance of the air flow distribution now becomes important in establishing the effect of baffle position on hood containment. In baffle position #1, where air flow is greatest at the top of the hood, the velocity vectors along the bottom of the hood actually have a vertical component in the upward direction. This upward flow of air combined with contaminant in the low pressure zone in front of the
detection for this position in all hood tests.
The effects of the boundary layer separation, combined
with baffle position, can be clearly seen in the photographs
of smoke flow located in Appendix XIII. The photos E. and F.
display flow for baffle position #1 without the presence of
the mannequin. The flow of smoke is upward to the top of the
hood where it becomes entrained in the vortex. Photos G. and
H. display the flow in baffle position #1 with the mannequin
present. The entrainment of the smoke into the lower pressure
zone is depicted in photo G.. Photo H. shows the actual
leakage from the hood. Photographs I - L were taken in baffle
position #3. Most air flow and smoke are captured by the
bottom slot regardless of mannequin presence.
Blockage and Shelf Discussion
The blockage test results indicate blockage of the bottom
slot has little effect on hood performance. The baffle
position #3, which most utilizes the bottom slot, showed
little performance degradation in the presence of slot
obstructions. This results from the positive pressure
gradient that exists regardless of slot blockage. Although
direct flow into the slot is inhibited, the majority of
contaminant will still be collected. The only measured
leakage from the hood in baffle position #3 was 0.9 ppm in the
case of 100% blockage. With the shelf in place the slot is
69
limit.
The increased leak concentrations resulting in baffle
position #1 is not due to the blockage of the bottom slot.
The decrease in the depth of the hood enabled the tracer gas
to accumulate to higher concentrations at closer proximity to
the mannequin. As the percentage of blockage increased the
depth of the hood decreased. Breathing zone concentrations
increased from 29 ppm for 0% blockage to 61 ppm at 100%
blockage. The shelf in this case would have no effect, as no
air flow is through the bottom slot. The same amount of
Based on the results of the hood tests, the hoods found at NIEHS can be manipulated to perform in a very acceptable and safe manner. Optimum performance can be achieved through the coordination of the efforts of the laboratory employee, Health and Safety Branch personnel and facility engineers. The laboratory employee must be responsible for using the hood
in a proper manner. The health and safety staff must be responsible for training the employees in proper hood use and
inspecting the hoods to ensure safe operation. Facility
engineers must be responsible for the monitoring and maintenance of the ventilation system.
Proper Hood Use .
The laboratory employee can decrease the potential for exposures while working in the hood through the following:
a.) Adjusting baffle to position #3 for most hood applications
71
c.) Keep the hood surface relatively free of
obstructions. If storage of materials is necessary, try to align the items along side walls as opposed
to along the back baffle,
d.) Try to elevate the contaminant source off the surface of the hood,
e.) Always work as far into the hood as possible, yet
insure head remains outside the plane of the hood
opening,
f.) Keep movements within the hood to a minimum,
g.) Try to discourage sudden movements in the laboratory
especially the opening and closing of doors,
h.) To increase laboratory comfort, close the sash when hood is not in use to bypass auxiliary air into
the hood.
These proper work practices are essential to reducing the
probability of contaminant exposures. Many of the above
suggestions can be achieved with little effort and
inconvenience.