Dani Brecher. Information Load and Its Effects on Subject Guide Usage: A Quantitative Case Study. A Master’s Paper for the M.S. in L.S degree. March, 2013. 32 pages. Advisor: Claudia Gollop
Library research and instruction departments are increasingly focused on improving and expanding their online subject guides. This case study examines analytic data from one year of subject guide use at a Research-I institution. A sample of over 110 total subject guides was analyzed. The subject guides were examined for indicators of information load, as measured by number of total resources on the multi-tab subject guides and number of pages in each subject guide. Resources in individual guides ranged in number from under ten to several thousand. The analytic data on the guides provides information on how students and other university affiliates used the guides, including time spent in each guide and page views. By correlating the number of resources and pages with the analytic data, preliminary conclusions about best practices for information load in subject guides were drawn, such as minimizing the number of pages in a guide.
Headings:
Academic libraries
Computer assisted instruction
INFORMATION LOAD AND ITS EFFECTS ON SUBJECT GUIDE USAGE: A QUANTITATIVE CASE STUDY
by Dani Brecher
A Master’s paper submitted to the faculty of the School of Information and Library Science of the University of North Carolina at Chapel Hill
in partial fulfillment of the requirements for the degree of Master of Science in
Library Science.
Chapel Hill, North Carolina March 2013
Approved by
Table of Contents
Introduction 2
Literature Review 5
How Library Patrons Use Subject Guides 6
Librarians and Subject Guides 9
Information Load 10
Methodology 12
Results & Analysis 16
Discussion 20
Limitations 21
Implications for Practice 22
Suggestions for Further Research 23
Conclusion 24
Bibliography 25
Appendix I. Sample UNC LibGuide 29
Introduction
Research guides, both in print and online, have been a key component of academic library reference services since the 1970s. In a recent study of Association of Research Libraries (ARL) members located in the United States, all 99 surveyed libraries provided easily accessible research guides from their library home page (Ghaphery & White, 2012). Research guides, a term which includes both course guides and subject guides, tend to be individually tailored to the resources available through a specific library. Even as far back as 2004, the creation and maintenance of digital research guides was an expected component of most subject liaisons’ job duties (Jackson & Pellack,
2004).
The movement of research guides from a primarily print to a digital format means that, with the help of Web analytics, librarians can more concretely track how their user populations are using digital library resources. Up to this point, most publications about research guides have focused on qualitative measures of use, such as surveys and
bibliographies and as more curated sets of resources. The amount of information present in a guide affects how users interact with the guide, including how long they choose to use the guide, and how many people choose to utilize the guide. In this paper, the amount of information present on the guide, in a general sense, is referred to as “information load.” This paper is a first attempt to collect and analyze data on information load in
subject guides and how that affects how students use these guides.
Librarians spend significant amounts of time and effort in creating and maintaining subject guides. Best practices that lead to increased usage yields are
necessary in order to ensure that librarians are spending their valuable hours in creating resources that meet demonstrated user needs and preferences. Quantitative data and analytics can provide that kind of return-on-investment information, as well as
demonstrate trends in certain guides that see more usage. Previous literature has focused on design, access, and content; this study will engage with the information load literature to determine if amount of content has any bearing on subject guide usage.
Over the past two years, the University of North Carolina at Chapel Hill (UNC) Libraries has collected Google Analytics data on their subject guides. Statistics of interest include number of subpages within each subject guide, number of resources on each subpage, the average time users spent on a page, and unique pageviews.
Literature Review
Subject guides grew out of the academic library tool known as the “pathfinder,” which was defined by librarians at the Massachusetts Institute of Technology as “a kind
of map to the resources in the library; it is an information locator for the library user whose search for recorded materials on a subject of interest is just beginning” (Stevens,
Canfield, & Gardner, 1973). These pathfinders were very structured finding tools that provided step-by-step instructions for researching in a discipline. While these guides did evolve over time to become less structured, very little was published on pathfinders during their inceptional period. A more significant body of literature appeared beginning in 1996, as librarians debated the merits of electronic and print research guides (Vileno, 2007). Today, “research guides are as commonplace as books in libraries” (Ghaphery & White, 2012), and there has been a considerable amount of literature written on how people use subject guides and best practices for creation.
As they have evolved, subject guides have been known by a variety of names, including “subject guides, research guides, research tools, pathfinders, electronic library
guides or e-guides, Webliographies, Internet resource collections, resource lists, or subject portals” (Tchangalova & Feigley, 2008) . One key component in the definition of
1996 marked the beginning of an industry-wide shift over to electronic subject guides, as more information resources became available online and direct linking to those resources became an affordance that people expected from research guides. By 2000, in a survey of 59 libraries across the country, 88% of respondents reported that they were creating online-based subject guides. Of the 37 colleges and universities included in that survey, only one was not currently creating online subject guides (Morris & Grimes, 1999). A more recent survey of Association of Research Libraries (ARL) members indicates that it is highly unusual to find an institution of higher learning that does create their own electronic subject guides (Ghaphery & White, 2012).
One consistent complaint about subject guides over the years has been that they require a large investment of time in order to author, maintain, and manage (Gonzalez & Westbrock, 2010; Tchangalova & Feigley, 2008; Vileno, 2007). Since subject guides include such an expansive range of types and resources, some “subject specialists [feel] confused about what to include in research guides” (Tchangalova & Feigley, 2008). For
this reason, there has been a significant amount of literature published concerning best practices for subject guide creation, mostly based on qualitative case studies. These user-focused studies will be discussed in the next section.
How Library Patrons Use Subject Guides
When electronic subject guides first began to be widely adopted, Morris &
Grimes noted that “few librarians know with any certainty whether and how their patrons actually use the guides” (1999). By 2004, 67 percent of survey respondents were
“a strong return on investment metric for research guides” (Ghaphery & White, 2012;
Jackson & Pellack, 2004). Since that time, a number of surveys and usability studies have provided indications of both how and why academic library patrons choose (or do not choose) to utilize electronic subject guides.
In preparing for her own case study at San Jose State, Staley reported that a Duke University study found that, out of one thousand library patrons, 53% reported never using subject guides, with an additional 24% reporting “rare usage” (2007). Determining
how often people use these subject guides is crucial, otherwise creating them may be consider “an exercise in futility” and “updating efforts may be a waste of precious time”
(Strutin, 2008). Despite these low usage numbers, though, other research suggests that students are more likely to seek help from an electronic guide than from a real person at a traditional library service point (Galvin, 2005).
Researchers examining George Washington University’s subject guide usage noted that highly-used subject guides were “based on specific topics or class assignments, so they may appeal to students more than a broad- or discipline-based guide” (Courtois, Higgins, & Kapur, 2005). In the 2011 survey of ARL libraries, 75 out of the 99 libraries assessed included course guides as well as subject guides (Ghaphery & White, 2012) . An additional consideration in choosing to create course-specific guides over the broader subject guides might be that it makes is easier to “see what topics have a dearth of
information and which items are out of date,” forcing librarians to stay on top of updating
their guides (Strutin, 2008).
2008). Even when presented with usability test questions that were specifically designed to be answered by using library subject guides, students tended to turn to the open Web instead, indicating that “students have no idea what subject guides are” (Gibbons & Reeb,
2004).
Other research indicates that subject guide usage increases with marketing efforts from the library. Direct e-mails provided the strongest impact for increasing individual subject guide usage, though social media and listings on the library home page also were attempted (Foster, Wilson, Allensworth, & Sands, 2010).
Without additional context and guidance provided by librarians, a large number of students do not recognize the intrinsic value of subject guides for their research process (Courtois, Higgins, & Kapur, 2005). However, students who received library instruction tend to use subject guides more frequently and to have stronger positive feelings about online research guides (Staley, 2007). When students do use subject guides, research has found that their expectations of the guide and what they are finding in the guide do not match up, as “students are more interested in finding authoritative information from
accepted experts (librarians and faculty members) rather than in using subject guides as a site for their own knowledge production” (Hintz et al., 2010). This implies that students
are looking for more curated and targeted content on subject guides, as well as guidance in the research process, rather than a list of possible resources for them to use.
(Ouellette, 2011). A study at the University of Maryland indicated that guides are most helpful to students when they are “dynamic, searchable, vivid, [and] simple”
(Tchangalova & Feigley, 2008). For this reason, many sets of best practices and institutional sets of design standards have been proposed.
Librarians and Subject Guides
Most librarians in public services, and almost all subject specialists, are now expected to create subject guides as part of their job duties. Librarians not only serve as the creators of subject guides, but also as users. Subject guides are frequently used as a guide for reference questions and as training materials for new staff members or to fill gaps in subject-area knowledge (Wakeham, Roberts, Shelley, & Wells, 2012).
Subject guides today are hosted across a broad range of platforms, with LibGuides being by far the most prevalent. In a 2011 survey of college and research libraries, 69% reported using LibGuides, while a minority of libraries reported using customized open source systems, static HTML pages, homegrown systems, and other commercial systems (Ghaphery & White, 2012). The best practice literature suggests that content management systems (CMS), like LibGuides, provides important affordances in creating subject guides, as they make it easy to replicate content across guides
(eliminating the need to build from scratch every time), produce a standard-looking set of guides, and minimize the amount of time that librarians need to spend in order to create a new guide (Glassman & Sorensen, 2010; Stitz, Laster, Bove, & Wise, 2011).
consider (Wakeham, Roberts, Shelley, & Wells, 2012). Librarians also indicated
frustration in not receiving feedback on the guides from students and that usage measures are not revealing enough. For that reason, the literature urges librarians not to produce subject guides “from the pressure to produce…or ‘just to create them.’ Librarians need to
weigh and consider all facets…before beginning” (Kapoun, 1995). Best practice literature provides a framework for librarians to work within, and many institutions have adopted their own set of guidelines to ensure consistency across subject guides, as well as to minimize the amount of time that librarians spend in building guides from scratch. However, there has been little written about information load best practices, which is the topic of the next section.
Information Load
With the advent of the Internet, information scientists noticed a new problem— the concept of “information overload,” where, for the first time, people were presented with a huge quantity of relevant information, of varying quality. “Information overload”
is defined as “a state of affairs where an individual’s efficiency in using information in their work is hampered by the amount of relevant, and potentially useful, information available to them” (Bawden & Robinson, 2009). In terms of librarianship, there is a related phenomenon called “reference overload,” where librarians provide too many
When faced with too much information, people cope using a variety of cognitive strategies, including satisficing, chunking materials into related groups, and selective acquiring knowledge (J. Rudd & Rudd, 1986). In a study of everyday information seeking, users were found to employ two main strategies: filtering information or withdrawing from information sources that were perceived to include excessive
information (Savolainen, 2007). In terms of implications for subject guides, this means that many users may choose not to use library-created subject guides if they are perceived to have too many resources and information included.
To address the implications of cognitive load theory, best practices for subject guides have been suggested. Relevant suggestions to resource selection include “provide
links to a set of core journal titles or to a relevant subject heading,” “keep text to a
minimum,” and “assist students in self-regulated learning strategies by breaking down the research process into smaller parts” (Little, 2010). In practice, this might mean creating
more pages or boxes that break down the research process, and including fewer
resources. In a study at Brigham Young University, it was found that limiting the number of labels associated with library resources improved response time on research questions for both librarians and students (Miles & Bergstrom, 2009). A similar limiting of
Methodology
Google Analytics was installed on each of the University of North Carolina Libraries’ subject guides, beginning in the 2010-2011 academic year. Subject guides were considered to be any guides listed on the UNC Libraries’ subject guides page
(http://www.lib.unc.edu/guides/). Only guides hosted on the UNC Libraries’ main server
(www.lib.unc.edu) or the LibGuides server (guides.lib.unc.edu) were considered. This means that subject guides created by the Health Sciences Library (HSL) were not considered in this study, as the HSL maintains its own subject guides and analytics. Guides hosted on other servers, including www.aging.unc.edu, were excluded for the same reasons. Guides that were created for a specific course or meant to have a limited term of use were also excluded from this study.
Data for this paper were collected for the 2011-2012 academic school year,
running from summer 2011 to spring 2012. 113 distinct subject guides were hosted on the UNC Libraries’ site during this period, in one of three formats. Though UNC Libraries is
moving toward putting all subject guides on the LibGuides platform, many subject guides were still hosted on the Library á la Carte platform or in an in-house HTML template.
Three semesters’ worth of analytics data was collected for this paper. The summer
from January 1, 2012 to May 4, 2012. Because the summer 2011 semester data covered a significantly shorter amount of time, and fewer students and faculty use the Libraries website during that semester due to decreased enrollment in summer classes, the data gathered from that time period were excluded from the final dataset, to avoid skewing the usage statistics.
Each of the 113 subject guides was reviewed to determine the number of different pages (or “tabs” in the LibGuides terminology) included in each guide. Additionally, the number of resources in each guide was determined. “Resources” is a broad term, and in
this study included any links or references to sources outside of the guide itself. This could include databases, books, the library website, other research guides, citation guides, professional organization sites, or any other information source. For the purposes of this study, whether or not these resources were directly linked from the subject guide was not taken into account—all mentions of any type of resource were considered. These two factors were considered to be proxies for the information load, or amount of content, in each subject guide.
Google Analytics tracks a wide variety of information on web page usage, only a small fraction of which was considered for this analysis. For this study, analytics for “unique pageviews” and “time spent in guide” were gathered. According to the Google Analytics documentation, a “unique pageview...aggregates pageviews that are generated by the same user during the same session” (Google Analytics, 2013). That is, if a person
pageview each of those discrete times. It does not count reloads or refreshes. A session is calculated by Google Analytics as a visit to the page (in this case, the subject guide and its subdirectories) that terminates after 30 minutes of inactivity or at midnight EST (Google Analytics, 2013). A specific user reentering the guide within a 30-minute period is counted as one unique pageview, but if that user returns to the subject guide 31 minutes later, that is counted as two unique pageviews.
“Time spent in guide” is equivalent to the Google Analytics’ “visit length” metric.
Google Analytics measures this as:
Visit Length = (time of last “engagement hit” of visit) – (time of first hit of visit)
where an “engagement hit” is an interaction with something on the page, such as a click
on a link (Cutroni, 2012). It does not measure when an individual exits the page; rather, it measures how long the individual was interacting with the page. This is a key distinction to make. Average time spent in guide was measured in seconds to aid in data analysis, which did not recognize the minute-second default output from Google Analytics.
Once these four measures (page number, number of resources, unique pageviews, and time spent in guide) were collected, the data were cleaned to remove the title of the guide, the subject area it covered, and the type of platform that the guide was built on. One subject guide was removed from the data set at this point in the process; with over 3,000 resources included in the guide, it was a significant outlier and should be
considered a bibliography rather than a subject guide.
Results & Analysis
The two indicators of information load on a subject guide, number of pages and number of resources, were individually graphed against the two indicators of subject use, unique pageviews and average time spent on page.
Table 1: Number of Pages and Unique Pageviews in Subject Guides
59.1% of the subject guides reviewed for this study contained five or fewer pages, and there was an average of 5.1 pages or tabs per guide. 28% of subject guides had just one page or tab.
0 200 400 600 800 1000 1200 1400 1600 1800 2000
0 5 10 15 20 25
Uniqu
e
Pag
e
vi
e
ws
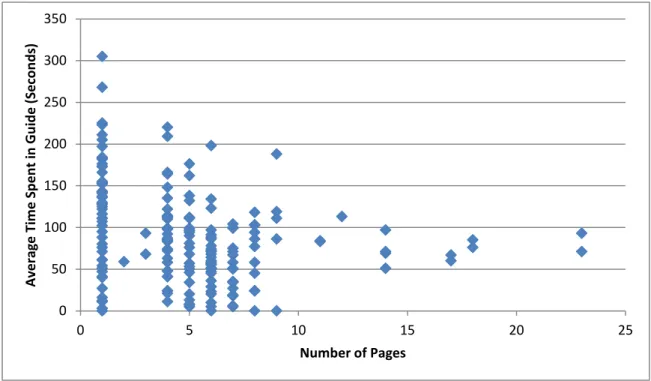
Table 2: Number of Pages and Average Time Spent in Subject Guide
In plotting the relationship between number of pages and average time spent in the subject guide (measured in seconds), 88.1% of the data fell within a range of below 10 pages or tabs and under an average of 200 seconds (3 minutes, 20 seconds) in the guide. 0 50 100 150 200 250 300 350
0 5 10 15 20 25
A ve rag e Ti m e Sp e n t in G u id e (Sec o n d s)
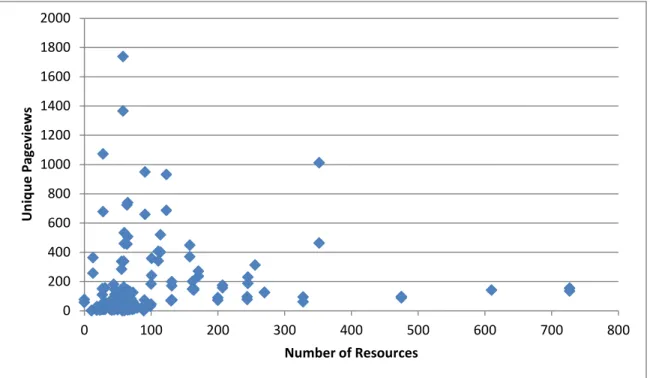
Table 3: Number of Resources and Unique Pageviews in Subject Guide
In the 113 subject guides reviewed, there was an average of 90 resources in each guide. On average, subject guides had 17.65 resources on each page or tab.
Table 4: Number of Resources and Average Time Spent in Subject Guide
0 200 400 600 800 1000 1200 1400 1600 1800 2000
0 100 200 300 400 500 600 700 800
Un iq u e Page vi e w s
Number of Resources
0 50 100 150 200 250 300 350
0 100 200 300 400 500 600 700 800
A ve rag e Ti m e Sp e n t in G u id e (Sec o n d s)
81.2% of subject guides evaluated contained fewer than 100 resources in the total guide, and 41.4% of subject guides contained fewer than 50 resources.
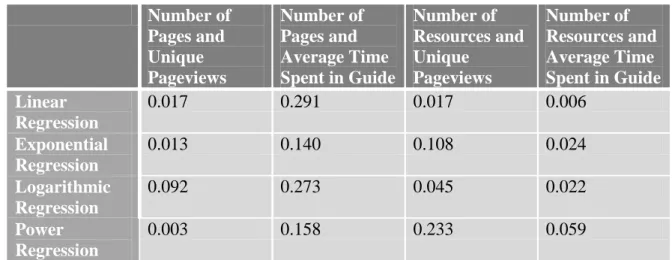
Four different types of regression models were applied to each of these x-y plots to determine the presence of correlation. The R-squared values indicate goodness of fit of the regression model.
Number of Pages and Unique Pageviews Number of Pages and Average Time Spent in Guide
Number of Resources and Unique Pageviews Number of Resources and Average Time Spent in Guide Linear
Regression
0.017 0.291 0.017 0.006
Exponential Regression
0.013 0.140 0.108 0.024
Logarithmic Regression
0.092 0.273 0.045 0.022
Power Regression
0.003 0.158 0.233 0.059
Discussion
Only one of the regression models for correlation between information load, as measured by number of pages and resources in a guide, and usage, as measured by unique pageviews and average time spent in a subject, met the significance cutoff of an R-squared coefficient of 0.25 or larger. In all of the scatter plots, clustering of data points, especially in the bottom-left quadrant of the charts, led to weak correlations. For
example, in Table 1, 28% of the data points were clustered at an x-value of 1. This clustering of data points overshadows the correlation.
Additionally, in all four of these correlation models, there are several data points located on the far ends of both the x and y axes. There are no systematic reasons to exclude these points from the dataset; however, because of the pronounced concentration of data points at one end of the spectrum, these data points lead to correlation models with relatively low R-squared values.
That said, this study did find two areas with some correlation. For a linear regression, number of pages and average time spent in a subject guide had a correlation of 0.291, meaning that 29.1% of the data points could be predicted with a linear model (see Table 2). The negative slope of this correlation model indicates that as number of pages increase, the average amount of time that a user spends in a subject guide
Additionally, number of resources and unique pageviews in a subject guide demonstrated a correlation using a power regression—23.3% of the data points could be predicted with a power model. This power regression indicates that unique pageviews drop dramatically after a certain number of resources present in the guide are reached.
Limitations
This study was quite small—only 113 subject guides were examined, and only over a period of one year. This dataset is too small to make broad generalizations for subject guide development (for example, there is not enough data to indicate what number of resources constitutes “too many,” as the vast majority of the subject guides—
81.2%—held their resources to below 100).
Three different subject guide platforms are used at UNC, which may have some bearing on both design and usage. Those differences were not controlled for in this study.
The measures used in this study to indicated usage were unique pageviews and average time spent in guide. There are certainly many other factors that may contribute to these variables, including page layout, promotion of subject guides in instruction
sessions, number of students enrolled in classes in various disciplines addressed by different subject guides, how often the subject guide is updated, specificity of the topic covered in the subject guide, and complexity of the content.
who interacts with the guide, reads something on a different tab for 31 minutes, and then returns to the guide, is being counted as two unique pageviews and creates a lengthy data point for time spent in guide, which is not necessarily reflective of engagement with the guide.
Implications for Practice
With these limitations in mind, this study does begin to suggest several
implications for practice. The literature indicates, and this study supports the premise, that less is more when it comes to subject guide creation. Subject guide users, according to this case study, tend to spend more time in guides with fewer pages, and they tend to use subject guides more often if they have less resources included. When creating a subject guide, librarians should consider the core needs of their users and then address the subject guide to meet those needs, not necessarily including all relevant information for a given subject area. When creating best practice documentation, libraries may want to consider encouraging librarians to limit the number of pages and resources included in each guide.
Suggestions for Further Research
As previously mentioned, this study was limited in scope and time. Additional, larger studies would likely have more data points at the margins of this dataset, and thus give us more robust regression models that could begin to predict usage based on information load statistics. Larger studies may also be able to control for subject area or design and layout differences.
Conclusion
Bibliography
Bawden, D., & Robinson, L. (2009). The dark side of information: Overload, anxiety and other paradoxes and pathologies. Journal of Information Science, 35(2), 180-191.
Courtois, M. P., Higgins, M. E., & Kapur, A. (2005). Was this guide helpful? Users' perceptions of subject guides. Reference Services Review, 33(2), 188-196.
Cutroni, J. (2012). Understanding Google analytics time calculations. Retrieved March 2, 2013, from http://cutroni.com/blog/2012/02/29/understanding-google-analytics-time-calculations/
Foster, M., Wilson, H., Allensworth, N., & Sands, D. T. (2010). Marketing research guides: An online experiment with LibGuides. Journal of Library Administration, 50(5-6), 602-616.
Galvin, J. (2005). Alternative strategies for promoting information literacy. The Journal of Academic Librarianship, 31(4), 352-357.
Ghaphery, J., & White, E. (2012). Library use of web-based research guides. Information Technology & Libraries, 31(1), 21-31.
Glassman, N. R., & Sorensen, K. (2010). From pathfinders to subject guides: One library's experience with LibGuides. Journal of Electronic Resources in Medical Libraries, 7(4), 281-291.
Gonzalez, A. C., & Westbrock, T. (2010). Reaching out with LibGuides: Establishing a working set of best practices. Journal of Library Administration, 50(5-6), 638-656.
Google Analytics. (2013). The difference between clicks, visits, visitors, entrances, pageviews, and unique pageviews. Retrieved March 2, 2013, from
http://support.google.com/analytics/bin/answer.py?hl=en&answer=1257084
Hintz, K., Farrar, P., Eshghi, S., Sobol, B., Naslund, J., Lee, T., . . . McCauley, A. (2010). Letting students take the lead: A user-centred approach to evaluating subject guides. Evidence Based Library and Information Practice, 5(4), 39-52.
Jackson, R., & Pellack, L. J. (2004). Internet subject guides in academic libraries: An analysis of contents, practices, and opinions. Reference and User Services Quarterly, 43(4), 319-327.
Kapoun, J. M. (1995). Re-thinking the library pathfinder. College and Undergraduate Libraries, 2(1), 93-105.
Miles, M. J., & Bergstrom, S. J. (2009). Classification of library resources by subject on the library website: Is there an optimal number of subject labels? Information Technology and Libraries, 28(1), 16-20.
Morris, S. E., & Grimes, M. (1999). A great deal of time and effort: An overview of creating and maintaining internet-based subject guides. Library Computing, 18(3), 213-216.
Ouellette, D. (2011). Subject guides in academic libraries: A user-centred study of uses and perceptions. The Canadian Journal of Information and Library Science/La Revue Canadienne Des Sciences De L'Information Et De Bibliotheconomie, 35(4), 436-451.
Reichardt, R. (2006). Digital reference overload: Thoughts on how to deal. Internet Reference Services Quarterly, 11(2), 105-112.
Rudd, J., & Rudd, M. J. (1986). Coping with information load: User strategies and implications for librarians. College and Research Libraries, 47(4).
Savolainen, R. (2007). Filtering and withdrawing: Strategies for coping with information overload in everyday contexts. Journal of Information Science, 33(5), 611-621.
Staley, S. M. (2007). Academic subject guides: A case study of use at San Jose State University. College & Research Libraries, 68(2), 119-139.
Stitz, T., Laster, S., Bove, F. J., & Wise, C. (2011). A path to providing user-centered subject guides. Internet Reference Services Quarterly, 16(4), 183-198.
Strutin, M. (2008). Making research guides more useful and more well used. Issues in Science & Technology Librarianship, (55).
Tchangalova, N., & Feigley, A. (2008). Subject guides: Putting a new spin on an old concept. E-JASL: The Electronic Journal of Academic and Special Librarianship, 9(3).
Vileno, L. (2007). From paper to electronic, the evolution of pathfinders: A review of the literature. Reference Services Review, 35(3), 434-451.
29
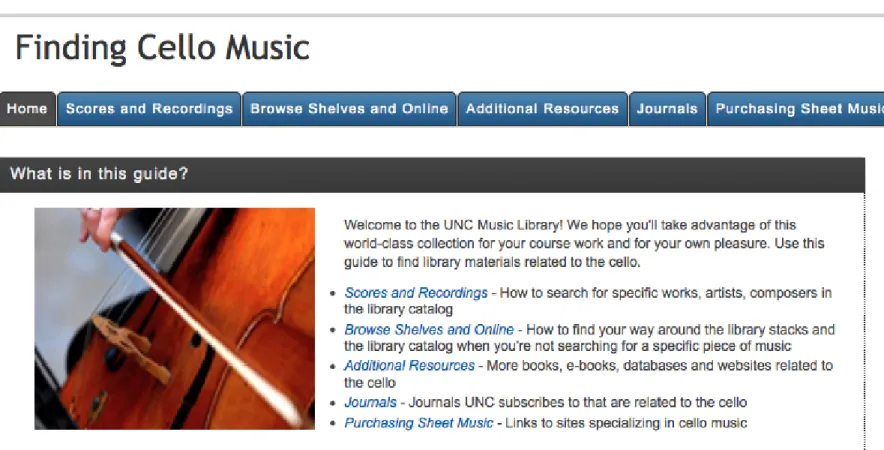
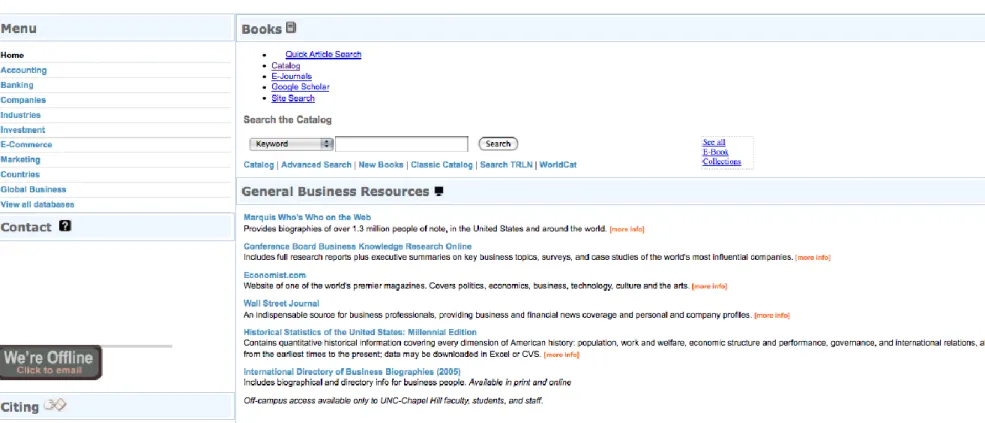
Appendix I. Sample UNC LibGuide
30