The Silver Generation as Potential Purchasing
Power in Budapest: a Case Study
SIKOS T. TAMÁS, DSc.
KOVÁCS CSABA JÓZSEF
P
ROFESSORP
H.D.
STUDENTU
NIVERSITY OFM
ISKOLCS
ZENTI
STVÁNU
NIVERSITYN
ATIONALU
NIVERSITY OFP
UBLICS
ERVICE e-mail: [email protected] e-mail: [email protected]SUMMARY
The age structure of the society in the individual countries belonging to the Visegrád Group has changed significantly since 1989. In Hungary, changes in the age structure have had a great impact on the whole economy. The process of aging in society has been going on in Western Europe and will probably continue. Unlike in the Western European countries, in our region the significance of the purchasing power of the elderly has not yet been fully recognized. There is no best practice or strategy to attract the ever-growing age group; applying marketing to seniors is a novelty in the business sector. Shopping centres and e-business face great challenges in the near future, and the change incorporates the risk of failure or renewal. Although the processes apply to all shopping centres, due to the number and the purchasing power of the seniors, malls in Budapest are more affected. Their situation is not the same even in different areas of the capital, as the composition of the buyers in their gravity zone is different. It is up to their own features, and decision-making abilities whether they will be able to adjust to the new circumstances, who will “win” and who will “lose”. Keywords: silver generation, shopping centre, old-age marketing, gravity zone, Budapest
Journal of Economic Literature (JEL) codes:C55, R12 DOI: http://dx.doi.org/10.18096/TMP.2019.02.06
“May you live in interesting times.” Chinese curse
I
NTRODUCTION
The aim of our research is to reveal the shopping habits of the elderly generation and to draw the attention of retailers to their purchasing power. The decrease in Hungary's population and its aging process is similar to those of Europe's advanced welfare states (Kulcsár & Brown 2017). These trends can be observed in the other Visegrád countries, too, and are very much likely to remain unchanged in the long run. Based on Eurostat data, it can be concluded that in 1996 Hungary's society was the most aged among the four Visegrád countries, with 14.3% of the total population aged 65 or older. In the same year, 13.3% of the population in the Czech Republic, 11.2% in Poland and 10.9% in Slovakia belonged to the same category. By 2016, the population in each of the Visegrád countries had grown significantly older, which is a good indication of the dynamics of the process in these countries. In this 20-year period, the ratio of people aged 65 or older grew to 18.3% both in Hungary and in the Czech Republic, in Poland to 16% and in Slovakia to 14.4%. Therefore, attracting new
silver generations with their purchasing potential can become a strategic goal for the entire region.
Granted, the purchasing power of a significant number of elderly consumers in Hungary is still smaller and – due to the increasing number of new pensioner generations – much more fragmented than in the more developed EU member states. In Western Europe, similarly to North America, pensioners with high income have significant purchasing power potential. In 2016, the relative value of per capita consumption in purchasing power parity reached only 63% of the European Union average in Hungary. In other Visegrád countries, these figures are clearly higher: 74% in Poland, 76% in Slovakia and 78% in the Czech Republic (Eurostat, 2016).
Elderly people have more stable health status, mainly due to the better income conditions we have already mentioned, and lead more active lives than retired people living in the Visegrád countries. Eurostat data show that in 2016, 65-year-old EU citizens can live an average of nearly a decade (9.4 years) healthily. At the same time, it is an important difference that in Western European countries these values are above the average, while in the Visegrád countries they are lower for both men and women, ranging from 3.8 to 8.6 years. In terms of Hungary, it can be stated that the number of older people
receiving higher pensions and being able to pursue a healthy lifestyle is significant, but – as it can be seen from the statistical figures – the majority still belong to the lower income layer of the society and the differences in income are also rather high within the social group, too (KSH 2016). The results of applied research (C & W/H & B 2002) draw attention to the fact that in Hungary 63% of people over the age of 55 and 39% of people older than 14 never did their shopping in a shopping centre, while the figure in the EU was 22%. The sample size of 522 we surveyed is not enough to consider territorial differences representative, but based on the sample we can state that a greater proportion of elderly residents of Central Hungary and Western Transdanubia go to shopping centres than of those living in the Northern Great Plain. We must note that the density of the retail outlets examined in the regions where they are less visited is lower than their density in the regions where these outlets are more frequently visited. The demographic characteristics of Hungary do not differ from the more developed countries, such as the EU member states. Decrease in the population has been continuous since 1980, with minor fluctuations. As for the future of shopping malls, market potential in connection with the population can be an important indicator. The proportion of certain age groups in the population determines the purchasing power potential in the long run, as the ratio of active earners to inactive earners has a significant impact on the distribution of the consumption funds.
The increase of the proportion of elderly people might encourage shopping centre operators to make them more attractive for the older generation, as well as attract young and middle-aged people and families with children more often. In families with small children, women (43%) buy more often than men (24%), and this is true for the whole population. At the same time, men visit shopping centres more times (13) a year than women do (10). Typically, 15– 34-year-olds turn to these facilities on average 18 times a year, while people over 55 go there only 5 times annually (C & W/H & B 2002).
According to some of the expected demographic trends – in connection with the increase in the proportion of the elderly people within the population – the expected increase in the average age at birth and the low number of live births may cause shopping malls and shops to try to attract as many customers as possible from the elderly.
Today's shopping centres tend to focus on young customers and do not pay enough attention to product and service groups that represent a higher proportion of the spending of older people. Trends that are already natural in the spending structure of the elderly in EU countries have not yet appeared in Hungary. This social group consists of a number of segments with different paying capacities than in richer countries. However, we can already observe that older groups with higher pensions spend more on leisure activities and hobbies in Hungary (e.g. travel, theatre and concert tickets, pets, gardening, and souvenirs). These groups therefore deserve increasing
attention in the future, and it would be worthwhile for the shopping centres to "attract" consumers.
M
ARKETING TO
S
ENIORS
–
L
ITERATURE
R
EVIEW
Generational marketing is a young subfield of marketing science. The business sector, unlike the former marketing segmentation methods of the 1950s, recognized the potential of analysing consumers by age group (Konczosné et al. 2010). Since the 1960s, several studies in the United States have been devoted to the consumption patterns of individual generations (Goldstein 1968, Moye 1998, Smith 2008). Since the 1970s, the Yankelovich Center for Social Science has not only occasionally, but regularly reported on the attitudes of each customer age group. Internationally, generation marketing, including marketing to the elderly, is often used in different analyses. In Hungary, the practice of applying marketing science was delayed, similarly to other post-socialist countries, and only after the change of regime in 1989 did it start to spread. This is one of the main reasons why the research and practice of marketing to seniors in Hungary is still in the early stages, and works related to this topic were published only after the turn of the millennium (Csizmadia
& Győri 2014). Since then, despite the growing
importance of the topic, the number of these studies has only moderately increased (Kolos 2010, Csizmadia et al. 2014, Szarka et al. 2014). We have not encountered any academic work that specifically targeting the potential purchasing power of the elderly in connection with Hungarian shopping centres, so we can consider our study as filling this niche.
There is no unified position in the international literature to define each generation; there are several methods used. For the sake of simplicity, we use the triple division (childhood, active age, elderly), generally used by official statistical databases and also the most common
methodological practice in Hungarian research (Törőcsik
et al. 2014). In our study, we considered people aged 60 and over in the group ‘elderly’. In the Western countries and in Hungary, the most frequently used classifications are based on Strauss & Howe (1991).
Most of the practical experience comes from the United States, though by the second half of the 20th century the use of generational marketing in other welfare states was also widespread. It should be noted that there is a large amount of available literature in other English speaking countries internationally. Among the countries with rich literature on the subject, the United Kingdom, Germany and Japan should be mentioned (Burt & Gabbott 1995, Stöver 2012, Kohlbacher & Chéron 2012). Although the number of studies is lagging behind those in the high-ranking target countries, China is also becoming increasingly popular, with its growing customer potential and good business opportunities (Atsmon et al. 2012).
The consumer habits of the Central and Eastern European countries are most similar to those of Western Europeans, but also differ in many aspects. The reason for this – besides lower income conditions – is the difference in basic experiences that determine the attitudes of certain demographic cohorts. The main differences were
summarized by Törőcsik in her paper “Generational
Marketing” (2009) where she grouped and characterized each generation in Hungary. She emphasized the basic experiences that shaped the different generations (such as war and deprivation), which Western Europeans born in the 1950s and 1960s have less experience of. In contrast, in the countries of the former Eastern bloc, the population was hit by several shocks that could be considered serious. In Hungary, after the difficulties of the 1950s, the inhabitants were able to experience an economic upturn and could have a better standard of living than the citizens of most socialist countries. It should be added that the dynamics of this economic recovery are not comparable to that of free market economies. In addition, after the change of regime, the period of learning under market economy conditions is also an important historical milestone that had a great impact on today's elderly customers.
The external conditions surrounding the national economy also have a major impact on consumer attitudes. These include, for example, the retirement age, the average amount of pensions or the individual's willingness to consume. After retirement elderly people are cut off from their working environment and, as their age increases, the number of widows/widowers in this age group will also increase (KSH Census 2011). Most elderly people in Hungary have more leisure time at this stage of their lives, but much lower income than pensioners in Western welfare states.
In the publication Statisztikai Tükör (Statistical Mirror) published on the International Day of Older Persons, the KSH (Hungarian Central Statistical Office) highlighted that retired households accounted for 31% of Hungarian households, and their personal per capita spending in 2012 exceeded the national average. Their consumption patterns differed greatly from the national average in several product groups. The biggest difference was in their spending on health (more than twice the national average), but they also spent significantly more on housing, equipment, food, and enjoyment in proportion to their income (KSH 2014).
It is also important to examine financial transfers between generations, as they also affect the purchasing habits of people over the age of 60. Compared to Western countries, in Hungary the generations are more financially dependent on each other. Often younger family members need to support older people, or it is the other way round, older people's income go to young people. Overall, however, it can be stated that the income situation of people over 60 (contrary to popular belief) is generally more stable than that of younger generations. Statistical data confirm that while the proportion of the elderly in the
poorest income quintile is 11%, in the other income quintiles it is around 25% (KSH 2015).
Individual life situations and individual stages of life also shape the consumption attitudes of the different generations. In this respect, there are fewer differences in our country compared to Western European consumers, as basic human needs are biologically encoded, while demographic characteristics and important life stages are similar to Western societies, so we can rely more heavily on the findings of the international literature. Analysing their characteristics, people over the age of 60 form a more heterogeneous group than younger generations, so they cannot be considered a single, unified segment. It is difficult to influence them effectively with traditional marketing devices, and therefore, in many ways, it would be necessary to renew marketing tools and approaches (Kolos et al. 2014).
Public opinion considers aging to be a negative biological process; in most advertisements – even nowadays – old people appear in a negative role, which can further reduce the effectiveness of conventional devices. In 2012 (with a non-representative sample of more than 500 people) the staff of Széchenyi István University examined the media consumption habits of the elderly, with special regard to television advertisements. It was found that in Hungary, the use of the Internet by people over the age of 60 is even less widespread than in the more developed countries of the EU, but the use of the main communication channels is similar. For old people television and radio are more of a source of information than entertainment. Research results have also revealed that consumers are more critical of advertising as their income situation and education levels increase. In general, the majority of the respondents in Hungary have a negative
attitude towards advertisements (Győri et al. 2015).
We must note that for the elderly, shopping is not just about satisfying material needs, but it is also a community experience for most of them (Kang & Ridgway 1996). Gender-oriented marketing research is also significant for the elderly, as in most societies the age structure is significantly shifted towards women among people over the age of 60. According to the data of the KSH in 2017, there were more women among elderly people in Hungary as well. The buying habits of women and men differ in many respects (Hu & Jasper 2004), which must also be taken into account by the management of shopping centres.
M
ETHODOLOGY
Data used for population assessment are derived from Hungarian Central Statistical Office (KSH), Central Office of Administrative and Electronic Public Services (KEKK) and the Hungarian Land Development Information System (TEIR). In our study we relied on secondary and primary research results. Participants were selected randomly, but in spite of that fact the sample cannot be considered representative. Our questionnaire survey was conducted in
2017 in the Árkád Budapest shopping centre and we asked 156 people about their shopping habits, who were classified into three groups based on their age. Among the respondents, 64 were in the lowest age group (under 30), 43 were middle-aged (between 30-60 years) and 49 were elderly (over 60). The three separate age groups examined in the survey belong to three markedly different stages of life. Approximately 61% of the young people interviewed (under 30 years of age) claimed to be students. Almost all of the middle group were employed, i.e. economically active visitors. Almost 86% of the elderly (over 60 years old) were pensioners. Overall, the majority of respondents were women (68%) and residents of Budapest (72%). Descriptive statistics were applied in this paper to describe basic features of the collected data. The results were processed by SPSS 19 software, and for the GIS analysis Mapinfo 9.0 was used.
D
EMOGRAPHIC AND
I
NCOME
C
HARACTERISTICS OF THE
E
LDERLY
P
OPULATION IN
B
UDAPEST
We have already made general statements about the demographic situation and income prospects of the elderly population, but we find it necessary to analyse them in a separate chapter specifically in relation to Budapest. The secondary data used for demographic analyses were provided by population censuses covering the entire population, thus the assessment of population trends was carried out on this basis. However, in some cases, the 10 years between the two censuses have proved to be too long, so it was advisable to use the statistical data calculated for 2016 in evaluating regional inequalities.
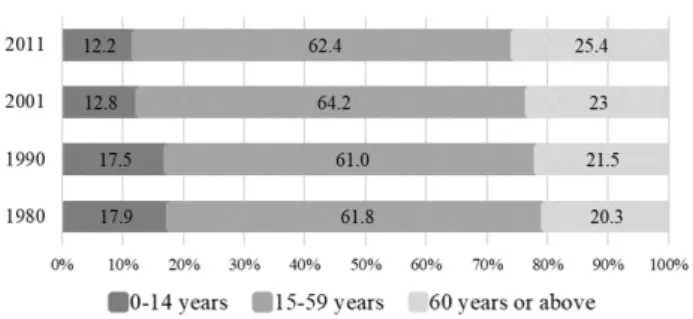
According to the 2011 census data, the number of Budapest residents aged 60 and over was 438,361, which was not only the highest at the settlement level, but also at county level, while the population density of the capital also exceeded the national average. Therefore, not only many potential customers are present, but they are highly concentrated, which is an important aspect of site selection decisions in retail trade. The proportion of the population aged 60 and over in the total population – in line with international and Hungarian trends – has increased in the last 30 years in the capital (Figure 1). According to the census data of 1980, only one in five (20.3%) and every fourth (25.4%) inhabitant in Budapest belonged to this age group, which exceeded the national rate (23.5%) by a few percentage points.
Source: own edition based on HCSO census data
Figure 1. Distribution of population by age group in Budapest
62% of the elderly population are women, 38% are male, and with age, these rates are constantly shifting towards women, so among people aged 70 or older only every third person is a man. The increasing trend continued, based on the calculated data for 2016, the proportion of people aged 60 and over in the capital reached 27.7%.
An important issue for the retail sector is the analysis of the structure of households. Based on this, it can be stated that the proportion of pensioners living alone in the capital is higher than the national average. Monostori (2017), using mathematical-statistical analysis methods, pointed out that the chances of becoming a one-person household are also higher in Budapest than in the countryside. According to the research, this can be led back to cultural factors too, not only to the fact that at birth men have a lower average life expectancy than women. In the capital spatial differences can also be pointed out. The distribution of the elderly population is not even; there are considerable differences between the individual parts of the city. In 2016 most of the 60-year-olds and older lived in Buda, in District XI (41,674 people) and District III (36,275 people), and in District XIV (34,828 people) on the Pest side of the Danube.
Due to the different sizes of the districts, it is advisable to examine the population density of people aged 60 and over in each district. The capital city average was 895 people/ km2 in 2016, with the highest population density
in the city centre and its surroundings and the lowest in the periphery. The highest population density (significantly above the average) can be found in District VII (6,138 people/km2), District VI (3,918 people/km2) and District V
(2.988 people/km2). In contrast, the density in District
XXIII (132 people/km2), in District XVII (421
people/km2) and in District XXII (431 people/km2) did not
reach 500 people/km2, which is roughly equal to the
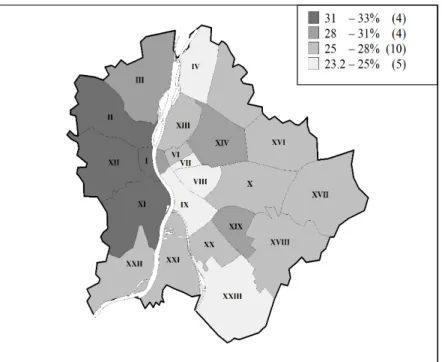
average population density of the county seats. Examining the proportion of 60-year-olds and older people in each district showed inequality (Figure 2). Districts I, II, XI and XII on the Buda side are the most aged districts of the capital. Extreme proportions can also be observed in some districts; in some cases, the proportion of people aged 60
and older is over 40% of the total population. On the whole, the Pest side has a younger age structure, and the proportion of elderly people is the highest in Districts V, XIV and XIX.
The previously highlighted demographic inequalities become valuable information when we look at the distribution of income in the capital. The primary source of income for older people in Hungary is the old-age pension, which is supported by several statistical data sources. The gender breakdown of 60-year-olds and older is important because of their different purchasing habits, but their income situation is also different. In the case of the population aged 60 and over, census data show that men in Budapest are more educated than women, but
income inequalities can obviously attributed to another factors too. Here we mean for example the one-person breadwinning family model (which results in shorter service hours for women) or the level of wages, which is not only due to education, as even today, men are paid more than women in the same job. As a result, men have more disposable income and higher pensions for their older age. This is of less importance when elderly people live in two- or more person households, as the purchasing decision is usually made jointly or rather by women (Pólya 2008). At the same time, based on the 2011 census data, 34% of the "silver generation" in Budapest lived in a one-person household, which is high enough to be taken into consideration in the analyses.
Note: The number in brackets is the number of districts which fall within the category.
Source: own edition based on COAEPS data
Figure 2. Ratio of population aged 60 years or over within the total population of Budapest, 2016
Source: own edition based on KSH data
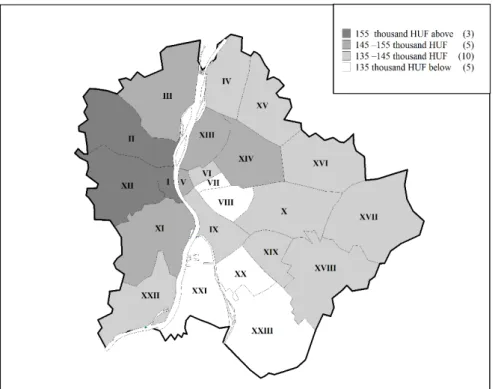
Old-age pensioners account for the largest group among elderly people, which is why we deal with the spatial analysis of the sum of old-age pensions in our study. The majority of old-age pensioners are over 65 years of age, and their lifestyle is very different from that of people aged 60-65. For these reasons, we focus on the group of elderly over 65 years of age in the next chapter of our study. Based on the annual KSH publication Pension, Benefits and Other Provisions (KSH, 2016), the average sum of the old-age pension in Budapest was HUF 143,805 per month in 2016, which is higher than the national average (HUF 121,041). In addition, the distribution of pensions is more favourable than the national average (Figure 3).
38.6% of the pensioners in Budapest had an income between HUF 100,000 and 149,999 per month in 2016, which is similar to the national average (40.5%). The proportion of those with a pension of less than HUF 100,000, i.e. lower than the average, is 22.7% in the capital and 36.8% in the country. The proportion of those with a pension of more than 200 thousand HUF was 15.2% in Budapest, 7.5% nationally.
The spatial movement of older people is more limited because of their age characteristics than those in their active age (Liu et al. 2017). As a result, the good accessibility of shopping centres and the composition of customers in their immediate catchment area gain more importance when analysing this age group in the population. Researchers in regional sciences have a well-defined methodological toolkit for the analysis of gravity
zones and traffic flow in the retail sector (Kincses et al. 2014, Dusek 2016, Kraft 2016).
Before evaluating the geographical location of shopping centres, we discovered the spatial location of elderly people with high purchasing power in the capital (Figure 4). There are significant differences between Buda and Pest this time as well, and the amount of the monthly average of old-age pensions reflects the social perception of districts within the city. In 2016, the highest pensions were received in the prestigious Buda districts (I, II, XII), whose amount exceeded 155,000 forints. Another two Buda districts (III, XI) belonged to the income category of 145,000–155,000 forints, and only in District XXII was the amount almost equal to the Budapest average. The prestige of Pest on the other side of the Danube is traditionally lower, and the composition of its population is less favourable. This is clearly visible in income from pensions: no district from Pest fell in the category of over HUF 155,000, while some internal districts can be found in the band between HUF 145,000–155,000 (V, XIII, XIV). Most of the Pest districts (9) fall in the income category between HUF 135,000–145,000. The average amount of pensions in the remaining 4 Pest districts (VII, VIII, XX, XXIII) and Csepel Island (District XXI) is the lowest. In these districts social groups in segregated situations are highly represented and they remain there in their old age as well. In spite of this, the average sum of pensions in all districts is higher than the national average of HUF 130,000–135,000.
Note: The number in brackets is the number of districts which fall within the category.
Source: own edition based on KSH data
The most important result of the analysis of the demographic and income situation is that – on the basis of statistical data – we have revealed the spatial inequalities among pensioners in Budapest. We found that the number of people aged 60 or over and their proportion in the districts of Budapest was significantly dispersed, the spatial pattern of their distribution was concentrated, and the individual territories can be clearly bordered geographically. For business purposes it is important that there is a significant correlation between income inequalities and spatial distribution. While the average amount of pensions was the highest in districts with a large number of elderly people, in the districts with a younger age structure, it did not reach the average in the capital.
T
HE
A
GE
S
TRUCTURE OF
P
OTENTIAL
B
UYERS IN THE
G
RAVITY
Z
ONES OF
B
UDAPEST
S
HOPPING
C
ENTRES
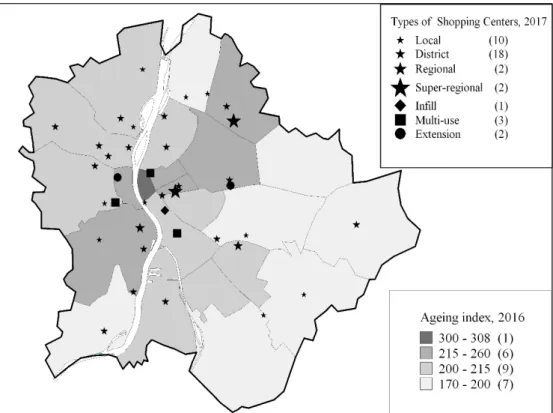
In the rest of the study, we examined the shopping centres in the capital according to what extent they are exposed to the aging processes in their gravity zone. In order to analyse the question, we examined the geographical location of each shopping centre, and also determined the types of shopping centres. The gravity zone of each centre differed somewhat (Figure 5).
Note: Ageing index: the ratio of the number of elderly persons (aged 65 and over) to the number of young persons (from 0 to 14). The data in brackets is the number of shopping centres and districts.
Source: own edition based on data from the Hungarian Council of Shopping Centres and COAEPS
The classification of the Budapest shopping centres is based on the Dawson classification, i.e. the size and functions of shopping malls (Sikos T. 2000). The main reason for choosing this method, besides its broad international acceptance, is its relative simplicity, which makes it possible to interpret each type of shopping centre in countries with a shopping culture different from the English and American ones (Sikos T. 2003).
In 2017, based on data provided by the Council of Hungarian Shopping Centres, 38 shopping malls were operating in Budapest. Of these, 28 of them belonged to the local or regional type. The location of the shopping centres showed a high concentration on the basis of a spatial pattern, even though in all districts except for Districts XX and XVI at least one shopping mall can be found. Most of the shopping centres are located in the inner parts of the city, and they only occur sporadically in the outer districts. There are significant differences between shopping centres based on the fact that only local or district type malls with a local gravity zone operate in the outer parts of the city. In the background of spatial distribution of shopping centres there are several site selection decisions which take many aspects into account.
Shopping centres can be further grouped and characterized by the age structure of potential buyers in their gravity zone. For the analysis we applied the ageing index, which expresses the ratio of the number of elderly persons (aged 65 and over) to the number of young persons (from 0 to 14), and these indices were further grouped into four categories.
Local shopping centres are suitable for serving 25,000– 40,000 inhabitants, their average size is between 3,000– 10,000 m2, and mainly basic consumer goods and services
can be obtained. District malls are similar to locals but larger in size and have a wider range of stores. Their average floor area is between 10,000 and 30,000 m2 and
they are designed to supply 40,000–150,000 customers (Sikos T. & Hoffmann 2004). These centres are only for serving a larger part of the city or district, so the age structure of their immediate environment is an important aspect in their case.
Local (10) and district (18) type shopping centres are the most common types in the capital. In districts with a younger age structure (group 4, ageing index 170–200%) only these two categories of shopping centres operate. These districts have the lowest business density and the narrowest range of available services and products. In the gravity zone of shopping malls in the south-east and eastern districts of Pest, the aging index does not exceed 200%. District IV in North Pest and District XXII in South Buda have similar characteristics.
Among districts falling into group 3 (200–215%), which belong to the less ageing parts of the city, some Buda districts (II, III, XII) with a higher ratio of elderly people appear, where mostly local and district type shopping centres with smaller gravity zones are located. In these districts, the number of elderly residents reaches the threshold that is sufficient in itself to operate a shopping
centre with a smaller gravity zone. That is why their business purposes should include attracting the “silver generation”. Typically, shopping centres with small floor space also include centres which were built to infill vacant sites. They are usually located in the city centres, in the traditional business districts, such as Dunaház in District IX.
Only a few of the shopping centres with a regional gravity zone can be found in the capital, mostly in the inner districts, typically in the busiest transport hubs of the city. They are well-positioned for transport, and their buyers are made up of inhabitants living in the outskirts in districts with a younger age structure, students commuting from the agglomeration and people belonging to the economically active populations. Thus, they are less exposed to the ageing processes than retail centres operating in the inner areas. Their common feature is that the range of goods and services offered by shopping centres with a regional gravity zone can be considered complete, and they have a floor area of 30,000–70,000 m2 (Sikos T. & Hoffmann
2004). KÖKI Terminal in District XIX falls into the regional type in district VIII Aréna Mall and Árkád to the superregional category. All three shopping centres are located at an important traffic hub, which determines the age structure of their customers.
Aréna Mall relies on the transit traffic of the Keleti Railway Station, and KÖKI Terminal on travellers of the M3 metro line and the bus terminal, with a high ratio of students and employees commuting from the districts in the outskirts. Árkád is located in an important traffic hub (metro, suburban train, bus terminal).
Árkád in District X and Mammut in District II belong to extension shopping centres, but their regional role is inevitable. These shopping centres get their potential buyers from the transit traffic of the M2 metro line. Mammut was built in the living area with the largest and most well-off elderly population in the capital. Its gravity zone is ageing, not only in any absolute sense, but its ageing index is also high.
Multi-use shopping centres in the capital are WestEnd City Centre, MOM Park and Lurdy Ház. The first two are located in the wider city centre or very close to it, and the ratio of elderly people in its gravity zone is remarkable. Lurdy Ház, on the other hand, can be found in a peripheral area that lacks purchasing power. Its direct environment is characterized by a youthful age structure, and the income situation of the elderly living there is very low, even in Budapest.
O
NLINE
S
HOPPING AMONG THE
E
LDERLY
V
ISITORS OF THE
S
HOPPING
C
ENTRES
Nowadays internet sales channels can no longer be ignored, as they are having a significant impact on shopping centres (BSIC 2017). In the shopping centres,
internet companies and parcel delivery points have been established, the amount of time visitors spend in the shopping centres has decreased, and for some product groups the magnitude of the income spent in physical stores is also decreasing (Yan 2018). At the same time, about 90% of sales still takes place offline worldwide (eMarketer 2018). There are big differences between the older generations and the younger people in the way and prevalence of using the Internet (NMHH 2017), which is obviously can be depicted in their online shopping habits.
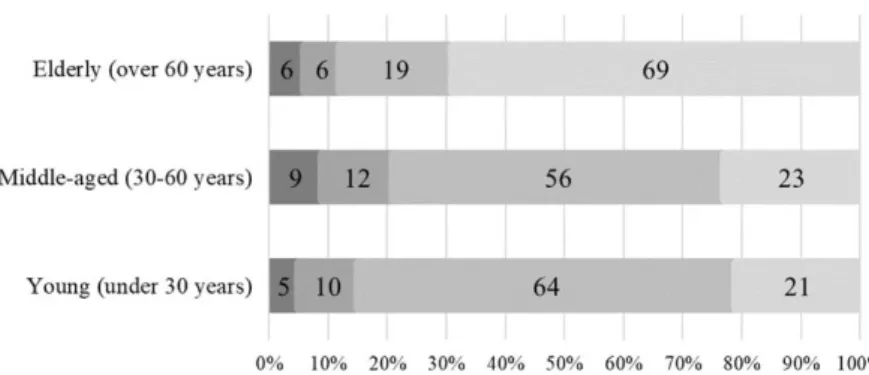
The prevalence of internet shopping (Figure 6) and the amount of average occasional spending were among the questions in the above-mentioned survey of visitors of the Árkád Budapest shopping centre.
The results of the questionnaire show that most people in each age group buy monthly or less frequently. At the same time, the majority of elderly people (69%) do not buy anything online, which is a remarkable difference compared to the other two age groups. However, it is important to add that if we examine only those respondents who use the Internet, then in terms of the frequency of shopping elderly people do not lag behind at all. Due to the low number of respondents in the sample it is not possible to draw a more precise conclusion. There is no significant difference between middle-aged and young visitors; both age groups buy on the Internet at a similar rate, although the middle-aged purchase online slightly more frequently than young people.
When looking at the purchase values, we found that young people typically spend less than HUF 10,000 – almost two-thirds of them have chosen this option among the answers. In the case of the elderly, the extreme values represent a high proportion of the total, as average purchases below HUF 5,000 forints and purchases above HUF 20,000 are also common among the respondents. In contrast to this, the distribution of average spending by category for the middle-aged is more balanced.
Results about the frequency of using pick-up points in the mall showed that they were used by only one in five respondents, monthly or less frequently at the time of the interview. Not surprisingly, young people (20%) and
middle-aged people (21%) are more likely to use these points than older people (14%). At the same time, we must note that if we examine only people who shop online, we see that approximately the same rate of young (25%) and middle-aged (27%) people said that they had used this service, but this ratio among elderly people is almost 50 percent (47%).
C
ONCLUSION
The study shows that the situation of shopping centres in Budapest greatly differ. While the ratio of the age group 14–29 in their gravity zone by districts is 12–18%, the ratio of people aged 60 or over is between 22–33%. Generally they attract a potential buyer group which reflects the age structure of the districts in the capital. In spite of these facts – unlike in rich welfare states – shopping centres in Budapest are important facilities for young people to spend their leisure time (not only because of the cinemas). Among local and district shopping centres, retail outlets operating in the Buda districts have more opportunities to open up for the “silver generation” than shopping malls located in the outer districts. The customer base of shopping centres with a larger gravity zone mainly consists of commuters and people on the move, thus the proportion of older people is smaller than in case of the previous types, since the elderly are less mobile than the younger generations. Due to their life stages and health status, they are less represented among commuters than other age groups. Despite this fact, the proportion of elderly customers in regional type shopping centres is increasing year-on-year too. For example, the proportion of customers aged 60 and over in the shopping centres Aréna Mall and Árkád Budapest was 4% and 7% in 2008, while in 2017 it was 14% and 29% (Sikos T. & Kovács 2018). The upward trend is apparent even if we take the different daily traffic periods into consideration and for the sake of a better comparability we adjust the results with approximation.
Source: own research 2017
On the basis of the statistical data used, it can be concluded that the “silver generation“ provides significant potential purchasing power for the retail sector, so shopping centres and online retailers should take them into
account. It is advisable to further investigate which products and services may be of interest to the “silver generation”, because satisfying these needs can generate additional turnover for shopping malls and e-tailers.
Acknowledgement
This research was supported by the project no. EFOP-3.6.2-16-2017-00007, titled Aspects on the development of intelligent, sustainable and inclusive society: social, technological, innovation networks in employment and digital economy. The project has been supported by the European Union, co-financed by the European Social Fund and the
budget of Hungary.
REFERENCES
ATSMON, Y.; MAGNI, M.; LI, L. & LIAO, W. (2012): Meet the 2020 Chinese Consumer McKinsey Consumer & Shopper Insights, Shanghai, China.
BSIC (2017): The Effects of E-Commerce on Shopping Malls and on the Consumer Retail Sector – a US Case Study. Retrieved: December 2018: http://www.bsic.it/wp-content/uploads/2017/10/ecommerce-sector-v.Final_.pdf
BURT, S. & GABBOTT, M. (1995): The elderly consumer and non-food purchase behaviour. European Journal of Marketing 29 (2): 43–57.
https://doi.org/10.1108/03090569510080941
C&W/H&B (2002): Shopping Centre Development. London: Cushman & Wakefield/Healey & Baker (EMEA)..
CSIZMADIA, S. & GYŐRI, S. R. (2014): Idősmarketing - kinek szól? [Old Age Marketing – Who is it for?] Valóság: Társadalomtudományi Közlöny 57 (3): 54–73.
CSIZMADIA, S.; GYŐRI, S. R. & KOVÁCS, N. (2014): Idősmarketing: a hazai idősek fogyasztási, vásárlási szokásai
[Old Age Marketing: consumption and buying habits of the elderly in Hungary]. Tér-Gazdaság-Ember 2 (1): 123– 151.
DUSEK, T. (2016): A gravitációs modell kalibrálásának alapkérdései (Basic questions of calibration of gravity model). Területi Statisztika 56 (4): 374–389. https://doi.org/10.15196/TS560402
eMARKETER (2018):Retail Ecommerce Sales Worldwide, 2016-2021. Retrieved: December 2018: https://www.emarketer.com/Chart/Retail-Ecommerce-Sales-Worldwide-2016-2021-trillions-change-of-total-retail-sales/215138
EUROSTAT (2018): Official website. Retrieved: October 2018: https://ec.europa.eu/eurostat
GOLDSTEIN, S. (1968): The Aged Segment of the Market, 1950 and 1960 Journal of Marketing 32 (2): 62–68.
GYŐRI, S. R.; CSIZMADIA, S. & KOVÁCS, N. (2015): Az idős fogyasztók és a tévéreklámok Magyarországon [Elderly
consumers and TV commercials in Hungary] Marketing és menedzsment 49 (3): 50–67.
HU, H. & JASPER, C. (2004): Men and women: a comparison of shopping mall behaviour Journal of Shopping Centre Research 11: 113–131.
KANG, Y. S. & RIDGWAY, N. M. (1996): The importance of consumer market interactions as a form of social support for elderly consumers. Journal of Public Policy and Marketing 15 (1): 108–117.
KINCSES, Á.; MICHALKÓ, G. & TÓTH, G. (2014): A Magyarország átutazó forgalmában érintett települések lehatárolása [Delimitation of settlements with transit traffic in Hungary] Területi Statisztika 54 (3): 237–252.
KOHLBACHER, F. & CHÉRON, E. (2012): Understanding “silver” consumers through cognitive age, health condition, financial status, and personal values: Empirical evidence from the world's most mature market Japan Journal of Consumer Behaviour 11 (3): 179–188. https://doi.org/10.1002/cb.382
KOLOS, K. (2010): Értékek, szerepek és életmód ötvenen túl [Values, roles and life style over the age of 50] Corvinus Marketing Tanulmányok 1: 29–38.
KOLOS, K.; KENESEI, Z. & SOMOSI, Á. (2014): Idősebb fogyasztók technológiai kompetenciáinak meghatározó
tényezői [Defining factors in technological competencies of older consumers] In: HETESI, E.–RÉVÉSZ, B. (eds.): Marketing megújulás: Marketing Oktatók Klubja 20. Konferenciája pp. 1–12, SZTE GTK, Szeged.
KONCZOSNÉ, SZ. M.; KOVÁCSNÉ, T. Á.; ZAKARIÁS, G.; BUDAHÁZI, J. & DUSEK, T. (2010): A generációs
marketing jelentősége egy felsőoktatási intézmény példáján [The importance of generation marketing – an example of a higher educational institute] In: PAPP- VÁRY, Á.–CSÉPE, A. (eds.): Új marketing világrend MOK 2010: a Magyar Marketing Szövetség Marketing Oktatók Klubja 16. országos konferenciája pp. 800– 811., Budapesti
Kommunikációs és Üzleti Főiskola, Budapest
KRAFT, S. (2016): Measuring and modelling the spatial accessibility of public transport stops in GIS Hungarian Geographical Bulletin 65 (1): 57–69. https://doi.org/ 10.15201/hungeobull.65.1.5
KSH [Hungarian Central Statistical Office] (2011): 2011-es népszámlálás hivatalos oldala [KSH census 2011]. Retrieved: March 2018: www.nepszamlalas2011.hu
KSH (2014): Szépkorúak és vének – október elseje, az idősek világnapja [Elderly and old – October 1, the day of the Elderly] Statisztikai Tükör 103: 1–2.
KSH (2015): Vén Európa–október elseje, az idősek világnapja [Old Europe – October 1, the day of the Elderly] Statisztikai Tükör 69: 1–3.
KSH (2016): Nyugdíjak és egyéb ellátások Budapest. [Pensions, benefits and other provisions] KSH (2018): Official website. Retrieved: March 2018: www.ksh.hu
KULCSÁR, L. J. & BROWN, D. R. (2017): Population Ageing in Eastern Europe: Toward a Coupled Micro-Macro Framework Regional Statistics 7 (1): 115–134.
https://doi.org/10.15196/RS07107
LIU, W.; LU, H.; SUN, Z. & LIU, J. (2017): Elderly’s Travel Patterns and Trends: The Empirical Analysis of Beijing. Sustainability 9 (6): 1–11.
https://doi.org/10.3390/su9060981
MONOSTORI, J. (2017): Stabilitás és változás az idősek háztartásszerkezetében [Stability and change in the household
structure of the elderly] Demográfia 60 (1):105–137. http://dx.doi.org/10.21543/Dem.60.1.3
MOYE, L. N. (1998): Relationship between age, store attributes, shopping orientations, and approach-avoidance behavior of elderly apparel consumers. Master Thesis, Virginia Polytechnic Institute and State University, Blacksburg, Virginia.
NMHH [National Media and Infocommunications Authority] (2017): Electronic Communication_Services Usage by Households and Individuals 2017. Retrieved: December2018:http://english.nmhh.hu/article/194914/Electronic_ Communication_Services_Usage_by_Households_and_Individuals_2017
PÓLYA, É. (2008): Családi vásárlási döntési folyamatok, a döntést befolyásoló tényezők [Family buying decision making
processes, and their influencing factors] Szolnoki Tudományos Közlemények 12 (Special Issue): 1–11. SIKOS T., T. (2000): Marketingföldrajz [Marketing Geography] VÁTI, Budapest.
SIKOS T., T. (2003): Bevásárlóközpontok mint kereskedelmi komplexumok a gazdasági térben. (Fogalmi meghatározások és tipizálás) [Shopping centers as retail complexes in the economic space] Földrajzi Értesítő 52 (1 -2): 85–105.
SIKOS T., T. & HOFFMANN, I.-NÉ (2004): Budapesti bevásárlóközpontok tipológiája [Typology of shopping centers
in Budapest] Földrajzi Értesítő 53 (1–2): 111–127.
SIKOS T., T. & KOVÁCS, CS. J. (2018): Az Aréna Pláza és az Árkád Budapest versenye az átalakuló társadalmi-gazdasági térben [The competition of Aréna Pláza and Árkád Budapest in the changing socio-economic space] Földrajzi Közlemények 142 (3): 201-218.
SMITH, T. J. (2008): Senior Citizens and E-commerce Websites: The Role of Perceived Usefulness, Perceived Ease of Use, and Web Site Usability. Informing Science: The International Journal of an Emerging Transdiscipline 11: 59– 83.
STÖVER, B. (2012): The power of elderly consumers – How demographic change affects the economy through private household demand in Germany In: RADVANSKÝ, M.– LICHNER, I. (eds.): Impacts of Ageing on Public Finances and Labour Markets in EU Regions - Theoretical Models and Empirical Analyses. Smolenice, Slovakia. pp. 141–149. STRAUSS, W. & HOWE, N. (1991): Generations: the history of America's future, 1584 to 2069. New York: Harper
Perennial
SZARKA, K.; LEHOTA, J. & LANGER, K. (2014): A magyar 50+ generáció fenntartható fogyasztási szokásai [Sustainable consumption habits of the Hungarian 50+ generation]. Élelmiszer, Táplálkozás és Marketing 10 (2): 3– 9.
TEIR [HLDIS] (2018): Official website. Retrieved: March 2018: www.teir.hu
TÖRŐCSIK, M. (2009): Generációs marketing [Generation marketing] In: BUGÁR, GY.–FARKAS, F. (eds.): Elkötelezettség és sokoldalúság Tanulmánykötet Barakonyi Károly tiszteletére, Pécs: PTE KTK. pp. 221– 228
TÖRŐCSIK, M.; KEHL, D. & SZŰCS, K. (2014): Generációs gondolkodás – A Z és az Y generáció életstílus csoportjai [Generational thinking – Lifestyle groups of generation Z and Y]. Marketing és Menedzsment 48 (2): 3–15.
YAN, X. (2018): Impact of Online Shopping on Shopping Malls. Masters thesis, Buffalo State College, State University of New York, USA.