Repeated Emergency Medical Services Utilization by Older Adults: Analysis of a Comprehensive Regional Database
By
Christopher S Evans
A Masters' Paper Submitted to the faculty of the University of North Carolina at Chapel Hill in partial fulfillment of the requirements for the degree of Master of
Public Health in the Public Health Leadership Program
Chapel Hill
TABLE OF CONTENTS
ABSTRACT………. 3
RESEARCH MANUSCRIPT INTRODUCTION………. 5
METHODS……… 6
RESULTS………. 8
DISCUSSION……… 10
CONCLUSION………. 13
TABLES/FIGURES……….. 14
APPENDIX 1- Missing Data……… 21
REFERENCES……….. 22
SYSTEMATIC REVIEW INTRODUCTION………. 26
METHODS……… 28
RESULTS………. 30
DISCUSSION……… 32
CONCLUSION………. 34
TABLES/FIGURES……….. 35
APPENDICES………..………. 42
STRUCTURED ABSTRACT
IMPORTANCE: Older adults disproportionately use emergency medical services (EMS) more
frequently and are often repeat users of emergency care when compared to younger patients.
Excess use of EMS by older adults reflects in part the greater burden of disease in this
population, but also suggests unmet medical needs and suboptimal care and comes with both
risks to the patient and financial costs. Little is known about repeat EMS use in older adults on a
population level.
OBJECTIVE: The objectives of this study were to estimate the frequency of repeat EMS
transport within 30 days among older adults and to identify potential predictors of repeat EMS
transports.
DESIGN: Retrospective Cohort
SETTING: 2010 Prehospital Medical Information System (PreMIS) dataset. PreMIS includes
all EMS encounters in North Carolina.
PARTICIPANTS: EMS transports by adults aged 65 years and older recorded as responses to
911 calls.
MEASURES/OUTCOMES: The primary outcome was repeat EMS transports within 30 days
linkages. Multivariable logistic regression was used to estimate odds ratios of repeat EMS use
adjusting for patient demographic and prehospital clinical characteristics.
RESULTS: In 2010, North Carolina PreMIS data included 244,557 unique 911 EMS transports
by 157,163 patients aged 65 years and older. During the study period, 24,209 (15.4%) patients
were found to have repeat EMS transports within 30 days. Compared to older adults without
repeat EMS transports, those with repeat transports had a similar mean age (79.5 +/- 8.4 years vs.
78.5 +/- 8.4 years), were more likely to be insured through Medicaid (19.1 vs. 11.7%) and more
likely to be black (23.4% vs. 19.7%, respectively). Transports from healthcare or residential
institutions were proportionally more likely to result in repeat EMS transport at 30 days
compared to transports from home (21% vs 15%). Multivariable analysis showed increased odds
of repeat EMS transport in males (OR 1.07 95% Confidence Interval (CI) 1.01-1.13), black
patients compared to white (OR 1.29 95% CI 1.19-1.41), and with specific dispatch complaints
including: breathing problems, cardiac problems, diabetic problems, and psychiatric problems.
CONCLUSIONS: Approximately one in seven older adults transported to North Carolina
hospitals had a repeat EMS transport within 30 days. Living in a healthcare or residential
institution and specific dispatch complaints were associated with repeat EMS use within 30 days.
Efforts to improve EMS care and reduce costs may benefit from interventions targeted to these
INTRODUCTION:
Repeated or frequent utilization of a specific healthcare service by a small group of
patients has the potential to not only be very costly,1,2 but also suggests that the care those patients are receiving is not addressing their needs in some way.3,4 Frequent utilization of emergency department (ED) services have been extensively studied, 5–13 due in part to the fact that frequent ED users have been shown to use other healthcare services at a higher frequency.14 Among ED patients, an estimated 15-25% arrive by ambulance.15,16 Despite the substantial number of ED patients who are arriving by ambulance, and despite the close interface of
emergency medical service (EMS) and emergency department care, much less is known about
the frequent use of EMS or ambulance services. Furthermore, it is unclear what similarities are
present between patients who frequently use emergency departments and EMS, making
interventions aimed at reducing frequent use challenging. 3,4,17
An additional consideration in understanding repeat EMS use is the presence of distinct
sub-populations including the elderly. Adults aged 65 years and older have been shown to
disproportionally use ED and EMS compared to younger patients,18–20 and are expected to comprise 20% of the total US population by 2030.21 Previous studies of repeat EMS use in older adults have been limited to specific conditions such as falls,22,23 populations living in rural,24 or discrete urban areas,25 or those receiving care from a single ED.26 However, little is known about characteristics associated with repeat EMS use in older adults on a population level.
The objective of this study was to assess the proportion of older adults aged 65 years and
older who require repeat transport to the hospital within 30 days of a prior transport. To
population, we leveraged a unique comprehensive database which includes all EMS transports in
the state of North Carolina.
METHODS:
Study Design and Setting
This study was a retrospective cohort study using EMS data and was deemed to be
exempt for review by the Institutional Review Board (IRB) of the University of North Carolina
at Chapel Hill. North Carolina EMS encounters were analyzed using the 2010 North Carolina
Prehospital Medical Information Systems (PreMIS) collected by the EMS performance
improvement center (EMSPIC). PreMIS data collection is state-mandated and collects 200 data
elements on all EMS calls from North Carolina, South Carolina, and West Virginia. In North
Carolina over 700 EMS agencies use PreMIS to collect data on an estimated one million EMS
calls annually.27
Inclusion criteria were EMS encounters recorded as responses to 911 calls for adults 65
years and older that resulted in transport to a North Carolina hospital. EMS encounters without a
visit time recorded or dispatch complaints including “Transfer/Interfacility/Palliative Care,” or
“Pregnancy/Childbirth” were excluded.
Repeat EMS Use Definition
The primary outcome was repeat EMS transport within 30 days. Secondary outcomes
included repeat EMS transport within 7 days, 90 days, 6 months, at any point during the 2010
Outcomes were assessed using a unique patient identifier generated by EMSPIC using a
matching algorithm to link EMS transports that were likely to be for the same patient over time.
EMS transports with at least two of the following elements in common were assumed to be for
the same patient: patient full name, date of birth, and social security number. EMPIC staff
provided a de-identified dataset for analysis. In cases where multiple EMS units arrived on scene
for the same EMS encounter (as defined as identical patient identifier with identical incident date
and time), the EMS record with the most complete set of data elements was used for analysis. To
be considered a unique EMS encounter, at least two hours must have elapsed since the prior
EMS transport to be considered a repeat transport.
Measures
Patient demographics examined included age, sex, race/ethnicity (white, black,
latino/hispanic, asian, and other), and expected payment source (private insurance, Medicare,
Medicaid, and other). EMS incident characteristics examined included Centers for Medicare
Services (CMS) service level (ALS, BLS, and Air/Specialty), Incident location (home,
healthcare or residential institution, street or highway, and other) and dispatch complaint.
Dispatch complaints were grouped into the following twenty categories: abdominal pain,
allergies, back pain, breathing problem, cardiac problem, cardiac arrest, choking,
convulsions/seizures, diabetic problem, eye problem, exposure, falls, headache, psychiatric
problem, sick person, stroke, traffic accident, and other trauma, unconscious/fainting, and
unknown man down.
Data Analysis
Descriptive summary statistics including patient level and incident level summary
sex, race/ethnicity, and expected payment source. For patients with multiple EMS encounters,
the encounter with the most complete data reported for sex, race/ethnicity, and expected payment
source regarding demographics was used. The remainder of summary statistics were summarized
on an incident-level data. Age was reported as mean and standard deviations. Categorical
variables were reported using frequencies and proportions. Bivariate analysis was performed
between potential predictors of repeated EMS transport using student’s t-test and pearsons’ chi
squared, for continuous and categorical variables respectively.
A multivariable logistic regression model was used to calculate adjusted odds ratios and
95% confidence intervals of repeat EMS transport within 30 days of transport. Potential
predictors of repeat EMS transport included in the model were age, sex, expected payment
source, CMS level, incident location, and presence or absence of dispatch complaint groupings.
To account for potential non-independence in observations, the multivariable model also
included clustering by county. A receiver operating curve (ROC) with ten-fold internal
cross-validation was calculated using the logistic regression model after removing collinear variables
as defined by r>0.3, as well as excluding variables with a p>0.1. Statistical significance was set
at p<0.05. Analysis was performed using STATA version 14 (StataCorp., College Station, TX).
RESULTS:
Among 567,373 EMS encounters by older adults aged 65 years and older in North
Carolina, 245,740 (43%) met inclusion criteria for being a 911 response resulting in an EMS
transport to a hospital. (Figure 1) After removal of duplicate records, the study sample comprised
244,557 EMS transports by 157,163 older adults. Overall, older adults during the study period
characteristics of the study sample. The mean age of patients was 78.6 +/- 8 years, and 96,610
(62%) were female. Three quarters of patient were white, and 60% had Medicare recorded as the
expected payment source. Over half of all EMS transports were for patients at home (61%), and
the three most common dispatch complaints were sick person, breathing problem, and fall victim
(23%, 17%, and 16%, respectively).
Among 157,163 older adults requiring EMS transport to the hospital, 24,209 (15.4%) had
a repeat EMS transport within 30 days (Table 2). The proportion of older adults with repeat
transports within 7 days to 6 months ranged from 8.0-26.3%. The proportion of patients with five
or more EMS transports in a calendar year was 29.1%. Table 3 lists proportions of EMS
transports that resulted in repeat transport at 30 days by patient and clinical characteristics and
allows for comparison to the overall proportion transports with subsequent repeat transport of
15.4%. When compared to transports that did not have repeat transport at 30 days, repeat
transports were proportionally more likely to be among black older adults (26% vs. 21%,
respectively), Medicaid patients (23% vs. 14%, respectively), and occur in healthcare/residential
institutions (39% vs. 30%, respectively). Breathing problems were recorded for dispatch
complaints in 6,602 of 39,700 (20%) transports associated with repeat transport, and only 16% in
non-repeat transports. When transports were assessed using an alternate definition of frequent
EMS utilization as defined as five or more transports in a the calendar year, similar distributions
across covariates were seen as in repeat transports within 30 days. (Table 4)
On multivariable logistic regression, men were found to have 1.07 time the odds of
having repeat transports (OR 1.07 95% CI 1.01-1.13), after adjusting for age, race/ethnicity,
payment source, CMS service level, incident location, and dispatch complaint (Table 5). When
associated with repeat transport (OR 1.29 95% CI 1.19-1.41, and OR 1.28 95% CI 1.13-1.44,
respectively). Transports among Medicaid patients were nearly 60% more likely to have repeat
transport when compared to privately insured patients (OR 1.59 95% CI 1.44-1.74). When
compared to transports from home, incident location showed a differential association with
repeat transport. EMS transports from a healthcare or residential institution was associated with
1.29 times the odds of repeat transports (OR 1.29 95% CI 1.19-1.40), while street/highway and
other location were both associated with decreased odds (OR 0.51 95%CI 0.39-0.67, and OR
0.56 95%CI 0.45-0.69, respectively). The following dispatch complaints were associated with
increased odds of repeat transport and statistically significant: sick person, breathing problem,
cardiac, abdominal pain, diabetic problem, back pain, psychiatric problem, and headache. Traffic
accident and cardiac arrest were associated with decreased odds of repeat transport.
Figure 2 shows the final predictive model using a receiver operating curve (ROC). The
area under the curve (AUC) was 0.611 and after a 10 fold internal cross-validation, the AUC was
found to be 0.603 (95% CI 0.598-0.607). Missing data on the variables analyzed are summarized
in Appendix 1.
DISCUSSION:
Our study found that among North Carolinian older adults who are transported to the
hospital, 15% require repeat EMS transport within 30 days. Nearly a third (29%) of older adults
had a repeat EMS transport within the study period. This finding is consistent with work by
Weiss et al. where 23% of older adults had repeat EMS transport to a single academic ED during
Contrary to prior research,18 our study did not find an association between repeat EMS transport and age within the older adult population. Our findings that black older adults, and
those insured through Medicaid had higher odds of repeat transport are consistent with other
studies.29 Similar to previous studies, we found repeat EMS transports and all EMS transports by older adults were more common in women.30 However, the relationship between sex and repeat EMS transport in our study is unclear. On bivariate analysis, the same proportion of visits by
men and women resulted in repeat transport, but on multivariable modeling men were more
likely than women to have repeat transports. The finding that 21% of transports from healthcare
or residential institutions resulted in repeat transports, as well as a statistically increased odds of
repeat transport on multivariable regression, highlights the differing utilization of EMS by
community dwelling versus institution dwelling older adults. However, our data are not able to
account for important characteristics such as comorbidity and functional status that may
confound the relationship in older adults living in different environments.
Repeat EMS transports were also associated with several dispatch complaints. Although
not associated with increased adjusted odds of repeat transport in our study, the finding that 16%
of fall-related transports resulted in another transport within 30 days, suggest two things. First,
falls in older adults often prompt repeat EMS evaluation and transport to the hospital as has been
shown by Simpson et al.22 and Tiedemann et al.23 Furthermore, it suggests that falls are one of several reasons for repeat EMS transports, with some dispatch complaints, such as breathing,
psychiatric, and diabetic problems having stronger association with repeat transports within 30
days.
EMS transport within 30 days, but also assessed frequent users as defined by five or more EMS
transports in a calendar year. However, in using two different definitions, we found similar
distributions of patient and clinical characteristics.
It is also important to note that this study did not attempt to determine the appropriateness
of an EMS transport, but rather assessed on a population level the types of patients who are
repeatedly transported. It is likely that some of the characteristics, and particularly some dispatch
complaints that were identified as being associated with repeat EMS transport are more
amenable to targeted EMS based interventions to improve the care of older adults. Future studies
are needed to better understand how to best use findings from large prehospital data such as
PreMIS to better inform how to target interventions such as home assessments and intensive case
management including primary care referrals.
This study has several limitations that must be considered. Similar to many EMS data
sources, there was considerable missing data in PreMIS, which threatens the internal validity of
our analysis. Furthermore, this study is heavily reliant on dispatch complaints which may be
overly general compared to more precise diagnosis categories as recorded in emergency
department or inpatient data sources. However, dispatch complaints were more consistently
recorded compared to chief complaint and provider impression in PreMIS, and although its use
encompasses broad categories, analysis of dispatch complaint provides an informative
perspective from the prehospital dispatch perspective. We did not have information of who lives
at home with the community dwelling older adults in our study, nor did we have a way of
assessing how access to transportation or primary care influenced repeat transport. The 2010
PreMIS data did not include information about alcohol or substance abuse, which has been
prehospital datasets also likely contributed to the poor predictive ability as measured in our
receiver operating curve. Additionally, there is potential for missing repeat transports due to
errors in the matching algorithm which used date of birth, social security number, and full name.
However, to verify the accuracy of the matching algorithm, a random sample of transports
deemed to be the same patient were reviewed manually, and were found to be in agreement.
This study has several strengths. The use of PreMIS data allowed for statewide
population based analysis of all older adults who were transported to the hospital regardless of
which hospital in which they were transported. Our findings’ generalizability is also improved by
including older adults who lived in rural and urban counties that are cared for by hundreds of
EMS agencies. Furthermore, our findings concerning the overall frequencies of repeat EMS use
across two different definitions are in agreement with other work that has been described in
smaller populations of older adults, but with varied data sources.
CONCLUSION:
During the 2010 calendar year, greater than one in seven older adults who were
transported to North Carolina hospitals had repeat EMS transports within 30 days. Those
transported repeatedly had a diverse set of dispatch complaints, and were disproportionately by
older adults living in a healthcare or residential institutions. Efforts aimed at improving outcomes
and reducing costs associated with repeat EMS utilization must consider the varied clinical and
!
Figure'1.!Flow!diagram!of!emergency!medical!services!(EMS)!transports!to!an!emergency! department!for!patients!aged!65!years!and!older!for!calendar!year!2010,!North!Carolina.!! !
! ! ! ! ! ! ! ! ! ! ! ! ! ! ! ! ! ! ! !
a!EMS!transports!not!initiated!by!a!911!call!include!interfacility!transports!and!transports!for!
scheduled!medical!care.! !
! ! ! !
Assessed for Eligibility (n=567,373 EMS transports)
Ineligible (n=311,287)
• Not a 911 responsea (n=221,602) • Missing visit date (n=89)
• Non-transport dispositionb (n= 60,825) • Not transported to hospital (n= 28,711)
• Transfer/Interfacility/Palliative Care Dispatch Complaint (n=10,336) • Pregnency-related dispatch complaint (n=10)
Duplicate Records
• Duplicate records for same EMS transports (n=1,183)
Eligible (n=245,740)
Study Sample
A) Patient!level!demographics.!! B) Incident!level!characteristics.!Individual!patients!may!be!counted!multiple!times.!! ! ! ! !
Table 1. Characteristics of emergency medical services (EMS) transports by adults aged 65
years and older in North Carolina, calendar year 2010 (n= 244,557 transports by 157,163
patients)
Age, year (Mean, SD)A 78.6 (8)
Female (n, %)A 96,610 (62)
Race/Ethnicity (n, %)A
White 111,321 (75)
Black 29,757 (20)
Latino/Hispanic 1,593 (1)
Asian 4,513 (3)
Other 1,928 (1)
Expected Payment (n, %)A
Private Insurance 13,557 (18)
Medicaid 9,202 (12)
Medicare 43,969 (59)
Other 8,112 (11)
CMS Service Level (n, %)B
ALS 119,224 (78)
BLS 33,054 (22)
Other (Air/Specialty) 306 (<1)
Incident Location (n, %)B
Home 134,345 (61)
Healthcare/Residential Institution 68,513 (31)
Street/Highway 4,970 (2)
Other 11,334 (5)
Dispatch Complaint (n, %)B
Sick Person 45,346 (23)
Breathing Problem 32,958 (17)
Fall Victim 32,422 (16)
Cardiac 25,866 (13)
Unconscious/Fainting 12,923 (7)
Stroke/CVA 9,709 (5)
Trauma (not falls/MVCs) 9,094 (5)
Abdominal Pain 6,296 (3)
Unknown Problem Man Down 4,720 (2)
Diabetic Problem 4,576 (2)
Traffic Accident 3,620 (1)
Back Pain 2,643 (1)
Convulsions/Seizure 2,418 (1)
Cardiac Arrest 1,874 (0.9)
Psychiatric Problem 1,420 (0.7)
Headache 1,147 (0.6)
Allergies 668 (0.3)
Exposure 607 (0.3)
Choking 503 (0.3)
Table 2. Number of transports with repeat or frequent transports. (n=244,557 transports by 157,163 patients)
Primary Definition n %
Repeat within 30 days 24,209 (15.4)
Secondary Definition
Repeat within 7 days 19,477 (8.0)
Repeat within 90 days 35,101 (22.3)
Repeat within 6 months 41,390 (26.3)
Repeat at any point in dataset 45,418 (28.9)
Number of visits by patients with five or more transports
during calendar year 45,746 (29.1)
!
Table 3. Proportion of EMS transports that resulted in repeat or by patients with frequent EMS transports
Age, (mean, SD) 78.9 (8.4)
Male (%) 16
Female (%) 16
Race/Ethnicity (%)
White 16
Black 19
Latino/Hispanic 13
Asian 15
Other 21
Expected Payment (%)
Insurance 17
Medicaid 26
Medicare 17
Other 14
CMS Service Level (%)
ALS 17
BLS 19
Other (Air/Specialty) 7
Incident Location (%)
Home 15!
Healthcare/Residential Institution 21
Street/Highway 5
Other 9
Dispatch Complaint (%)
Sick!Person 17
Breathing!Problem 20
Falls 16
Cardiac 5
Unconscious/Fainting 13
Stroke/CVA 13
Trauma(Other)A 16
Abdominal!Pain 18
Unknown!Problem!Man!Down 18
Diabetic!Problem 19
MVC 4
Back!Pain 18
Convulsions/Seizure 16
Cardiac!Arrest 5
Psychiatric!Problem 20
Headache 19
Allergies 12
Exposure 13
Choking 14
Eye!Problem 22
A) Trauma other includes: animal bite, assault, burns, electrocution, hemorrhage/laceration, and multi-casualty incident
Table 4: Incident-level characteristics of repeat EMS transports by adults aged 65 years and older. Incident level proportions. Individual patients are counted multiple times.
EMS transports with repeat transport in 30 days
EMS Transports stratified by number of EMS transports in 2010 calendar year Yes (n= 39,700) No (n=204,857) >=5 transports (n=92,323) <5 transports (n=152,234)
Age (mean, SD), years 79.0 (8.4) 78.9 (8.4) 79.2 (8.4) 78.6 (8.4)
Female, n(%) 24771 (62.57) 127,533 (62.5) 58,944 (63.99) 93,360 (61.61)
Race/Ethnicity, n(%)
White 26275 (69.12) 142,697 (73.74) 61,902 (70.16) 107,070 (74.7)
Black 9758 (25.67) 40,653 (21) 22,171 (25.13) 28,240 (19.71)
Latino/Hispanic 290 (0.77) 1,940 (1.02) 680 (0.77) 1,550 (1.1)
Asian 1002 (2.64) 5,558 (2.8) 1,946 (2.21) 4,614 (3.22)
Other 689 (1.81) 2,657 (1.37) 1,528 (1.73) 1,818 (1.27)
Expected Payment, n(%)
Insurance 2967.0 (14.81) 16,447 (17.55) 7,022 (15.13) 12,392 (18.39)
Medicaid 4653 (23.22) 13,406 (14.3) 10,306 (22.21) 7,753 (11.51)
Medicare 10891 (54.35) 54,618 (58.27) 25,878 (55.77) 39,631 (58.83)
Other 1529 (7.63) 9,261 (9.88) 3,196 (6.89) 7,594 (11.27)
CMS Service Level, n(%)
ALS 19827 (76.34) 99,397 (78.51) 46,024 (76.54) 73,200 (79.17)
BLS 6123 (23.58) 26,931 (21.27) 14,029 (23.3) 19,025 (20.58)
Other (Air/Specialty) 22 (0.08) 284 (0.22) 75 (0.12) 231 (0.25)
Incident Location, n(%)
Health/Res Institution 14125 (39.17) 54,388 (29.7) 34,888 (41.75) 33,625 (24.8)
Home 20689 (57.38) 113,656 (62.07) 45,775 (54.78) 88,570 (65.32)
Street/Highway 268 (0.74) 4,702 (2.57) 618 (0.74) 4,352 (3.21)
Other 977 (2.71) 10,357 (5.66) 2,279 (2.73) 9,055 (6.68)
Dispatch Complaint, n(%)
Sick Person 7814 (23.82) 37,532 (22.6) 18,594 (24.56) 26,752 (21.72)
Breathing Problem 6602 (20.13) 26,356 (15.87) 14,942 (19.73) 18,016 (14.62)
Fall 5306 (16.17) 27,116 (16.32) 11,214 (14.81) 21,208 (17.22)
Cardiac 4031 (12.29) 21,835 (13.15) 9,098 (12.02) 16,768 (13.61)
Unconscious/Fainting 1668 (5.08) 11,255 (6.78) 4,535 (5.99) 8,388 (6.81)
Stroke/CVA 1227 (3.74) 8,482 (5.11) 2,854 (3.77) 6,855 (5.56)
Trauma (Other)A 1462 (4.46) 7,632 (4.59) 3,338 (4.41) 5,756 (4.67)
Abdominal Pain 1117 (3.41) 5,179 (3.12) 2,574 (3.4) 3,722 (3.02)
Unknown Problem Man Down 841 (2.56) 3,879 (2.34) 1,957 (2.58) 2,763 (2.24)
Diabetic Problem 862 (2.63) 3,714 (2.24) 1,937 (2.56) 2,639 (2.14)
Traffic Accident 139 (0.42) 3,481 (2.1) 304 (0.4) 3,316 (2.69)
Back Pain 487 (1.48) 2,156 (1.3) 901 (1.19) 1,742 (1.41)
Convulsions/Seizure 395 (1.2) 2,023 (1.22) 1,152 (1.52) 1,266 (1.03)
Cardiac Arrest 102 (0.31) 1,772 (1.07) 594 (0.78) 1,280 (1.04)
Psychiatric Problem 279 (0.85) 1,141 (0.69) 666 (0.88) 754 (0.59)
Headache 222 (0.68) 925 (0.56) 458 (0.6) 689 (0.56)
Allergies 78 (0.24) 590 (0.36) 187 (0.25) 481 (0.39)
Exposure 80 (0.24) 527 (0.32) 182 (0.24) 425 (0.34)
Choking 70 (0.21) 433 (0.26) 192 (0.25) 311 (0.25)
A) Each dispatch complaint is a discrete variable in the model. The referent group for each complaint are patients without the dispatch complaint.
B) Trauma other includes: animal bite, assault, burns, electrocution, hemorrhage/laceration, and multi-casualty incident !
Table 5. Adjustedodds ratios for repeat EMS transports within 30 daysin North Carolina in calendar year 2010. (n=244,557 EMS transports). Odds ratios are generated from single logistic regression model; all odds ratios are adjusted for all other variables reported and clustering by county.
OR 95% CI P Value
Male 1.07 (1.01-1.13) 0.025
Age (years) 1.00 (0.99-1.00) 0.524
Race/Ethnicity
White Reference
Black 1.29 (1.19-1.41) <0.001
Latino/Hispanic 0.81 (0.67-0.99) 0.037
Asian 0.98 (0.90-1.06)
(1.13-1.44)
0.591
Other 1.28 <0.001
Payment Source
Private Insurance Reference
Medicaid 1.59 (1.44-1.74) <0.001
Medicare 1.07 (0.99-1.15) 0.092
Other 0.88 (0.72-1.07) 0.205
CMS Service Level
ALS Reference
BLS 1.11 (1.01-1.22) 0.030
Other 1.38 (0.42-4.51) 0.596
Incident Location
Home Reference
Health/Residential Inst. 1.29 (1.19-1.40) <0.001
Street/Highway 0.51 (0.39-0.67) <0.001
Other 0.56 (0.45-0.69) <0.001
Dispatch ComplaintA
Sick Person 1.22 (1.05-1.41) 0.008
Breathing problems 1.53 (1.30-1.79) <0.001
Falls 1.13 (0.98-1.32) 0.100
Cardiac 1.18 (1.00-1.38) 0.047
Unconscious/Fainting 0.86 (0.73-1.02) 0.083
Stroke/CVA 0.90 (0.76-1.07) 0.235
Trauma (Other) B 1.15 (0.97-1.35) 0.102
Abdominal pain 1.26 (1.08-1.48) 0.004
Unknown mandown 1.18 (0.95-1.46) 0.126
Diabetic problem 1.40 (1.14-1.70) 0.001
Traffic Accident 0.44 (0.30-0.64) <0.001
Back pain 1.33 (1.10-1.61) 0.004
Seizure 1.03 (0.81-1.31) 0.818
Cardiac Arrest 0.31 (0.19-0.51) <0.001
Psychiatric Problem 1.41 (1.07-1.86) 0.016
Headache 1.46 (1.05-2.03) 0.026
Allergies 0.74 (0.51-1.07) 0.106
Exposure 1.14 (0.80-1.64) 0.462
Choking 0.89 (0.59-1.34) 0.579
! !
Figure'2.!Receiver!Operator!Curve!
! AUC:!0.611!
Number!of!Observations:!78,970!
Internal!Cross!Validated!AUC:!0.6093!(95%!CI!0.604]0.614)!
*Variables!included!in!the!model!final!model!(after!removing!collinear!variables!and!those!from!table!3! with!P!value!>0.10):!logistic!rep30d!sex!i.race!i.pay1!i.cmslevel!i.inc_loc_type!abdpain!backp!
breathing_prob!card_arrest_dis!diabetes!headache!psych!sick_per!fainting!unknown_mandown!cardiac! falls!mvc!
! ! !
Appendix 1. Missing Data, North Carolina EMS transports by adults aged 65 and older, Calendar year 2010. (n= 244,557)
Variable Missing (% )
Age 0 (0.0)
Sex 905 (0.4)
Race/Ethnicity 13,038 (5.3)
Expected Payment 130,783 (53.5)
CMS Level 91,972 (37.6)
Incident location type 25,389 (10.4)
Disposition 0 (0.0)
Destination type 0 (0.0)
Dispatch complaint 45,645 (18.7)
Card arrest 71,718 (28.2)
County incident 16 (0.0)
References:
1. Solberg RG, Edwards BL, Chidester JP, Perina DG, Brady WJ, Williams MD. The prehospital and hospital costs of emergency care for frequent ED patients. Am J Emerg Med. 2015;34(3):459-463. doi:10.1016/j.ajem.2015.11.066.
2. Hasegawa K, Tsugawa Y, Camargo CA, Brown DFM. Frequent utilization of the emergency department for acute heart failure syndrome: A population-based study. Circ Cardiovasc Qual Outcomes. 2014;7(5):735-742.
doi:10.1161/CIRCOUTCOMES.114.000949.
3. Pines JM, Asplin BR, Kaji AH, et al. Frequent users of emergency department services: Gaps in knowledge and a proposed research agenda. Acad Emerg Med. 2011;18(6):64-69. doi:10.1111/j.1553-2712.2011.01086.x.
4. LaCalle E, Rabin E. Frequent Users of Emergency Departments: The Myths, the Data, and the Policy Implications. Ann Emerg Med. 2010;56(1):42-48.
doi:10.1016/j.annemergmed.2010.01.032.
5. Althaus F, Paroz S, Hugli O, et al. Effectiveness of interventions targeting frequent users of emergency departments: a systematic review. Ann Emerg Med. 2011;58(1):41-52.e42. doi:10.1016/j.annemergmed.2011.03.007.
6. Althaus F, Stucki S, Guyot S, et al. Characteristics of highly frequent users of a Swiss academic emergency department: a retrospective consecutive case series. Eur J Emerg Med. 2013;20(6):413-419. doi:10.1097/MEJ.0b013e32835e078e.
7. Bieler G, Paroz S, Faouzi M, et al. Social and medical vulnerability factors of emergency department frequent users in a universal health insurance system. Acad Emerg Med. 2012;19(1):63-68.
http://www.embase.com/search/results?subaction=viewrecord&from=export&id=L51803 748.
8. Steiner C, Barrett M HK. Hospital Readmissions and Multiple Emergency Department Visits, in Selected States, 2006-2007: Statistical Brief #90. Healthc Cost Util Proj Stat Briefs [Internet] Rockv Agency Heal Care Policy Res (US) Feb 2006. 2010:1-10. 9. Sun BC, Burstin HR, Brennan TA. Predictors and outcomes of frequent emergency
department users. Acad Emerg Med. 2003;10(4):320-328. doi:10.1197/aemj.10.4.320. 10. Hunt KA, Weber EJ, Showstack JA, Colby DC, Callaham ML. Characteristics of Frequent
Users of Emergency Departments. Ann Emerg Med. 2006;48(1):1-8. doi:10.1016/j.annemergmed.2005.12.030.
11. Ruger JP, Richter CJ, Spitznagel EL, Lewis LM. Analysis of costs, length of stay, and utilization of emergency department services by frequent users: Implications for health policy. Acad Emerg Med. 2004;11(12):1311-1317. doi:10.1197/j.aem.2004.07.008. 12. Billings J, Raven MC. Dispelling an urban legend: frequent emergency department users
have substantial burden of disease. Health Aff (Millwood). 2013;32(12):2099-2108. doi:10.1377/hlthaff.2012.1276.
13. Uscher-Pines L, Pines J, Kellermann A, Gillen E, Mehrotra A. Emergency department visits for nonurgent conditions: systematic literature review. Am J Manag Care. 2013;19(1):47-59.
14. Hansagi H, Olsson M, Sjöberg S, Tomson Y, Göransson S. Frequent use of the hospital emergency department is indicative of high use of other health care services. Ann Emerg Med. 2001;37(6):561-567. doi:10.1067/mem.2001.111762.
Department Analyzed. ACEP Now. 2016:1-4.
http://www.acepnow.com/article/emergency-medical-services-arrivals-admission-rates-emergency-department-analyzed/?singlepage=1&theme=print-friendly.
16. Burt CW, McCaig LF, Valverde RH. Analysis of ambulance transports and diversions among US emergency departments. Ann Emerg Med. 2006;47(4):317-326.
doi:10.1016/j.annemergmed.2005.12.001.
17. Doran KM, Colucci AC, Wall SP, et al. Reasons for emergency department use: do frequent users differ? Am J Manag Care. 2014;20(11):e506-e514.
http://www.ncbi.nlm.nih.gov/pubmed/25730349.
18. Svenson JE. Patterns of use of emergency medical transport: A population-based study.
Am J Emerg Med. 2000;18(2):130-134. doi:10.1016/S0735-6757(00)90002-0.
19. Clark MJ, FitzGerald G. Older people’s use of ambulance services: a population based analysis. J Accid Emerg Med. 1999;16(2):108-111. doi:10.1136/emj.16.2.108.
20. Platts-Mills TF, Leacock B, Cabañas JG, Shofer FS, McLean S a. Emergency medical services use by the elderly: analysis of a statewide database. Prehosp Emerg Care. 2010;14(3):329-333. doi:10.3109/10903127.2010.481759.
21. Ortman BJM, Velkoff V a., Hogan H. An aging nation: The older population in the United States. Curr Popul Reports, US Census Bur Washingt DC. 2014;1964:1-28. census.gov. 22. Simpson PM, Bendall JC, Tiedemann A, Lord SR, Close JCT. Epidemiology of
Emergency Medical Service Responses to Older People Who Have Fallen: A Prospective Cohort Study. Prehospital Emerg Care. 2014;18(2):185-194.
doi:10.3109/10903127.2013.856504.
23. Tiedemann A, Mikolaizak AS, Sherrington C, Segin K, Lord SR, Close JC. Older fallers attended to by an ambulance but not transported to hospital: a vulnerable population at high risk of future falls. Aust N Z J Public Health. 2013;37(2):179-185.
http://www.embase.com/search/results?subaction=viewrecord&from=export&id=L56301 3838.
24. Shah MN, Swanson P, Rajasekaran K, Dozier a. Repeat emergency medical services use by older adults in a rural community: impact on research methods and study length.
Prehosp Emerg Care. 2009;13(2):173-178. doi:10.1080/10903120802706211. 25. Knowlton A, Weir BW, Hughes BS, et al. Patient Demographic and Health Factors
Associated With Frequent Use of Emergency Medical Services in a Midsized City Factores Sanitarios y Demográficos del Paciente Asociados con el Uso Frecuente de los Servicios Médicos de Emergencias... Acad Emerg Med. 2013;20(11):1101-1111 11p. https://auth.lib.unc.edu/ezproxy_auth.php?url=http://search.ebscohost.com/login.aspx?dire ct=true&db=rzh&AN=104158049&site=ehost-live&scope=site.
26. Weiss SJ, Ernst AA, Miller P, Russell S. Repeat EMS transports among elderly emergency department patients. Prehosp Emerg Care. 2001;6(1):6-10.
27. EMSPIC. About EMSPIC. https://www.emspic.org/about. Accessed June 7, 2016. 28. Weiss SJ, Ernst AA, Miller P, Russell S. Repeat EMS transports among elderly
emergency department patients. Prehospital Emerg Care. 2002;6(1):6-10.
http://www.embase.com/search/results?subaction=viewrecord&from=export&id=L34041 905.
29. Scott J, Strickland AP, Warner K, Dawson P. Frequent callers to and users of emergency medical systems: a systematic review. Emerg Med J. 2014;31(8):684-691.
30. Shah MN, Glushak C, Karrison TG, et al. Predictors of emergency medical services utilization by elders. Acad Emerg Med. 2003;10:52-58.
31. Wofford JL, Moran WP, Heuser MD, Schwartz E, Velez R, Mittelmark MB. Emergency medical transport of the elderly: a population-based study. Am J Emerg Med.
1995;13:297-300. doi:10.1016/0735-6757(95)90203-1.
32. Hall MK, Raven MC, Hall J, et al. EMS-STARS: Emergency Medical Services
“Superuser” Transport Associations: An Adult Retrospective Study. Prehospital Emerg Care. 2015;19(1):61-67 7p.
https://auth.lib.unc.edu/ezproxy_auth.php?url=http://search.ebscohost.com/login.aspx?dire ct=true&db=rzh&AN=103924435&site=ehost-live&scope=site.
33. Tadros AS, Castillo EM, Chan TC, et al. Effects of an emergency medical services-based resource access program on frequent users of health services. Prehospital Emerg care Off J Natl Assoc EMS Physicians Natl Assoc State EMS Dir. 2012;16(4):541-547.
doi:10.3109/10903127.2012.689927.
34. Scott J, Strickland AP, Warner K, Dawson P. Frequent callers to and users of emergency medical systems: A systematic review. Emerg Med J. 2014;31(8):684-691.
Characterizing Frequent Users of Emergency
Medical Services: An Updated Systematic Review
||Christopher S Evans ||
University of North Carolina at Chapel Hill Gillings’ School of Global Public Health
Public Health Leadership Program Health Care & Prevention Track
INTRODUCTION
Repeated or frequent utilization of a healthcare service can be very costly,1,2 and also implies that the care such patients are receiving is not addressing their needs in some way.3,4
Frequent utilization of emergency department (ED) services has been extensively studied, 5–13,14
The proportion of adult ED patients arriving by ambulance has been reported to be
approximately 15-25%.15,16 Despite the significant overlap of EMS and ED-based care of those arriving via ambulance, much less is known about the frequent use of EMS or ambulance
services compared to ED use. Furthermore, patients who frequently use emergency departments
and EMS differ, further challenging interventions aimed at reducing frequent use.
In a systematic review published in Emergency Medicine Journal in 2014, Scott et al.
were the first researchers to explore the current body of literature regarding frequent callers to
and users of emergency medical systems as a distinct cohort of patients from emergency
departments more generally.17 Although the Scott et al. review was published in 2014, the literature search was performed in November 2011. The Scott et al. search yielded 2,409
articles, of which 18 met inclusion criteria, and 7 studies were specific to EMS settings. They
found great variation regarding the definition of “frequent use” in EMS studies, and no two
studies used the same definition. As a result, a key finding from their review was that further
research was needed to better understand how to define “frequent use” in the EMS setting. In
light of the varied definition of frequent use, which was the outcome measured in Scott el al.’s
systematic review, comparisons between studies and characteristics associated with frequent use
is challenging. In general, frequent users of EMS were more likely to suffer non-trauma events,
intoxication, seizure, and respiratory issues, compared to non-frequent users. They were also
more likely to be African American, be from a lower socioeconomic status (as measured by
homeless and public insurance), and older age.
Rationale
Given the gaps in the literature identified from the Scott et al. systematic review
performed five years ago, we felt an updated systematic review was needed to better understand
frequent EMS use. To aid in comparison between this systematic review and prior work, we have
modeled this review similar to the Scott et al review with some exceptions outlined below.
Specifically, with a better understanding of patient characteristics that predict frequent EMS use,
we propose that interventions aimed at reducing repeat use will be better focused. Additionally,
building off of the work of Scott et al., an updated systematic review with special attention to
older adults is warranted, given the paucity of literature identified in the prior review. The
population aged 65 years and older in the United States continues to rapidly increase and by
2030 is expected to reach over 72 million people, corresponding to 20% of the U.S. population.18 Furthermore, previous studies have shown that older adults use EDs and EMS disproportionately
more than younger patients,19,20,21
Objective
The primary objective of this study is to assess the past five years of primary medical
literature in order to better understand the following: Among Emergency Medical Services
(EMS) patients age 18 years or older, what patient demographics (including age, race, sex,
conditions), have been associated with repeat EMS use. Multiple definitions of repeat EMS use
will be assessed including follow up time ranging from 1 day to 4 years after index EMS visit.
Table 6. Key Questions for Frequent Users of Emergency Medical Services: An Updated Systematic Review
KQ1: What are the described demographic (including age, race, sex and insurance status) and comorbid characteristics (including seizure disorder, substance use, and mental health)
associated with repeat EMS use, as defined as more than one EMS visit ranging from one day-4 years after index visit?*
KQ2: What efforts have been made to standardize the definition of frequent EMS use in terms of number of events and and time from initial EMS encounter?
KQ3: How do characteristics of repeat EMS use vary according to age (16-65 years old vs. >65 years old) and rural vs. urban EMS systems?
* primary time interest will be frequent use within 30 and 90 days
METHODS
Search Strategy
A systematic search of the biomedical literature was performed using the following
databases: PubMed/MEDLINE, EMBASE, and CINAHL. Clinicaltrials.gov was searched but
returned no relevant trials by title review. All databases were restricted to English language,
human subjects, and with publication date from January 1st 2011 to date of search. All databases were searched on March 1st, 2016 and search results were uploaded into Covidence systematic review package at that time. (http://www.covidence.org)
The search strategy employed keywords related to “Emergency Medical Services” and
“Frequent” as outlined in Appendix 2. Key search terms were initially based on the prior
systematic review on the topic performed in 2011,17 and further developed in coordination with a health services librarian at the University of North Carolina at Chapel Hill trained in systematic
Inclusion Criteria and Selection of Articles
As a guide throughout the systematic review, we utilized the PRISMA standards of
reporting systematic reviews. All search results were determined for eligibility for review if they
were English language primary research articles among EMS patients older than 16 years old
that used repeat EMS use as an outcome measure. A complete description of eligibility criterion
is listed in Table 7 using the commonly used PICOTS framework. One author (CE) assessed all
titles and abstracts. If a title or abstract potentially met eligibility criteria, it was included for full
text review. One author (CE) assessed all full text articles for eligibility, and if ineligible, noted
the reason for exclusion.
Quality Assessment
Once articles were deemed to meet eligibility criteria in the full text review stage, an
Excel spreadsheet was developed to aid in data extraction. To assess risk of bias, all included
studies were given quality grading using the same quality assessment tool used by Scott et al.
The quality assessment tool used was the Manual for Quality Scoring of Quantitative Studies,22 and is available publicly online.23 Studies were assessed and given a quality score ranging strong to weak. However, no studies were excluded based on quality rating. One author (CE) assigned
quality scores to included studies, and as such, no procedures for discrepancies in quality scores
were employed.
Data Synthesis and Analysis
The evidence was stratified by the source of study data (Emergency Department vs. EMS
easier comparability between systematic review findings. Given the significant heterogeneity
within definitions of frequent use identified in the Scott et al. review, we decided a priori to not
perform quantitative meta-analysis estimates. However, descriptive statistics of individual
studies were reported including measures of association (odds ratios and risk ratios) along with
95% confidence intervals and p values if applicable, to allow readers to qualitatively observe
trends in the characteristics of repeat EMS use.
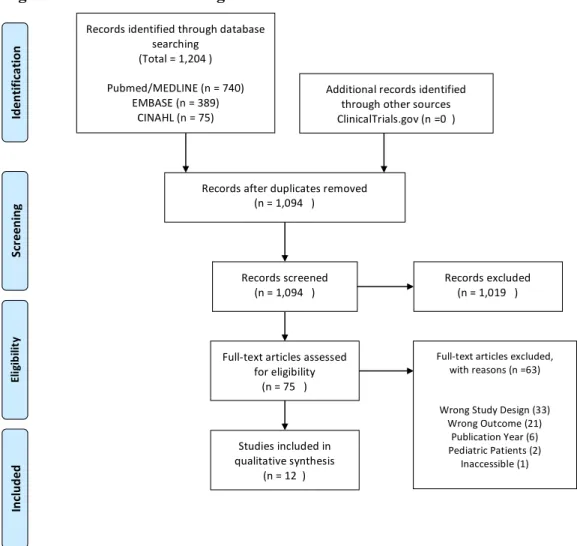
RESULTS
The search strategy we used found a total of 1,204 articles (740, 389, and 75, from
PubMed, EMBASE, and CINAHL, respectively). After duplicates were removed, 1,094 article
were screened by title and abstract. Seventy-five articles were assessed for full text eligibility.
Sixty-three articles were excluded after full text review for the following reasons: wrong study
design (33), wrong outcome (21), publication year (6), pediatric population (2), and article
inaccessible/no longer available (1). In total, twelve articles met inclusion criteria and are cited in
Appendix 3. Figure 2 shows the PRISMA flow diagram of all search results.
Study Designs/ Definition of Frequent or Repeat Use
The twelve included studies comprised the following study designs; prospective cohort (2),
retrospective cohort (1), pre-post intervention cohort (5), and case-control (4). The included
studies were carried out in the United States, United Kingdom, Switzerland, and Australia.
Consistent with the review by Scott et al, our review suggests great heterogeneity in the
definitions used when classifying frequent or repeat EMS use. (Table 8) Three studies defined
differed in the number of EMS encounters between categories.24–26 Other studies identified the 25 or 100 most frequent EMS users within a given EMS system or hospital catchment area.27,28 Furthermore, other definitions used included repeat EMS encounters within a six month
follow-up period,29 as well as six or more EMS encounters during a 23 month study period.30 In the included studies there was no descriptions of attempts to standardize the definition of what
constitutes frequent or repeat EMS use. Study sample sizes also differed with as few as 10
patients to as many as 135,122 patients, with interventional and prospective studies having
smaller sample sizes. All studies except one used EMS or pre-hospital data collection methods,31 and one study used EMS in addition to inpatient and ED data sources.25 Overall, studies were assessed to have weak to moderate quality, with only one study assessed to be strong.
Older Adults and Other Subgroups
Several studies looked at specific subgroups and/or specific populations within their
study population. Two specifically studied EMS use in older adults, both of which focused on
older adults who had fallen. Tiedemann et al. defined older adults as aged 70 years and older in
community dwelling adults32, and Simpson defined older adults as aged 65 years and older.32 Neither study of older adults specifically studied differences in rural versus urban community
dwelling older adults. Additionally, Work by Holzer et al. focused on intoxicated patients,33 and Mackleprang et al. work focused on chronically homeless patients with substance abuse.34
Frequent Users of EMS
Although frequent users of EMS were found to be a heterogeneous group of patients,
summarizes key findings from included studies. In general, patients with frequent EMS use were
more likely to be middle aged (40-50 years old) men, have chronic medical conditions including
commonly comorbid mental illness or substance use, and more likely to call for medical/surgical
rather than traumatic injuries. In studies that stratify into different frequent use groups such as
Norman et al, “low frequent” users were found to be more likely to use EMS for re-occurring
diagnosis without substance use or mental health concerns compared to those patients in more
frequent use groupings.
Interventions to Reduce Frequent EMS Use
Five of the included studies included interventions aimed at reducing frequent EMS use
and are summarized in Table 10. All five included interventions that included intensive case
management. Edwards et al intervention included a Patient Centered Action Team (PCAT),
which included intensive case review, case management, and patient-specific protocols. Tadros
et al. included a Resource Access Program (RAP) which in addition to case management, also
expanded EMS surveillance capabilities for frequent users. Mackleprang et al studied the effects
of implementing a single site housing first (HF) model. All of these interventions suggested
benefit as measured by decreased EMS use (range 32-54% reduction), but were limited by using
pre-post intervention study design without a control group.
DISCUSSION
This systematic review set out to determine the characteristics of frequent or repeat EMS
use that has been described in the medical literature since a prior systematic review
study design and evidence, this review does not attempt to quantitatively assess the evidence or
pool estimates. However, in general, the strength of evidence across all studies is assessed to be
weak-moderate strength, largely due to study designs that increase the risk of bias. However, this
review suggests that some progress has been made to further characterize frequent EMS use and
allows for more clear comparison to frequent use in other settings such as emergency
departments. However, great uncertainty remains about the best method for defining what
constitutes frequent or repeat EMS use, or whether frequent EMS use should include all EMS
encounters or simply those encounters that result in transport.
Similar to the findings of the Scott et. al review, our review found frequent users of EMS
are more likely to seek care for non-trauma conditions, have a high chronic medical comorbidity
burden, often have comorbid mental illness and/or substance use, and more likely to be male.
Interestingly, this review suggests that within the heterogeneous group of frequent users, there
may be more homogenous groups within subsets of the frequency of use. For example, the most
represented age group in the low-frequent group of patients in Norman et al was patients aged 65
years and older who had re-occurring medical diagnosis related to the frequent use and no
substance use or mental illness. Within the older adults’ subgroup, this review highlighted that
little is known about older adults who frequently use EMS for reasons other than falls.
Every study reporting on interventions aimed at reducing EMS use lacked control groups
and often employed ecological analytic methods, and as such were subject to significant risk of
bias. Despite this, intervention studies which used prominent case management did show
substantial reductions in EMS utilization, but it is unclear how long such effects would endure or
Limitations
Many limitations exist with the studies included in this review. Most importantly, only
one study was deemed to be of strong quality, with a majority being reviewed as weak quality.
Much of the evidence base is limited to observational study designs using secondary data
collection. Furthermore, studies did not report findings uniformly, especially regarding number
of EMS encounters that did and did not result in transport on an individual level. As highlighted
by Scott et al., there is also significant potential for publication bias in these studies.
Unfortunately, there is limited methods for accounting for this, as most studies are observational
and not clinical trials that may be recorded in repositories like ClinicalTrials.gov. Furthermore,
this systematic review used a single author for full text reviews and quality assessment.
CONCLUSIONS
This systematic review suggests a limited evidence base for understanding frequent users
of EMS. However, from the current evidence, frequent users of EMS are a quite heterogeneous
group of patients. In general, frequent users of EMS are middle aged, more likely men, use EMS
services for non-trauma reasons, and often have high chronic comorbid medical problems as well
as mental illness and substance use. Among older adults, the only studies of repeat or frequent
use have been limited to fall victims. Collectively, further research is needed to better define
what constitutes frequent or repeat EMS use, as well as methods of stratifying patients into
groups with more uniform reasons for utilizing EMS as a means to more effectively target
Table 7: Study Eligibility Criteria
PICOTS Criteria
Population(s) EMS patients or emergency department patient arriving by ambulance that are age 16 years or greater requiring repeat EMS use.
Subgroups of interest include:
• elderly
• racial minorities
• patients with history of substance abuse or psychiatric co-morbidity
Published in English
Refers to frequent callers to or users of emergency medical services or
Refers to frequent users of other services where admissions were via ambulance
Exposure Age, race, sex
History of substance use, seizure disorder, mental health comorbidities
Comparators Non-repeat EMS users or pre intervention group in pre and post intervention study designs
Outcomes Primary Outcome:
• Repeat EMS transport/use
Secondary Outcomes:
• EMS calls (not transported)
Timing Published after January 2011
Setting /
Study Design Data collected in either emergency department setting or emergency medical services (EMS) datasets
' ' '
Table'8:'Characteristics'of'Included'Studies'(listed'in'Alphabetical'Order'by'First'Author)'
Author(s)'' Country'' Study'Design' Study'Setting'/'Special'
Population'' Sample'Size''(individuals)'' Definition'of'Frequent'' Quality'Score''
DK!2012! USA! Pre]Post!
Intervention!! EMS!Boston!EMS!Database! 10! Not!Defined!! Weak!! Edwards!
2015! UK!! Pre]Post!Intervention!! EMS!London!Ambulance! Service!(LAS)! 110! >!10!calls/month!for!at!least!3!months!!! ! OR!! ! when!quantity!of!calls!is!considered!to! have!significant!impact!on!resources! ! Weak!!
Hall!2015! USA! Retrospective!!
Case]Control!! EMS!!!!!
San!Francisco!Fire! 31,462! EMS!encounters!in!1!year! ! Low!users!(1!encounter)! Moderate!users!(2]4!encounters)! High!users!(5]14!encounters)! Super!users!(>14!encounters)!! Moderate! Holzer!
2013! Switzerland! Retrospective!!Case]Control!! EMS!!!
Largest!EMS!service!in! Zurich!!
1,490!!
! >1!ambulance!service!use!within!1!year!period!for!intoxication!! Moderate!
Knowlton!
2013! USA! Retrospective!!Case]Control!! EMS!!
Baltimore!Fire!! 135,122! >=6!EMS!encounters!in!23!months!! ! Range!6]199!EMS!incidents! Strong! Mackelpra
ng!2014! USA! Pre]Post!Intervention!! EMS!!!
Patients!who!moved! into!HF!facility!from! Dec!2005]!March!2007!
91!!! Not!defined!! Moderate!
Rinke!2012! USA! Pre]Post!
Intervention!! EMS!!
Baltimore!Fire!2008! 10! 25!individuals!with!most!EMS!activations!! ! Range!of!EMS!transports!over!12!months! (pre!intervention):!6]130!transports! Weak!!
Scott!2014! UK!! Retrospective!
Case]Control!! EMS!!
Yorkshire!Ambulance! Service!(YAS)! ! 200! 100!most!frequent!callers!to!YAS!in!12! months! Moderate! Simpson!
2014! AUS! Prospective!Cohort!! EMS!Ambulance!service!of! New!South!Wales! (ASNSW)! !
Tadros!
2012! USA! Pre]Post!Intervention! Cohort!
EMS,!! !
San!Diego!! !
!
51! >=!10!EMS!transports!within!12!
months! Weak!!
Tiedemann!
2013! Australia! Prospective!Cohort!! EMS!!
Ambulance!service!of! New!South!Wales!! !
262! Repeat!EMS!encounter!within!6!
months!! Moderate!
Norman!
2016! USA! Retrospective!Cohort! EMS!!
Providence,!RI!Fire! Department!! !
539! EMS!transports!within!12!months:! Low!Frequent!(4!transports)! Medium!Frequent!(5]6!transports)! High!Frequent!(7]10!transports)! Super!Frequent!(>=11!!transports)!
Table'9:'Studies'Identifying'Characteristics'of'Frequent'Users'of'Emergency'Medical'Services' ' Author(s)'' Number'of' Frequent' Users' Number'of'
Transports' Frequent'User'Characteristics'' Significance'Level''
DK!2012! 10! Not!reported! Not!Reported! P<0.05! Edwards!
2015! 110! Not!reported! Mean!age!57.6!years!+/]!21.4!45%!male!! ! Categories:!! Clinical/Medical!Need!(64%)! Mental!Illness!(40%)! Elderly!(38%)! Social/Personal!Care!(28%)! Suicidal!Ideation!(16%)! N/A!! Hall!2015! 705!! (100!Super!User,! 605!High!user)!! "Super!User"!=!100! (2,668!visits)! High!User!=!605! (4,436!visits)! 6,!394! ! ! ! Male!(>60%!in!high!frequency!group!and!super]user!group)! Only!1!encounter]!more!likely!younger!and!for!trauma!! ! EMS!Super]users!more!likely!to!be!middle!aged!and!have!alcohol! use!documented!by!paramedics! ]! Holzer!
2013! 185! 506! Repeat!Ambulance!users!(for!intoxication):!!More!likely!during!weekdays! 45.6!years!vs.!37.3!years!
Less!often!injured!!
More!likely!to!show!aggression!towards!medics!
P<0.05!
Knowlton!
2013! 1,969! 95%!of!all!incidents!by! frequent!users! Race!(black!as!referent)! !!!!White!OR!0.91!(95%!CI!0.82]1.01)! !!!!Other!OR!0.26!(95%!CI!0.16]0.42)! Female!OR!0.92!(0.84]1.01)! Frequent!Use!Incident!Characteristics:!! !!!Behavioral!Health!(OR!6.63!95%CI!6.04]7.28)! !!!Diabetes!(OR!5.83!95%!CI!3.54]4.25)!! !!!Asthma!(OR!4.47!95%CI!4.08]4.89)!! !!!HIV/AIDS!(OR!4.14!95%CI!3.54]4.85)!! ! Incidents!by!frequent!users!proportionally!more!like!to!be!for! medical!or!surgical!94.8%!vs!82.9%,!respectively,!than!trauma! related!(5.1%!vs!16.7%,!both!p<0.001)!! P<0.05! Mackelpr ang!2014! 91!!
1,576!EMS! contacts!(pre)! 852!EMS! contacts!(post)!! 1,481! 93.4%!Male!! 52%!Single,!never!married! 39%!Some!high!school!education!! 90%!met!definition!of!alcohol!dependence! ! 20%!and!23%!of!incidents!were!for!trauma!(pre/post)! 48%!and!51%!of!incidents!were!for!medical!illness!(pre/post)!! N/A! Rinke!
2012! 10! Not!Reported! 60%!male!!70%!mental!health!and/or!substance!use!diagnosis!! 100%!had!2!or!more!comorbid!conditions!
90%!Insured!!
Scott!
2014! 100!Callers!(7,808!calls)! 2,729!! 46%!Men!(of!the!100!frequent!callers)!Men!more!likely!to!call!for!overdose/poisoning!and!psychiatric!than! women!(no!other!significant!difference!for!reason!of!call!between! sex)! ! Time!of!day:!(frequent!caller!more!likely!than!non]frequent)! ]4:00]9:00!(16.2%!vs.!12.2%)! ]16:00]20:00!(22%!vs.!20.2%)! ]22:00]02:00!!(17.6%!vs.!15.5%)!! *P<0.001! ! More!likely!to!call!in!Dec,!Jan,!Feb! (30.1%!vs.!26%,!P!<0.001)!! ! Call!reasons!which!were!>1%!greater!than!controls:!! Abdominal!pain/!problems!(6.6%!vs.!3.4%)! Breathing!Problem!(16.4%!vs.!10.5%)! Cheat!Pain!(non]traumatic)!(13.6%!vs.!10.0%)! Headache!(3.0%!vs.!0.8%)! Psychiatric/Behavioral/Suicide!Attempt!(10.3%!vs.!2.4%)! Sick!Person!(19.1%!vs.!8.1%)! *all!with!P!values!<0.001! P<0.05! Simpson!
2014! 1,610!older!adults!who! had!fallen!! Not!reported! 56%!of!patients!with!a!fall!had!previously!used!ambulance!services! prior!to!fall,!16%!within!the!prior!4!weeks!! ! *Does!not!report!exact!number!with!repeat!use!! Not!reported! Tadros!
2012! 51!patients!with!10!or! more!EMS! transports!in! prior!year! Not!reported! Frequent!Users:!! Male!(64.7%)! Homelessness!(58.5%)! 40]59!years!old!(72.5%)! Alcohol!use!(49%)! Psychiatric!Comorbidities!(68.6%)!! p<0.05!! Tiedeman
n!2013! 216!older!adults!who! were! attended!by! ambulance! for!falls!but! not! transported! 134!EMS! encounters!in! follow!up! period,!of!those! 54!required! transport!to!an! ED! Multivariable!predictors!of!repeat!ambulance!Use:!! 3+!falls!in!past!year!OR!2.39!(95%CI!1.05]5.48)!! Assistance!with!personal!care!ADL's!OR!2.09!(95%CI!1.13]3.86)!! Disabling!pain!in!past!month!OR!2.16!(95%CI!0.89]5.23)!!! p<0.05! Norman!
2016! ! ! Frequent!Users:!!!
' '
Table'10:'Outcomes!of!Frequent!User!Clinical!Case!Management!on!Emergency!Medical!Services''
Author(s)' Study' Setting'' Intervention' Components' Number'of' Participants' Intervention'Outcomes' Sig' Level''
DK!2012! ED! Mandatory! Inpatient!Alcohol! Detoxification!! 10! Primary!Outcome:!ED!visits!! ! Secondary!outcome:!Mean!EMS!transports! No!significant!change!in!mean!number!of!EMS! transports!! Pre/Post!mean!EMS!transports:!! 1!month:!4.6!(+/]!4.4)!vs.!2.3!(+/]!3.0)!! p<0.05! Edwards! 2015! EMS! PCAT!"Patient! Centered!Action! Team"! ]!multiagency! meetings!with!case! review!of!patient! needs! ]!Individual! Dispatch!Protocol! (IDP)! ]!Patient!Specific! Protocol!(PSP)! 110! Median!calls/month! Pre]intervention!:!5!!(0.6]!24.5)! Post]!intervention:!0!(0]!8)! p<0.05! Mackelprang! 2014! Housing! First! Facility!! Single!Site!Housing! First!(HF)!Model!! 91!! ! chronically! homeless! adults! 54%!reduction!in!EMS!contacts!across!full!sample! between!pre/post! ! Mean!number!of!EMS!contacts:!! Pre]!intervention:!15.9!(SD!23.0)!! Post]!intervention:!9.5!(SD!15.1)! *P<0.001! ! Single!site!HF!associated!with!3%!fewer!EMS!contacts! for!each!additional!month!of!HF!exposure!!IRR!0.97! (95%!CI!0.94]0.99)!! p<0.05!
Rinke!2012! EMS! Weekly!case! management!for! 5]12!weeks! 10! Decreased!transport!responses!among!10!enrolled! from!a!predicted!76!to!52!transports.! ! 32%!reduction!in!transports! N/A!
From: Moher D, Liberati A, Tetzlaff J, Altman DG, The PRISMA Group (2009). Preferred Reporting Items for Systematic Reviews and M
eta-Analyses: The PRISMA Statement. PLoS Med 6(7): e1000097. doi:10.1371/journal.pmed1000097
For$more$information,$visit$www.prisma2statement.org.
Figure 2: PRIMSA Flow Diagram of Included Studies
Records(identified(through(database( searching( (Total(=(1,204()( ( Pubmed/MEDLINE((n(=(740)(( EMBASE((n(=(389)(( CINAHL((n(=(75)(( ( Sc re en in g$ In cl ud ed $ El ig ib ili ty $ Id en tif ic ati on $ Additional(records(identified( through(other(sources( ClinicalTrials.gov((n(=0(()( Records(after(duplicates(removed( (n(=(1,094((()( Records(screened(
(n(=(1,094((()( Records(excluded((n(=(1,019((()(
Appendix 2:
Search strategy for systematic review
PUBMED/Medline
Limited to published w/in last 5 years. English language only. Human Subjects.
Emergency Medical Services:
"Emergency Medical Services"[Mesh] OR prehospital
OR pre-hospital
OR “emergency medical service*” OR “emergency medical technician*” OR paramedic*
OR ambulance* OR “ambulance service” OR “ambulance trust” OR “EMS” OR “EMS transport*” OR “Patient transport” OR “911” OR “999”
Frequent:
“frequent caller*” OR “frequent use”
OR “health services misuse”[MeSH] OR “frequent use”
OR “frequent flyer” OR “frequent attendee” OR “high use”
OR “heavy use” OR “repeat* use” OR “recidivism” OR “hyperuse” OR “superuser” OR “frequent* use” OR “EMS utilization” OR “higher rate” OR repeat
CINHAL:
Emergency Medical Services: “Emergency Medical Services” OR prehospital
OR pre-hospital
OR “emergency medical service*” OR “emergency medical technician*” OR paramedic*
OR “ambulances” Frequent:
“frequent caller*” OR “frequent use” OR “frequent flyer” OR “frequent attendee” OR “high use”
OR “heavy use” OR “repeat* use” OR “recidivism” OR “hyperuse” OR “superuser” OR “frequent* use” OR “EMS utilization” OR “higher rate” OR repeat
EMBASE:
Emergency Medical Services: “Emergency Medical Services” OR prehospital
OR pre-hospital
OR “emergency medical service*” OR “emergency medical technician*” OR paramedic*
OR ambulance* OR “ambulance service” OR “ambulance trust” OR “EMS” OR “EMS transport*” OR “Patient transport” OR “911” OR “999”
OR “transport of patient*” OR “ambulances”
Frequent:
“frequent caller*” OR “frequent use” OR “frequent use” OR “frequent flyer” OR “frequent attendee” OR “high use”
Appendix 3: List of Included Studies
DK et al. 2012 31 Edwards et al. 2015 35 Norman 2016 26 Hall et al. 2015 24 Holzer et al. 2013 36 Knowlton et al. 2013 37 Mackelprang et al. 2014 34 Rinke et al. 2012 38