ORIGINAL ARTICLE
Prediction of the “Tipping Point” to Widespread Uptake of Battery
Electric Vehicles in China via Nonlinear Curve-Fitting Method
Zeyu Geng*
Department of Chemical Engineering, The University of Queensland, Brisbane 4072, Australia. E-mail: [email protected]
Abstract: The “Tipping Point” is a term that is widely used today to describe that a time or threshold once being sur-passed would result in exponential growth in technology adoption or product sales in a specific industry. China’s BEV industry has grown tremendously in the past 10 years and recently, and China has been leading both BEV sales and manufacturing in the world. Thus, this paper aims to investigate the “Tipping Point” timeframe for Battery Electric Ve-hicles (BEVs) penetration in China. The major work is conducted in 3 steps. 1. This paper firstly defined the exactitude of “Tipping Point” as a 16% market penetration rate from Roger’s technology adoption model. 2. Then this paper used a simple exponential curve formula using the Levenberg–Marquardt Algorithm (LMA) calculation method to conduct nonlinear curve fitting modeling for various nations and testify the validity of our formula used. 3. Finally, after getting a positive result from these sample countries, this paper continues using this method to predict the 16% “Tipping Point” from several current predictions reports. It concludes with a calculated assumption that this 16% BEV market penetra-tion rate would most likely occur by the end of 2024.
Keywords: Tipping Point; Electric Vehicles; Nonlinear Curve Fitting; Technology Adoption Rate
1. Introduction
There is an undeniable fact that global warming and the accumulation of greenhouse gases (GHGs) is one of the most daunting challenges that the world has to face in the 21st century[1]. The transport sector accounted for over 20% of the total emissions and China is currently the biggest GHGs emitters globally[2]. On the other hand, China’s foreign oil de-pendence had reached over 50% by 2015. Pollution reduction was also one of the key focuses of the Chinese 13th FYP[3]. Thus, China has enough reasons to forcefully push BEVs’ penetration. Just like the IEA report[2] indicated, China has been pushing hard on promoting battery electric vehicles (BEVs) and China’s BEVs’ sales have made up over 50% of global total purchase. For every product or industry, the pinpointing of the tipping point and the study of critical mass from the S-curve are essential for entrepreneurial evaluations. Before the inflection point (tipping point), there wouldn’t be a lot of observable changes. However, once the tipping point is surpassed, it has been shown that this product or industry would experience a dramatic even exponential growth in their overall performance[4]. This expo-nential growth period would bring tremendous opportunities for industries and associated elements as a whole.
2. Definition of the “Tipping Point”
The definition of “Tipping Point” was first invented by Malcolm Gladwell in 2000. It means that the moment of critical mass, or threshold after being surpassed would result in exponential growth in development[4]. For a tipping point to be reached, a percentage of the population has to be covered to trigger this explosive momentum[5].
Scholar Rogers classified this innovation adopter population into 5 different groups: innovators, early adopters, early majority, late majority, and laggards[6]. These groups represented 2.5%, 13.5%, 34%, 34%, and 6% of the popula-tion. The adoption of technology by the second 13.5% of the early adopters groups usually marks the tipping point in the technology diffusion process[7]. Based on this theory, the tipping point can be pinned down within the range of 2.5% - 16% of the total adopters. Assuming this theory is valid, we can assume 16% of the adoption rate as the tipping point with 100% possibility and 2.5% adoption rate with 0% possibility given the middle 13.5% range being equally likely to tip like Figure 1 suggested.
Figure 1. Innovation adoption model[6]
3. Modeling methodology & penetration comparisons
For the simplicity of the research, we utilized the simple exponential growth curve under the Levenberg– Marquardt Algorithm (LMA) calculation method to conduct our nonlinear curve fitting modeling for various nations. y = a ∗ ebt
“y” is the prediction value. “t” is time. “e” is natural logarithm as 2.718. “a” and “b” are both model parameters. Research[8] has been shown that this simple exponential prediction model is mainly used for products or technologies development speed and changing trends before the tipping point. It is also especially useful for technology diffusion initial stage evaluations when economic and technological features are in undergoing steady growth and also being far away from their peaking point. Thus, this formula can be a great tool for our analysis.
Tipping Point with 100% possibility (16%) penetration
Saturation Point with 100% possibility (84%) penetration
Figure 2. Norway, Netherland, Sweden, California, Germany, and China BEV penetration.
Source: statista.com
Surprisingly, the adjusted R square ranged from 0.90-0.987. If we utilized the definition from the basic principle of statistics[9], since R2 explained the percentage of variance from the dependent variables which can be attributed to the independent variables, and above 0.9 adjusted R2 indicated a high level of alignment curve fitting performance. Thus,
Figure 3. China NEV sales structure
Source: [10]
The term New Energy Vehicle (NEV) is widely used in many domestic and foreign reports. We need to strip away the percentage of commercial vehicles and PHEVs from our future NEVs projections. From Figure 3, it is vivid that the percentage of commercial vehicles has gradually decreased from 34% in 2016 to 12% in 2019. Thus we assume that the future commercial vehicle shares would be around 10%. From 2016 to 2019, the BEV to total NEV passenger vehi-cle sales ranges from 75.7% to 81.1%. This contributes to our assumption that BEVs would make up 80% of the New Energy Passenger Vehicles Sales in the upcoming future.
5. China’s BEV “Tipping Point” predictions
Thus, based on this simple exponential prediction model’s curve fitting promising results and its suitable applica-tion criteria, we would utilize this model to predict China’s BEV future penetraapplica-tion rates from different perspectives:
1. Model forecast based on solely 2013-2019 China’s BEV penetration data.
2. Model forecast based on both 2013-2019 data plus Mckinsey & Company’s 2024 China’s BEV sales projection. 3. Model forecast based on both 2013-2019 data plus “NEV Auto Industry Development Plan 2021-2035”. 4. Model forecast based on both 2013-2019 data plus statista data research projection.
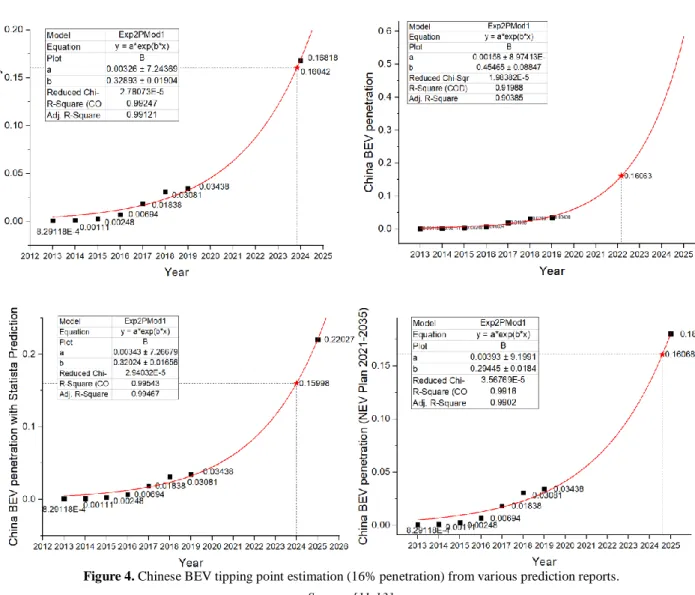
From figure 4, the model’s self-performance and the performances with other prediction data yield different results. The upper-left model’s self-prediction yielded the most optimistic result of 2023, and China’s BEV market penetration would reach 16%.
The Mckinsey report expected that China would have 3.7 million BEVs by the end of 2024, which translated into 16.8% of penetration by the end of 2024 and a tipping point 16% shown in the second half of 2024[11].
The China NEV 2021-2035 development plan prediction and statista prediction suggested similar results since they predicted by 2025, China would have 25% of NEV to total sales. If we assume that China’s annual PVS will be around 22 million, then there will be 5.5 million NEV sales[12]. 4.95 million new energy passenger vehicles and a fur-ther 3.96 million BEVs will be calculated. Thus, based on our model in Appendix 1 and 2, by 2025, China’s BEV pene-tration will be 18%. Thus our model suggested that the 16% tipping point would be reached during the middle of 2025. The statista data research report[13] estimated that by 2025, there will be 4.846 million BEV sold, and given our assumed passenger vehicle sales of annual 22 million, there will be 22% BEV penetration by the end of 2025.
Figure 4. Chinese BEV tipping point estimation (16% penetration) from various prediction reports.
Source: [11-13]
Thus the tipping point from this model and our formula yielded that the end of 2024 would be the tipping 16% penetration rate. So the tipping point ranges from the year 2023 to middle 2025, and two other estimates fell into the second half of 2024. If we take the average of these 4 estimations, China’s BEV 16% tipping point market penetrations will be most likely reached by the end of the year 2024.
6. Potential limitation of the study
There are undoubtedly limitations in our study. Thus, for the betterment of future research, we summarized a few limitations:
1. For the simple exponential growth formula, it may be too simple to capture the essential factors like those done in other studies. Our approach is a general top to bottom, the one that aims to describe the historical trend and use it to predict the future. Other studies built their models from bottom to the top and generalized various factors into future predictions. The bottom to top approach may have a higher accuracy in their quantitative predictions than ours.
References
1. Saul B, Sherwood S, McAdam J, et al. Climate change and Australia: Warming to the global challenge. Annandale, NSW: The Federation Press; 2012.
2. World energy outlook. Australia: International Energy Agency; 2016.
3. China international energy data and analysis. USA: Energy Information Administration; 2015.
4. Gladwell M. The tipping point: How little things can make a big difference. Harvard Business Review 2000. 5. Ball P. Critical mass: How one thing leads to another? New York: Farrar, Straus, and Giroux; 2004.
6. Rogers EM. Diffusion of innovations. 5th ed. New York: Free Press; 2003.
7. Egbue O, Long S, Samaranayake VA. Mass deployment of sustainable transportation: Evaluation of factors that influence electric vehicle adoption. Clean Technol. Environ. Policy 2017.
8. Peng N, Hu Z. Applied economic prediction and decision. Changsha: Zhongnan University Press; 1997.
9. Moore DS, Notz W, Fligner MA. The basic practice of statistics. 7th ed. New York: W. H. Freeman and Co.; 2015. 10. Chyxx.com. 2019 China BEV passenger vehicle sales and structure analysis [Internet]. [cited 2020 Feb 20].
Available from: http://www.chyxx.com/industry/202002/835756.html.
11. Guan M, et al. Mckinsey China auto consumer insights 2019. USA: Mckinsey & Company; 2020. 12. China NEV development 2021-2035. Beijing: MIIT; 2019.
![Figure 1. Innovation adoption model [6]](https://thumb-us.123doks.com/thumbv2/123dok_us/8368529.2222568/2.893.225.676.391.694/figure-innovation-adoption-model.webp)

![Figure 3. China NEV sales structure Source: [10]](https://thumb-us.123doks.com/thumbv2/123dok_us/8368529.2222568/4.893.241.658.115.368/figure-china-nev-sales-structure-source.webp)